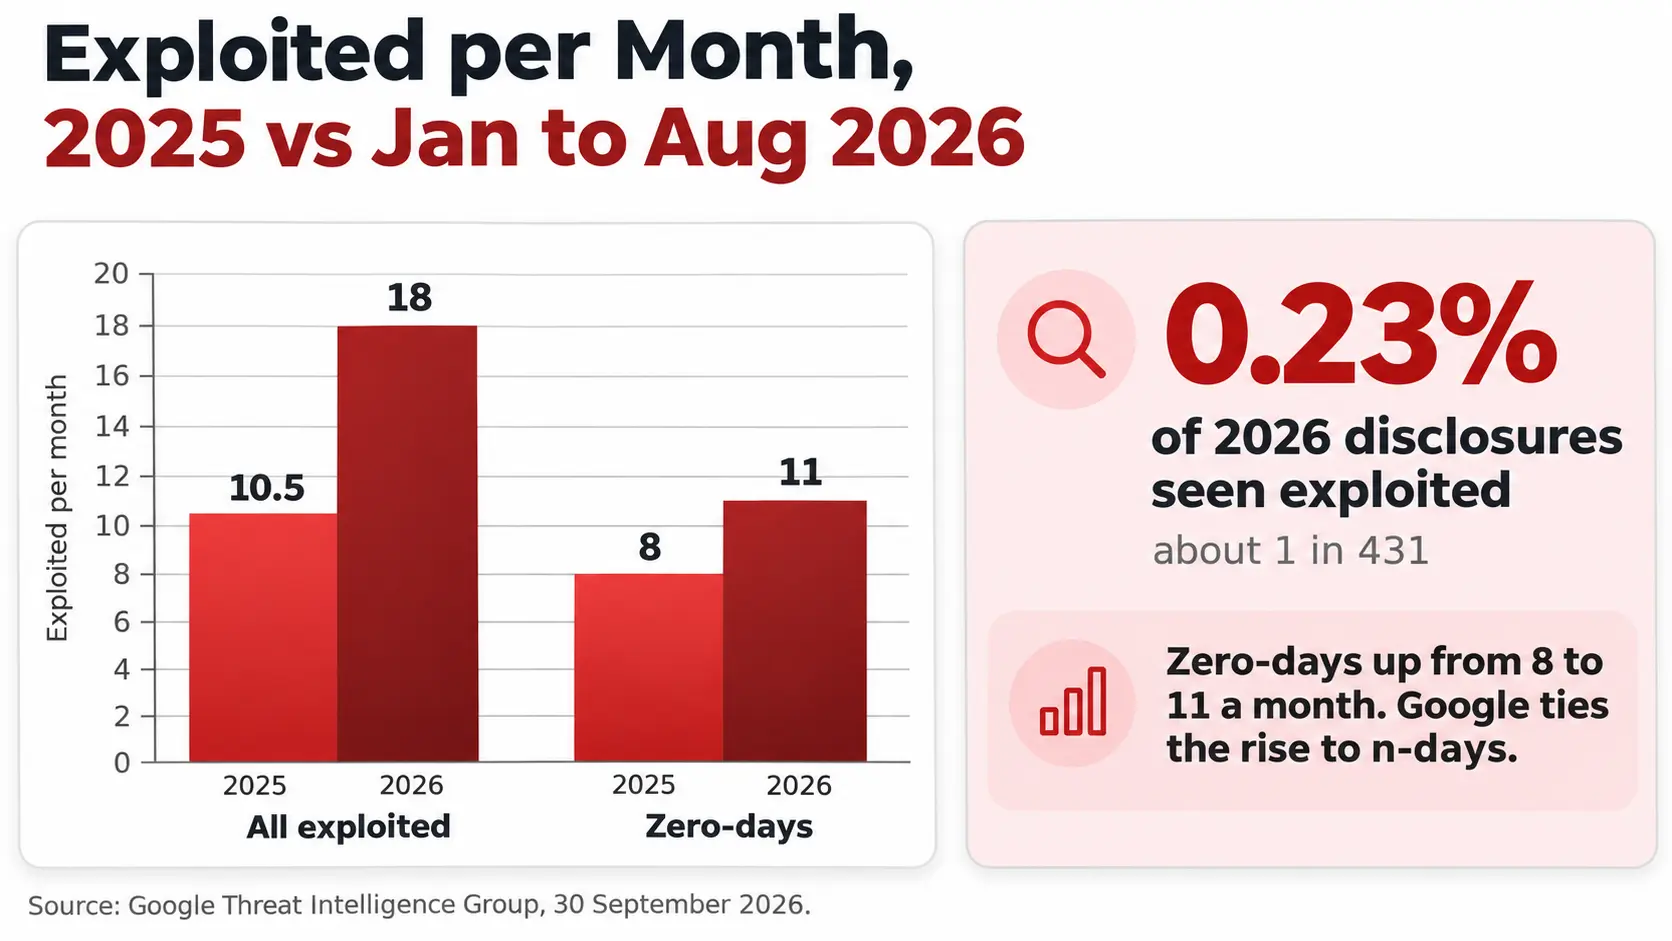
Zero-day statistics show Google counted 90 zero-days exploited in the wild in 2025, inside a range of 60 to 100 a year for five years, and Google’s 2026 update says the rise in exploitation this year is n-days, not new zero-days: 141 vulnerabilities were exploited from January to August 2026 against 127 in all of 2025, while zero-days moved from 8 to 11 a month. Enterprise products were 48% of the 2025 zero-days, a record. Other sources count something else under the same name: VulnCheck found 28.96% of its 2025 exploited flaws were exploited on or before the day the CVE was published, and ScanTitan’s count of CISA’s catalog shows 20.7% of flaws added since 2023 were listed by that day. These counts measure different things, and most zero-day statistics pages put them side by side as if they agreed. This research keeps each count separate, shows how ScanTitan counted from public data, labels vendor figures as vendor-only, and says where a popular number does not hold up. Data last checked: 12 November 2026.
Key Zero-Day Statistics for 2026
Executive Benchmark: Zero-Day Statistics for 2026
| Metric | Latest figure | Period | Trend / context | Source |
|---|---|---|---|---|
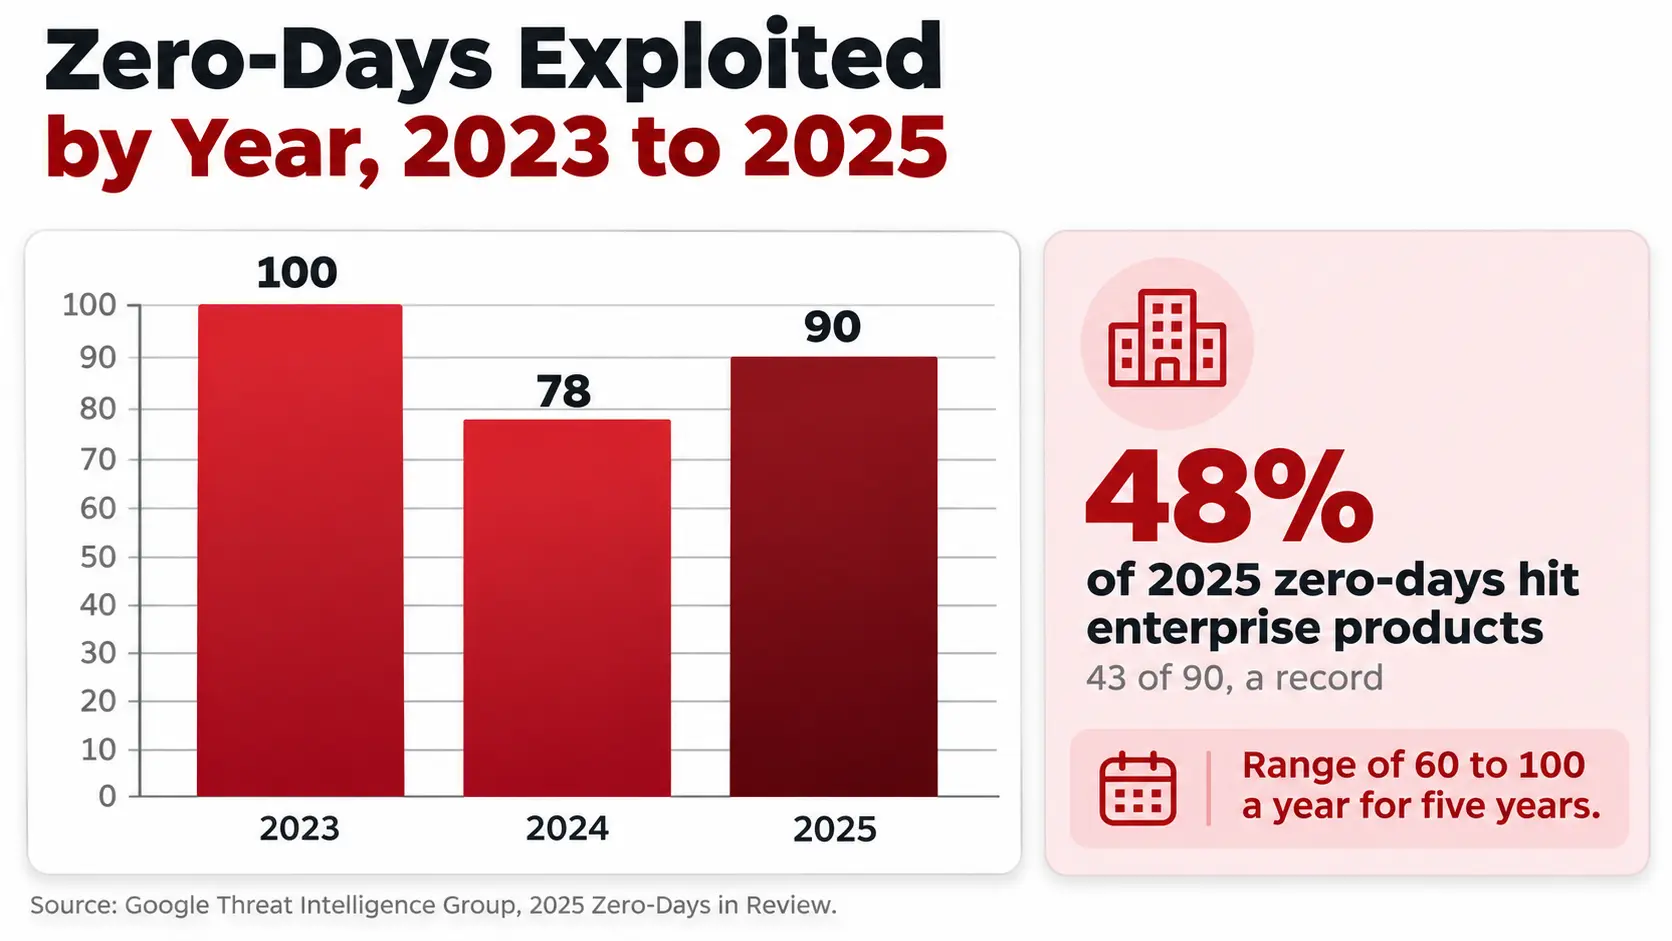
| Zero-days exploited in the wild | 90 | 2025 | 78 in 2024; 100 in 2023; range 60 to 100 for five years | Google Threat Intelligence Group |
| Zero-days in enterprise products | 43 (48%) | 2025 | 36 (46%) in 2024; record high | Google Threat Intelligence Group |
| Zero-days in operating systems | 39 (44%) | 2025 | 31 (40%) in 2024; 33 (33%) in 2023 | Google Threat Intelligence Group |
| Zero-days in browsers | Under 10% | 2025 | Lower than 2021 and 2022 | Google Threat Intelligence Group |
| Zero-days exploited per month | 11 | Jan to Aug 2026 | 8 per month in 2025; August 2026 was 22 | Google Threat Intelligence Group |
| All vulnerabilities exploited | 141 | Jan to Aug 2026 | 127 in all of 2025; 18 a month against 10.5 | Google Threat Intelligence Group |
| Share of 2026 disclosures exploited | 0.23% (about 1 in 431) | Jan to Aug 2026 | Zero-days are 62% of the exploited set | Google Threat Intelligence Group |
| KEVs exploited on or before CVE publication day | 28.96% (884 KEVs) | 2025 | 23.6% in 2024; 23.43% in the first half of 2026; vendor-only | VulnCheck |
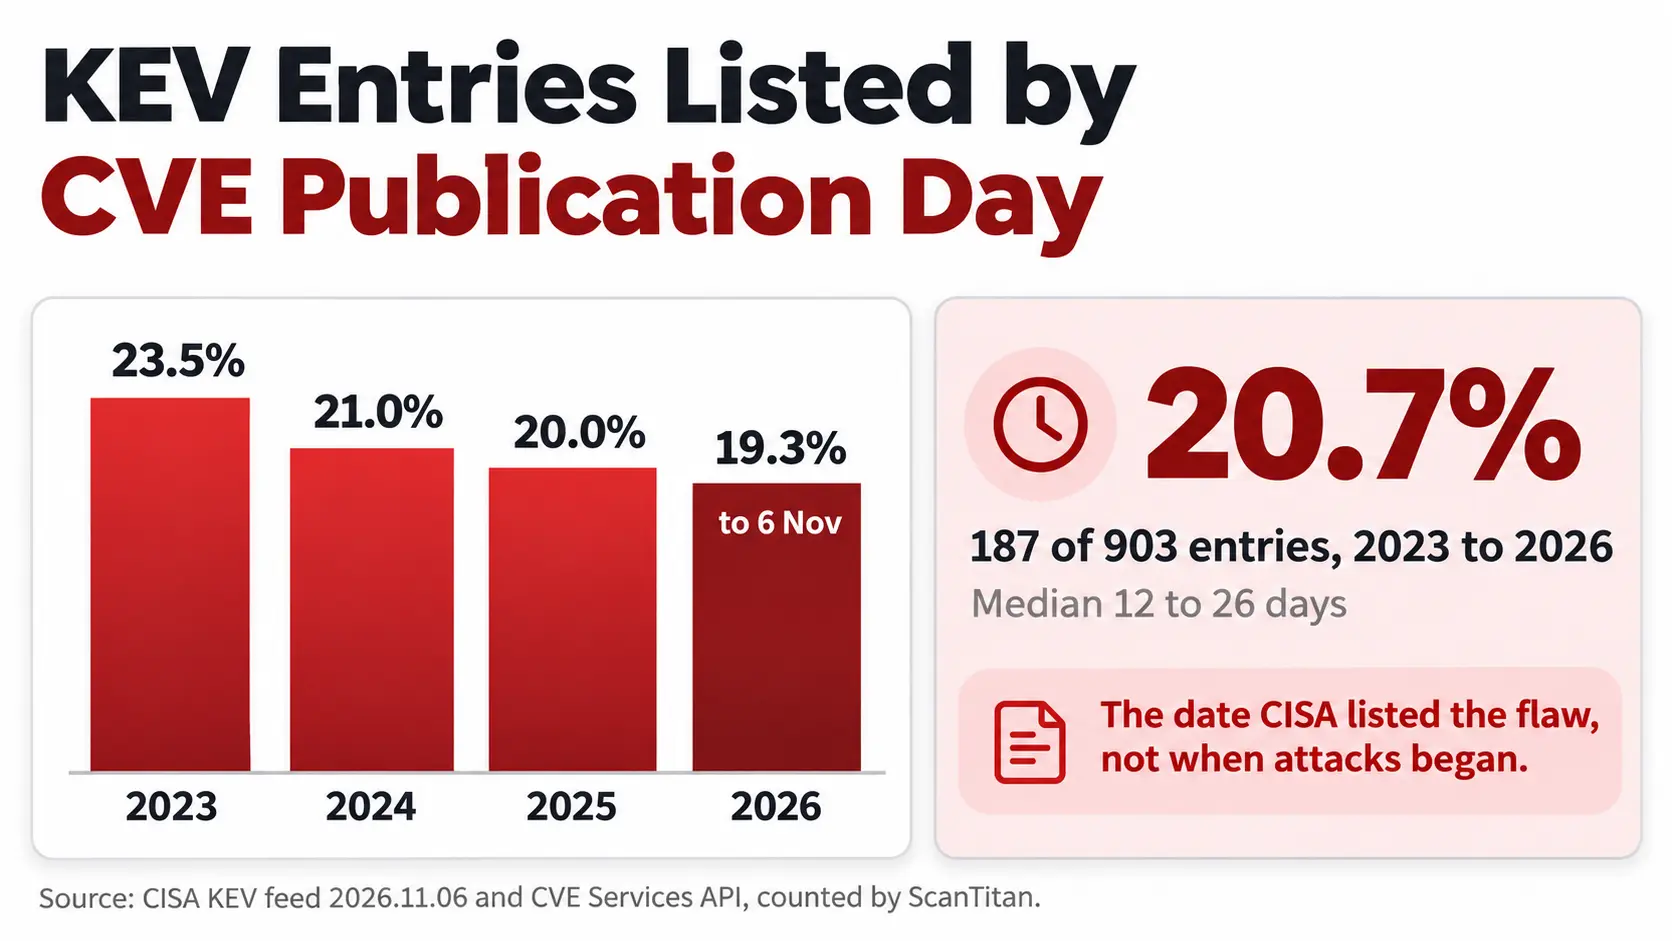
| CISA entries listed on or before CVE publication day | 20.7% (187 of 903) | 2023 to 6 Nov 2026 | 23.5% in 2023; 19.3% in 2026 | CISA KEV feed, counted by ScanTitan |
| CISA entries listed within 30 days of CVE publication | 58.9% | 2026 to 6 Nov | 51.1% in 2024; 51.4% in 2025 | CISA KEV feed, counted by ScanTitan |
| Median days from CVE publication to VulnCheck KEV | 80 | First half of 2026 | 120 in 2025; vendor-only | VulnCheck |
| High-risk vulnerabilities exploited | 75 | Jan to Aug 2026 | 28 in all of 2025 | Google Threat Intelligence Group |
Methodology: What Counts as a Zero-Day?
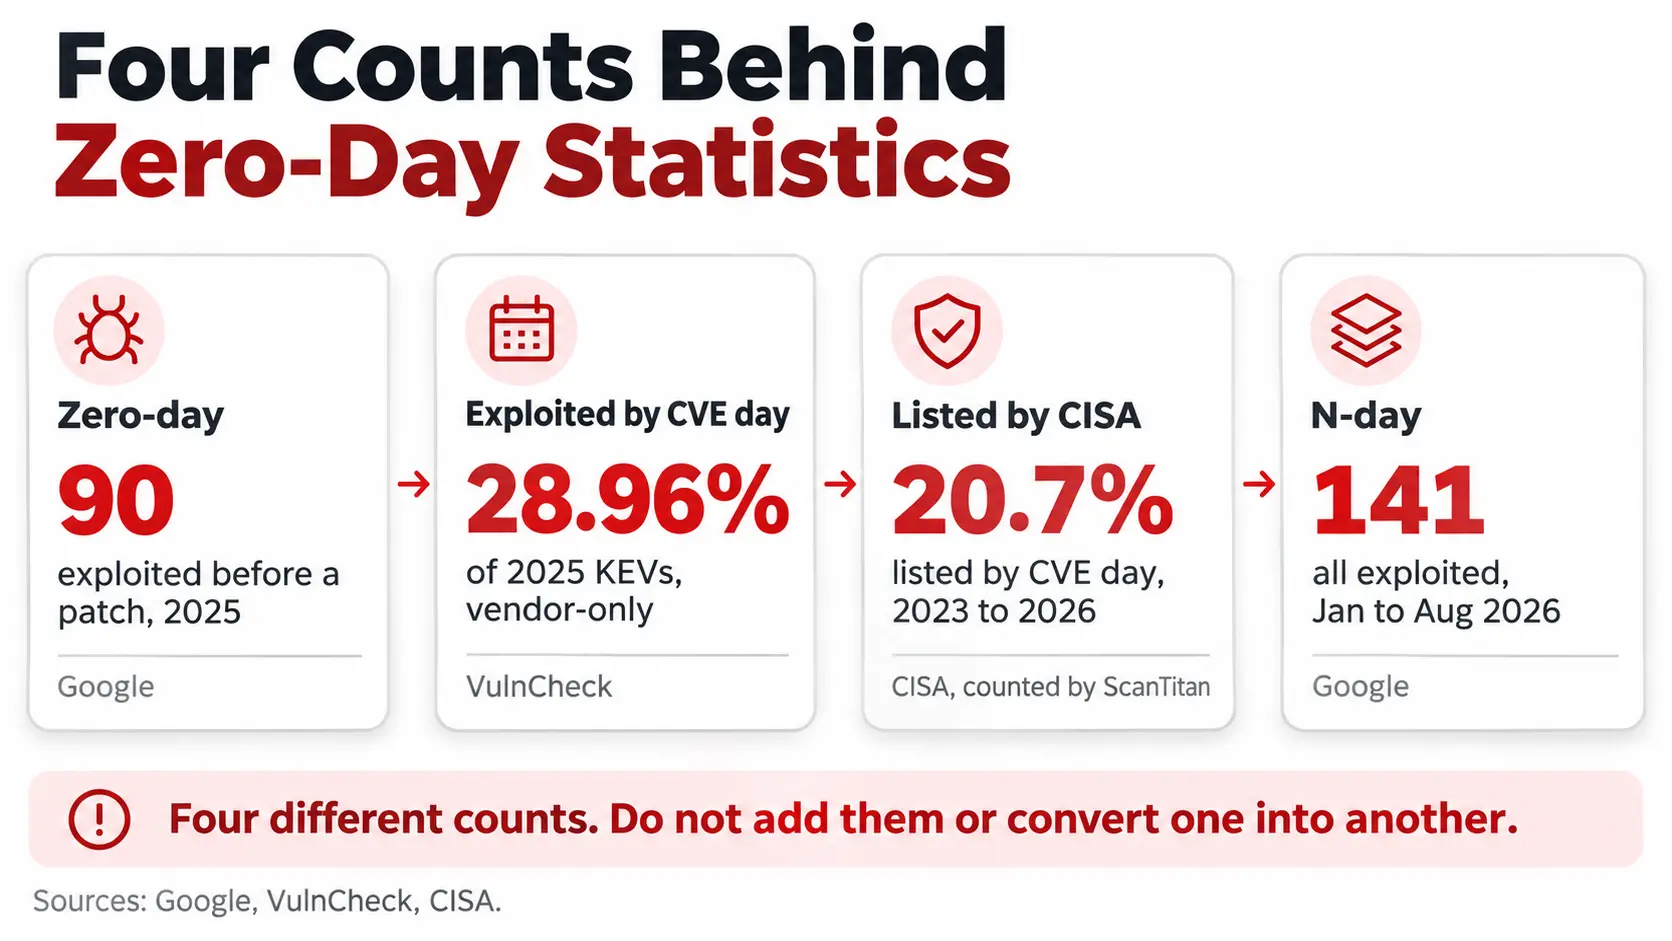
“Zero-day statistics” is used for four different counts. Each answers a different question, comes from a different kind of source, and can be wrong in a different way.
| Count | What it counts | Example figure | Source type | What it cannot tell you |
|---|---|---|---|---|
| Zero-day | A flaw maliciously exploited in the wild before a patch was publicly available | 90 in 2025 | Google’s threat intelligence tracking | Exploitation that was never detected or reported |
| Exploited by CVE day | A flaw with evidence of exploitation on or before the day its CVE was published | 28.96% of 2025 KEVs | Vendor catalog (VulnCheck) | Whether a patch existed; not every same-day case is a zero-day |
| Listed by CISA | A flaw CISA added to its exploited catalog, with the gap from CVE publication | 20.7% listed by day one, 2023 to 2026 | Government catalog | When exploitation began; it is the date CISA listed it |
| N-day | A flaw exploited after a patch or public disclosure | Most of 2026’s growth in exploitation | Threat intelligence reporting | Which exploited flaws were also zero-days earlier |
How Google counts. Google Threat Intelligence Group defines a zero-day as a vulnerability maliciously exploited in the wild before a patch was publicly available. Its counts use Google’s own research plus open-source reporting, only include detected and disclosed cases, and can change as past incidents are discovered. Its 2025 review has a cutoff of 31 December 2025. Its September 2026 analysis uses a different dataset of monthly counts, so its monthly figures (8 and 11 a month) are not a restatement of the 90 and should not be multiplied out to match it.
How ScanTitan counted. We downloaded the CISA Known Exploited Vulnerabilities feed, version 2026.11.06 with 1,769 entries, and looked up each CVE’s publication date in the CVE Services API. The gap is the number of days between CISA adding the flaw and the CVE record being published. This measures when CISA listed a flaw, not when exploitation started, so it is a proxy and a ceiling on how fast CISA reacts. CISA added 311 entries in 2021 and 555 in 2022, most of them old CVEs listed in bulk when the catalog launched, so we show the trend from 2023.
Source confidence. Google, CISA and the CVE Program publish their methods. VulnCheck’s figures come from its own catalog and are labeled vendor-only. VulnCheck notes that not every flaw exploited on or before its CVE day is a true zero-day.
How Many Zero-Days Are Exploited Each Year?
| Year | Zero-days exploited | Enterprise products | Operating systems | Mobile |
|---|---|---|---|---|
| 2023 | 100 | Not in the 2025 review | 33 (33%) | 17 |
| 2024 | 78 | 36 (46%) | 31 (40%) | 9 |
| 2025 | 90 | 43 (48%) | 39 (44%) | 15 |
Source: Google Threat Intelligence Group, 2025 Zero-Days in Review.
Three readings matter. First, the count is stable, not climbing: 2025 is 10 below the 2023 record and Google says volume has stayed within 60 to 100 for five years, “a trend toward stabilization.” Second, the mix is changing: enterprise products rose to 48% and operating systems to 44%, while browsers fell below 10%, which Google reads as browser hardening working, with the caveat that better attacker secrecy may hide some exploitation. Third, the figure is a floor. Google counts only detected cases, and says the 14 zero-days in edge devices likely understate the real number because most edge devices cannot run endpoint detection.
The 2026 Update: Exploitation Up, Zero-Days Flat
Google’s 30 September 2026 analysis covers vulnerabilities disclosed from January 2025 to August 2026.
| Measure | 2025 | Jan to Aug 2026 |
|---|---|---|
| Vulnerabilities exploited | 127 in total, 10.5 a month | 141 in total, 18 a month |
| Zero-days exploited per month | 8 | 11 (August: 22) |
| High-risk vulnerabilities exploited | 28 | 75 |
| Vulnerabilities disclosed per month | Not stated for the full year | 5,045 in January to 10,740 in August |
Source: Google Threat Intelligence Group.
Google’s reading is that the 2026 rise “is driven by the rapid, targeted weaponization of high-risk exploits” and that growth is concentrated in n-days. Zero-days still make up 62% of the exploited set in the period, about 87 of 141 by ScanTitan’s arithmetic, but they grew from 8 to 11 a month while all exploitation grew from 10.5 to 18. Google suggests attackers may use AI tools to compare product versions, patches and proof-of-concept code to weaponize n-days quickly, and says that is a possibility, not a finding. It also notes the exploited share of disclosures is tiny: 0.23% of 2026 disclosures, about 1 in 431. Since May 2026, exploitation growth (+127%) has tracked disclosure growth (+128%), so exploitation is scaling with the number of vulnerabilities rather than ahead of it.
VulnCheck’s first-half 2026 report points the same way. Early exploitation held steady at roughly 200 CVEs reaching its catalog within 31 days of publication in each of 2024 (196), 2025 (194) and the first half of 2026, while CVE volume grew sharply, so the share fell. Its KEV to CVE ratio dropped from 2.7% in the second half of 2023 to 1.4% in the first half of 2026. Source: VulnCheck, vendor-only.
What Zero-Days Hit: Enterprise, Operating Systems and Browsers
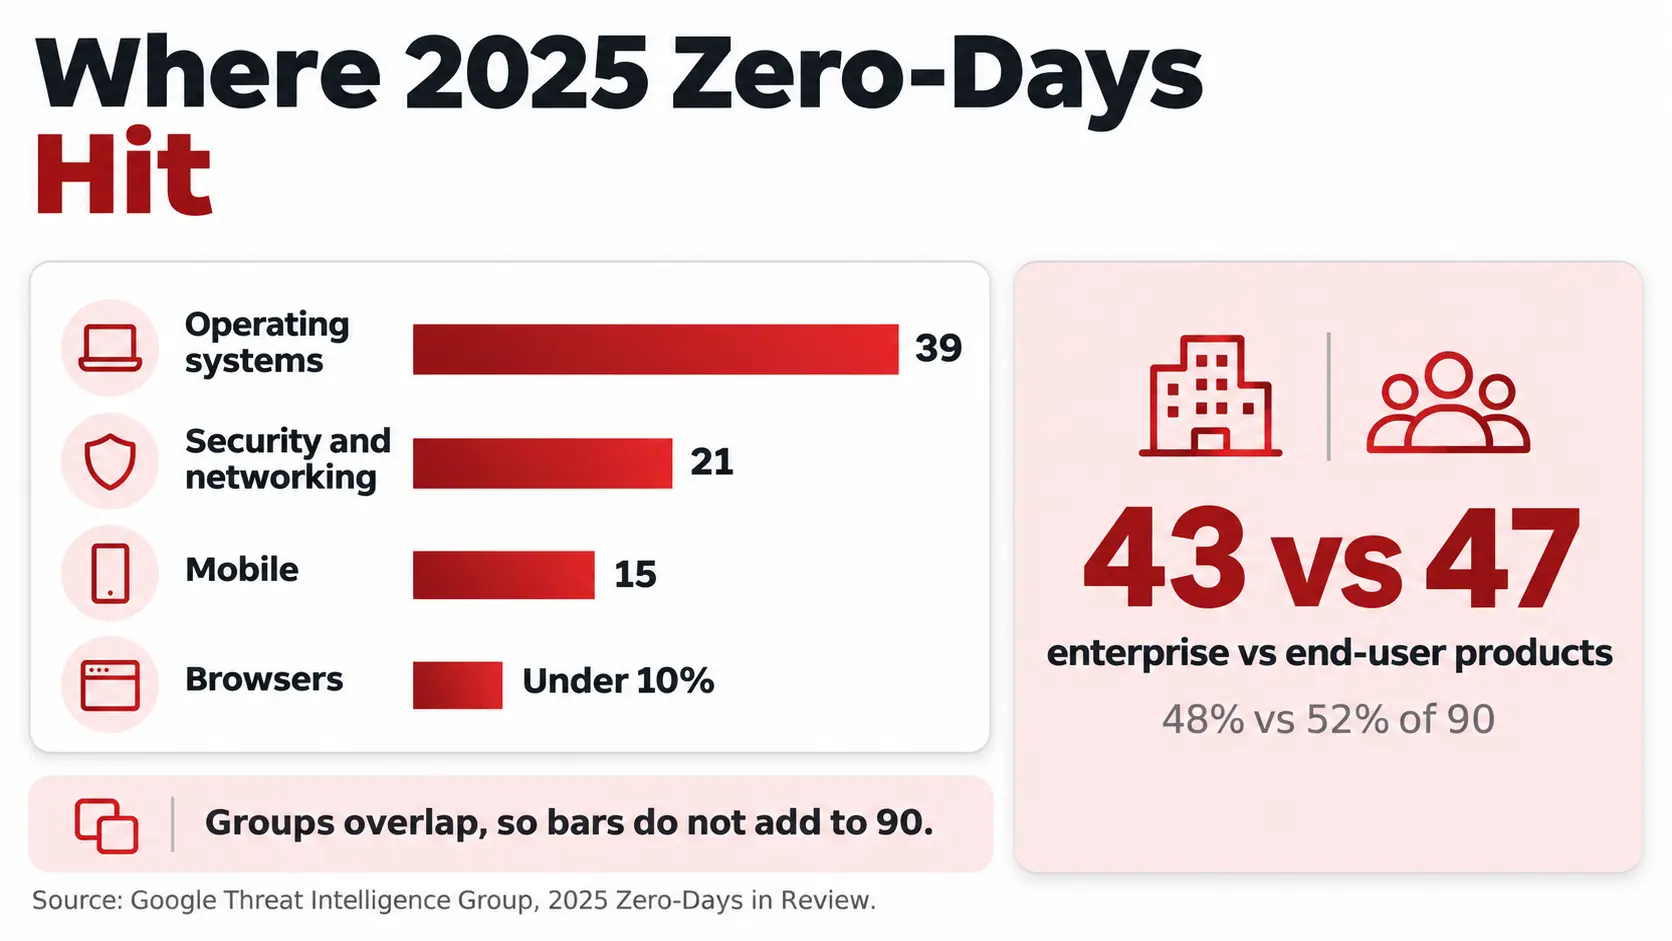
Google splits the 90 zero-days of 2025 into 43 in enterprise products (48%) and 47 in end-user products (52%).
| Target group | 2025 count | Share of 90 | Detail |
|---|---|---|---|
| Operating systems | 39 | 44% | Desktop OS zero-days have ranged from 16 to 23 a year |
| Security and networking products | 21 | 23% | About half of enterprise zero-days; 14 hit edge devices |
| Mobile | 15 | 17% | Up from 9 in 2024 |
| Browsers | Under 10% | Under 10% | Down from the browser-heavy years of 2021 and 2022 |
Source: Google Threat Intelligence Group. Operating systems and mobile overlap in Google’s grouping (mobile operating systems count as operating systems), so the rows do not add to 90.
Google reports that memory safety flaws, mainly use-after-free and out-of-bounds write, were roughly 35% of the 2025 zero-days. Enterprise appliances more often fell to injection, deserialization, authentication bypass and design flaws, which allow remote code execution without memory corruption. Twenty vendors had just one exploited zero-day each, so exploitation is spread widely, though big tech vendors and security vendors saw the most. In the 2026 data, 14% of exploited vulnerabilities affected edge and security appliances and 11% affected enterprise directory and collaboration systems, and over 65% of the exploited edge flaws were rated high or critical risk by Google.
Who Uses Zero-Days
Google attributed exploitation of a share of the 2025 zero-days to named groups. Many are not attributed at all.
| Actor type | 2025 | Comparison |
|---|---|---|
| PRC-nexus cyber espionage groups | At least 10 | 5 in 2024; 12 in 2023 |
| Financially motivated groups | 9 (2 tied to ransomware) | 5 in 2024; 10 in 2023 |
| North Korea-linked groups | 0 | 5 in 2024 |
| Commercial surveillance vendors | More than traditional state espionage | First time since Google began tracking |
Source: Google Threat Intelligence Group.
Two points stand out. For the first time, Google attributed more zero-day exploitation to commercial surveillance vendors than to traditional state-sponsored espionage groups, which means paid access to zero-days now reaches a wider set of customers. And financial groups nearly matched their 2023 high: Google tracked zero-day exploitation by a threat actor claiming affiliation with the CL0P extortion brand against Oracle E-Business Suite as early as 9 August 2025, weeks before a patch.
How Fast Exploited Flaws Reach CISA’s KEV Catalog
ScanTitan measured the days between each CVE’s publication and the date CISA added it to the Known Exploited Vulnerabilities catalog.
| Year added | Entries | Listed on or before CVE publication day | Within 7 days | Within 30 days | Median days | Older than one year |
|---|---|---|---|---|---|---|
| 2023 | 187 | 44 (23.5%) | 45.5% | 55.1% | 12 | 24.6% |
| 2024 | 186 | 39 (21.0%) | 41.9% | 51.1% | 21.5 | 24.2% |
| 2025 | 245 | 49 (20.0%) | 39.6% | 51.4% | 26 | 22.9% |
| 2026 to 6 Nov | 285 | 55 (19.3%) | 42.8% | 58.9% | 14 | 17.9% |
Source: CISA KEV feed version 2026.11.06 and the CVE Services API, counted by ScanTitan.
Across 2023 to 2026, 187 of 903 entries (20.7%) were listed on or before the day the CVE was published. That sits below VulnCheck’s 28.96% for 2025, which is expected: VulnCheck tracks exploitation evidence from over 100 sources and says it often finds evidence earlier than CISA, and CISA lists a flaw only after it has reliable evidence. The two methods still agree on the shape: roughly one in five to three in ten exploited flaws are exploited by the time defenders hear of them, and about half reach the catalog within a month. The other half are older flaws. Between a fifth and a quarter of each year’s additions are more than a year old, so exploitation of known, patched flaws continues long after disclosure.
What CISA’s BOD 26-04 Changes
On 10 June 2026 CISA issued Binding Operational Directive 26-04, which revokes BOD 22-01 (which created the catalog) and BOD 19-02. Federal agencies now set remediation timelines from four inputs: whether the asset is publicly exposed, whether the CVE is in the KEV catalog, whether an adversary can automate exploitation, and whether exploitation gives partial or total control. The top tier requires remediation within three days and a forensic triage to check whether the system was already compromised. The criteria for adding a flaw to the catalog are unchanged. Sources: BOD 26-04 and its implementation guidance.
The catalog feed shows the effect. ScanTitan compared each entry’s due date with the date it was added.
| Period added | Entries | Due in 2 or 3 days | Due in 5 days | Due in 14 days | Due in 21 days | Marked for forensic triage |
|---|---|---|---|---|---|---|
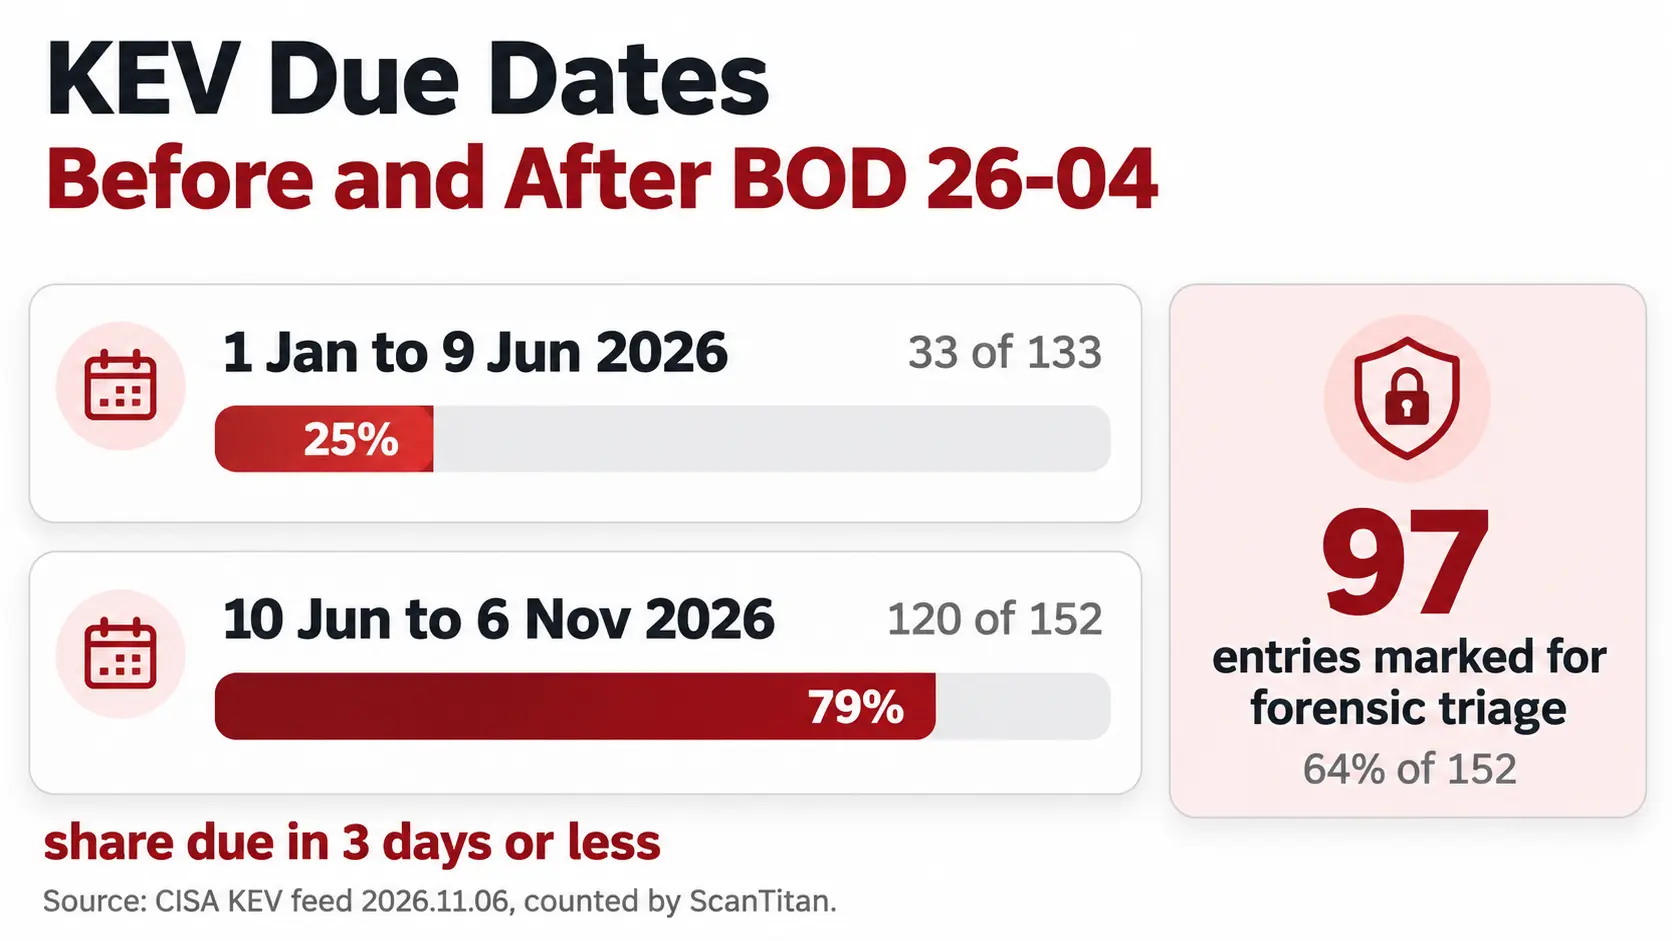
| 1 Jan to 9 Jun 2026 | 133 | 33 | 1 | 55 | 44 | 0 |
| 10 Jun to 6 Nov 2026 | 152 | 120 (79%) | 0 | 32 | 0 | 97 (64%) |
Source: CISA KEV feed, counted by ScanTitan from each entry’s dateAdded and dueDate fields.
Before the directive, about a quarter of 2026 additions had a due date of three days or less. Since it, about four in five do, and 97 entries carry a forensic triage flag. Together with the data above, the shortest due dates now apply to most newly listed flaws. These are federal deadlines; private organizations are not bound, but the catalog is a free signal of what attackers are using.
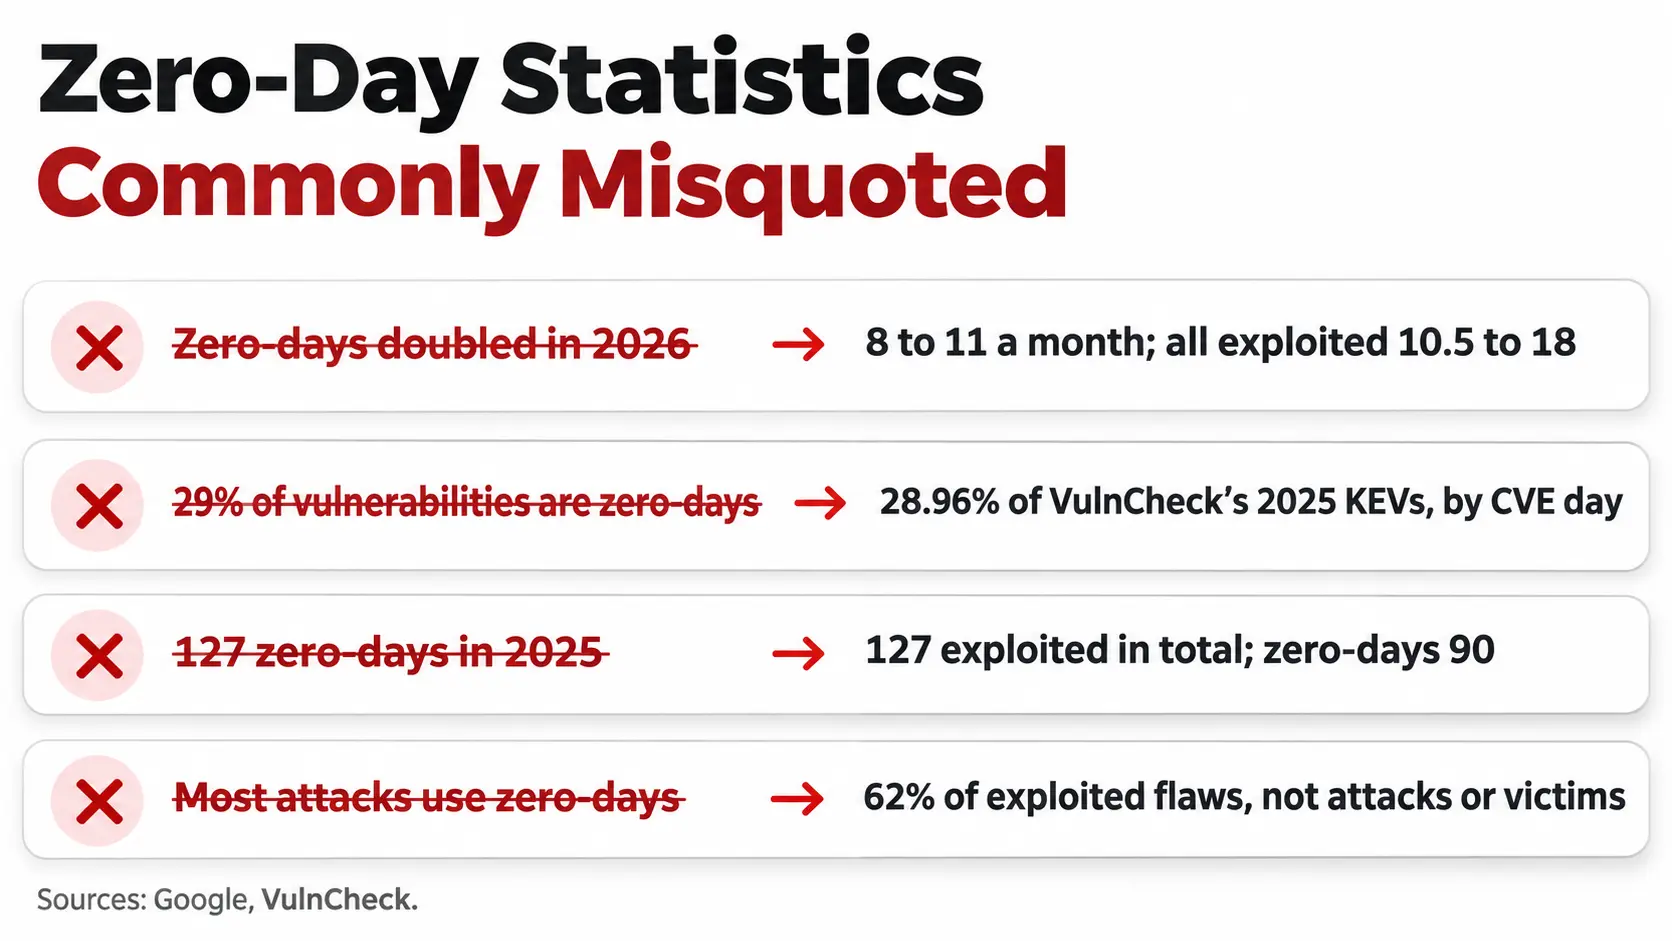
Zero-Day Statistics Commonly Misquoted
| Common claim | Correct context |
|---|---|
| “Zero-days doubled in 2026.” | Zero-days rose from 8 to 11 a month. Total exploited vulnerabilities rose from 10.5 to 18 a month, mostly n-days (Google). |
| “29% of vulnerabilities are zero-days.” | 28.96% is the share of VulnCheck’s 2025 exploited flaws (KEVs) exploited on or before the CVE publication day. It is not a share of all vulnerabilities, and not every case is a true zero-day. |
| “There were 127 zero-days in 2025.” | 127 is all vulnerabilities Google saw exploited in 2025. Its zero-day count is 90. |
| “Most attacks use zero-days.” | Zero-days are 62% of the exploited vulnerabilities in Google’s 2026 set, but that counts flaws, not attacks or victims. Only 0.23% of 2026 disclosures were exploited. |
| “CISA lists flaws the day they are exploited.” | The listing date is when CISA added it. Almost half of 2023 to 2026 additions came more than 30 days after CVE publication. |
| “90 zero-days means 90 breaches.” | It counts vulnerabilities exploited, not organizations affected. |
What the Numbers Mean for a Lean Team
You cannot patch a flaw that has no patch, so zero-days are a response problem as much as a prevention problem. Three facts shape the work: exploitation clusters in internet-facing enterprise and edge products, about half of CISA-listed flaws are listed within a month of disclosure, and most of the growth in 2026 is n-days that a patch already fixes.
- Patch exposed edge and remote-access products first. Security appliances, VPNs and admin interfaces are the most targeted group. Treat a KEV listing for software you run as an emergency, not a ticket.
- Subscribe to the KEV feed. It is free and lists what is being exploited. The CVE priority checker shows whether a flaw is on it.
- Cut exposure before a patch exists. Remove management interfaces from the public internet, restrict them by IP, and disable unused features. Mitigation is often the only option on day zero.
- Plan a forensic check for top-tier flaws. BOD 26-04 pairs three-day remediation with triage for a reason: assume the flaw was used before the patch landed.
- Know your external assets. You cannot patch what you do not know is exposed. A website vulnerability scanner finds known flaws on the assets you list.
- Read the neighbors. For the wider picture see ScanTitan’s vulnerability statistics, web application attack statistics and XSS statistics.
How We Compiled and Verified These Statistics
- Used: Google Threat Intelligence Group’s 2025 Zero-Days in Review (6 March 2026) and its Vulnerability Discovery and Exploitation Trends in the AI Era analysis (30 September 2026), VulnCheck’s State of Exploitation 2026 and 1H 2026 reports, CISA’s BOD 26-04 and its implementation guidance, the CISA Known Exploited Vulnerabilities feed (version 2026.11.06) and CVE publication dates from the CVE Services API. Vendor figures are labeled vendor-only.
- Method: each KEV entry’s dateAdded was compared with its CVE datePublished, and each entry’s dueDate with its dateAdded. Every other figure was read on its own page.
- Excluded: roundup and aggregator pages, competitor figures, unsourced zero-day market prices, and any monthly zero-day figure multiplied out to match another dataset.
- Refresh: reviewed every 90 days. KEV counts change daily, and Google revises its zero-day totals as past incidents are found.
How to cite this research. ScanTitan, “Zero-Day Statistics 2026: Exploits, Targets & Patch Speed,” 12 November 2026. For single figures, cite the primary source beside each number.
Primary Sources
- Google Threat Intelligence Group, Look What You Made Us Patch: 2025 Zero-Days in Review
- Google Threat Intelligence Group, Vulnerability Discovery and Exploitation Trends in the AI Era
- VulnCheck State of Exploitation 2026 and 1H 2026, vendor-only
- CISA BOD 26-04 and implementation guidance
- CISA Known Exploited Vulnerabilities catalog data feed
- CVE Program
Frequently Asked Questions
What is a zero-day?
A zero-day is a vulnerability exploited in the wild before a patch is publicly available. Once a patch exists, continued exploitation of the same flaw is an n-day.
How many zero-days were exploited in 2025?
Google Threat Intelligence Group counted 90 in 2025, up from 78 in 2024 and below the 2023 record of 100. Counts cover detected and disclosed cases only.
Are zero-days increasing in 2026?
Only slightly. Google’s data shows 11 zero-days a month from January to August 2026 against 8 a month in 2025. Total exploited vulnerabilities rose from 10.5 to 18 a month, and Google ties that growth to n-days.
How common are zero-day attacks?
There is no count of attacks. Google counts flaws: 90 in 2025. Only 0.23% of vulnerabilities disclosed in 2026, about 1 in 431, were seen exploited at all.
What share of exploited vulnerabilities are zero-days?
Google reports zero-days were 62% of the vulnerabilities it saw exploited from January to August 2026. VulnCheck found 28.96% of its 2025 exploited flaws were exploited on or before CVE publication day. The two measure different sets.
What do zero-days target most?
Operating systems (44% of 2025 zero-days) and enterprise products (48%, including security and networking appliances). Browsers were under 10%.
Who uses zero-days?
Google attributed at least 10 of the 2025 zero-days to PRC-nexus espionage groups and 9 to financially motivated groups. For the first time, commercial surveillance vendors outnumbered traditional state espionage in attributed cases.
How fast does CISA add exploited flaws to its catalog?
In ScanTitan’s count, 20.7% of entries added from 2023 to 6 November 2026 were listed on or before the CVE publication day, 51% to 59% within 30 days depending on the year, and the median gap was 12 to 26 days.
What does BOD 26-04 change?
It replaced BOD 22-01 on 10 June 2026 and sets federal remediation deadlines from exposure, KEV status, automation and impact. Since then 79% of newly listed flaws carry a three-day due date, 120 of 152 in the catalog feed.
What is the difference between a zero-day and an n-day?
A zero-day is exploited before a patch exists. An n-day is exploited after a patch or public disclosure. Google says most of 2026’s rise in exploitation is n-days.
How do you protect against zero-days?
Reduce exposure: remove admin interfaces from the internet, patch edge and remote-access products as soon as fixes ship, monitor CISA’s catalog, and prepare a forensic check for top-priority flaws.
Do zero-days cause most breaches?
There is no reliable current figure. Google counts exploited flaws, not breaches, and CISA’s catalog does not record how many organizations were affected.