


Vulnerability statistics are easy to inflate because raw disclosure volume is the biggest number and often the least useful one on its own. The CVE Program published 48,244 vulnerabilities in 2025, while confirmed exploitation remains concentrated in a much smaller set. In 2026, the more important story is the widening gap between attacker speed and defender remediation. This report separates disclosure, exploitation, severity, exposure, and remediation data so each number keeps its original meaning and can be cited without turning vulnerability volume into threat volume.
Short answer: The CVE Program published 48,244 CVE records in 2025, up 20.4% from 40,077 in 2024. In the first half of 2026 alone, it published 35,872 records, 51.3% more than the first half of 2025. Verizon’s 2026 DBIR found vulnerability exploitation was the leading initial access vector in 31% of breaches, while VulnCheck found 23.43% of exploited vulnerabilities in its 1H 2026 dataset showed exploitation on or before CVE publication. The operational problem is no longer simply how many vulnerabilities exist, but which ones are reachable, exploited, and still unremediated.
Last updated: September 2026. This page is a source audit and statistical analysis. Dynamic database figures are date-stamped, calculated figures are labeled, and datasets with different definitions are not merged.
Key Vulnerability Statistics for 2026
The strongest vulnerability statistics are the ones that keep the denominator, timeframe, and source attached, For the wider picture across breaches, ransomware, phishing, DDoS, cybercrime costs and attack trends, see our broader cybersecurity statistics research, The table below separates global CVE disclosure volume from known exploitation, breach entry, remediation, application findings, and AI-assisted discovery. These figures should not be treated as interchangeable. A CVE count measures published records. A KEV count measures vulnerabilities with evidence of exploitation. A breach statistic measures successful incidents. A remediation statistic measures what organizations actually fixed.
| Metric | Figure | What it measures | Coverage | Source |
|---|---|---|---|---|
| New CVE records published | 48,244 | Published CVE records | 2025 | CVE Program |
| CVE growth year over year | 20.4% | Increase from 40,077 in 2024 | 2025 | CVE Program, calculated |
| Published CVEs in first half of 2026 | 35,872 | Q1 plus Q2 published CVE records | 1H 2026 | CVE Program |
| First-half CVE growth | 51.3% | 1H 2026 versus 1H 2025 | 1H 2026 | CVE Program, calculated |
| Newly exploited CVEs identified by VulnCheck | 495 | CVEs with first-time exploitation evidence in VulnCheck KEV | 1H 2026 | VulnCheck |
| KEV-to-CVE ratio | 1.4% | VulnCheck’s exploited-CVE ratio for the period | 1H 2026 | VulnCheck |
| Exploited on or before publication day | 23.43% | Share of VulnCheck KEVs with exploitation by CVE publication date | 1H 2026 | VulnCheck |
| Median CVE publication to KEV | 80 days | Median publication-to-exploitation-evidence interval in VulnCheck data | 1H 2026 | VulnCheck |
| Breaches starting with vulnerability exploitation | 31% | Initial access vector in confirmed breaches | 2026 DBIR dataset | Verizon |
| Known exploited vulnerabilities fully remediated | 26% | Share of detected KEV vulnerabilities fully resolved by organizations | 2025 observations | Verizon 2026 DBIR |
| Median time to full resolution | 43 days | Median remediation time for critical vulnerabilities in the DBIR analysis | 2025 observations | Verizon 2026 DBIR |
| Mean time to exploit | -7 days | Mandiant estimate relative to patch availability | 2025 incident data, reported in 2026 | Mandiant M-Trends 2026 |
| Internet-facing findings rated high or critical | >20% | Share across Edgescan’s full-stack assessment dataset | 2025 assessments | Edgescan 2026 |
| Application/API high or critical MTTR | 54.81 days | Average remediation time in Edgescan’s application/API dataset | 2025 assessments | Edgescan 2026 |
| AI-assisted discoveries confirmed exploited | 14 of 1,061 | 1.3% of AI-attributed discoveries in VulnCheck research | 1H 2026 | VulnCheck |
What Vulnerability Statistics Actually Measure
Most bad vulnerability reporting starts by combining unlike datasets. Disclosure volume, severity, exploitation, exposure, and breaches answer different questions. CVE tells you that a vulnerability record exists. CVSS describes technical severity. CISA KEV tells you there is evidence of exploitation in the wild. EPSS estimates the probability of exploitation in the next 30 days. A scanner tells you whether the vulnerable software appears in your environment. A breach report tells you whether exploitation became a successful entry point. Keeping those layers separate is the difference between useful vulnerability statistics and a large pile of numbers.
- Disclosure is not exploitation. A published CVE creates a public record. It does not prove that attackers are using the flaw.
- Severity is not probability. A critical CVSS Base score describes technical severity, not the chance that exploitation will happen.
- Exploitation is not exposure. A KEV-listed flaw only matters to your organization if you run the affected product or component. For counts of exposed services and the share of KEV entries in network-edge products, see ScanTitan’s open ports statistics.
- Exposure is not breach. An internet-facing vulnerable service is a risk condition, not proof that an attacker succeeded.
- Remediation is a separate measurement. Patch speed and closure rates show whether defenders remove exposure before attackers can use it.
How Many Vulnerabilities Are There?
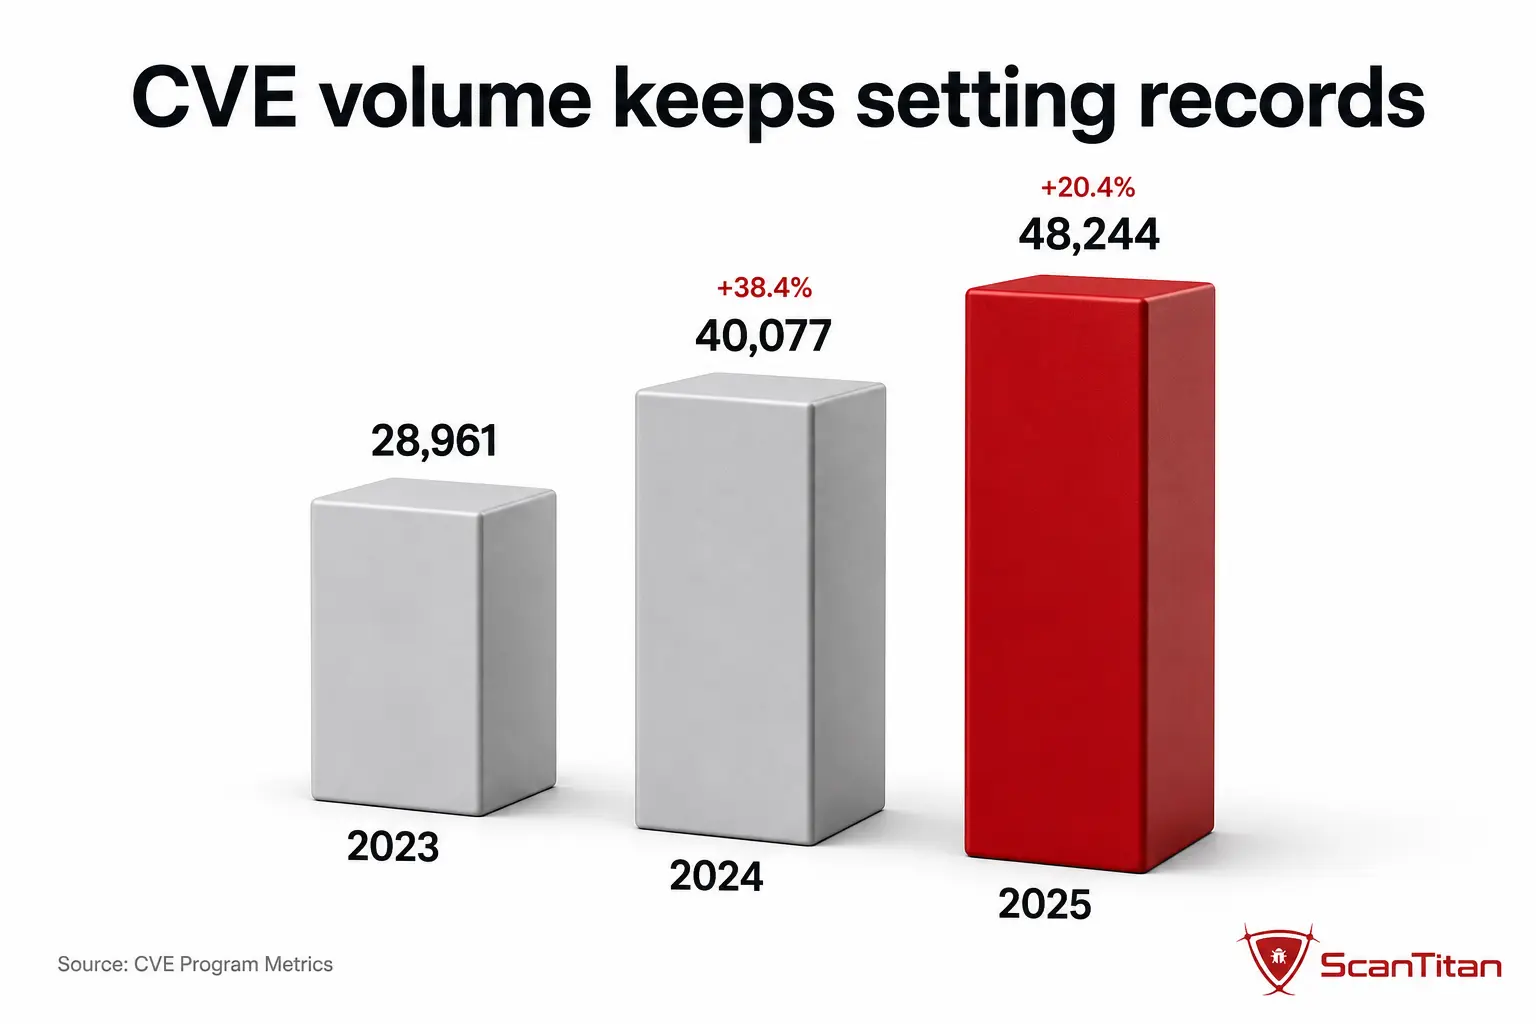
The public CVE Program published 48,244 CVE records in 2025, the highest annual total in its published metrics table. That was 20.4% above 2024’s 40,077 records and 66.6% above the 28,961 records published in 2023. The longer trend is even clearer: CVE publication rose from 18,375 in 2020 to 48,244 in 2025, equivalent to compound annual growth of about 21.3%. The number reflects disclosure activity across the global CVE Program, not the number of vulnerabilities that affect any one organization.
| Year | Published CVE records | Year-over-year change |
|---|---|---|
| 2020 | 18,375 | Baseline for this table |
| 2021 | 20,161 | +9.7% |
| 2022 | 25,059 | +24.3% |
| 2023 | 28,961 | +15.6% |
| 2024 | 40,077 | +38.4% |
| 2025 | 48,244 | +20.4% |
| 2026 through Q2 | 35,872 | Partial year, do not compare as a full-year total |
The first half of 2026 deserves separate treatment because the year is incomplete. CVE.org recorded 15,163 published records in Q1 and 20,709 in Q2, for 35,872 through June. The first half of 2025 produced 23,710 records, so the comparable first-half increase is about 51.3%. By the end of Q2 2026, the program had already published 74.4% as many records as it published during all of 2025. That is a useful growth signal, but it is not a defensible basis for pretending we already know the 2026 full-year total.
Methodology note: CVE.org says its quarterly metrics are point-in-time snapshots. Earlier quarters can be recalculated during the year to reflect status changes such as rejected records, and the program performs a final reconciliation at year-end. Historical figures from previous years are then left fixed. That matters when comparing a live midyear count with an older article that captured the database at a different time.
Why Vulnerability Databases Report Different CVE Totals
A vulnerability statistics report can show 48,174, 48,185, or 48,244 for 2025 and still appear to be referring to the same year. The difference often comes from when the data was pulled and which database was queried. CVE.org currently reports 48,244 published CVE records for 2025 after its year-end reconciliation. Edgescan’s 2026 report cites 48,185, while another secondary analysis may show another nearby number. The correct response is not to select the largest figure. It is to name the database, retrieval method, and timestamp.
The CVE Program is the identifier and record system. NVD imports CVE records and adds enrichment such as CVSS, CWE, CPE applicability, KEV-related data, and other metadata. Vulnerability intelligence vendors may maintain their own normalization, product mapping, rejection handling, advisory deduplication, or snapshot process. A database that counts advisories, patched branches, unique CVE IDs, or product mappings can therefore produce a different total without necessarily being wrong. The denominator has to travel with the number.
| Source difference | How it changes the number |
|---|---|
| Snapshot date | Records can be published, rejected, or updated after an article captures its count. |
| Year-end reconciliation | CVE.org recalculates quarters during the year and reconciles annual totals. |
| CVE IDs versus advisories | One advisory may map to one CVE, several CVEs, or no CVE. |
| Product mapping | Different databases may attach the same CVE to products or branches differently. |
| Enrichment status | NVD may list a CVE before full CVSS, CPE, or CWE enrichment is complete. |
Vulnerability Database Comparison: CVE, NVD, CISA KEV, EPSS, and SSVC
There is no single vulnerability database that answers every prioritization question. The public ecosystem is layered. CVE gives vulnerabilities stable identifiers and published records. NVD enriches those records with machine-readable security metadata. CISA KEV identifies a subset with evidence of exploitation. EPSS estimates the probability of exploitation in the next 30 days. SSVC provides a decision framework for prioritizing response based on factors such as exploitation and impact. The tools are complementary, and confusion starts when one is used as a substitute for another.
| Resource | What it provides | Best use | Important limitation |
|---|---|---|---|
| CVE | Canonical public vulnerability identifiers and records | Reference, disclosure, cross-vendor tracking | A CVE record is not a risk or exploitation score |
| NVD | CVE enrichment including CVSS, CWE, CPE, affected data, and other metadata | Machine-readable analysis and product matching | Not every record receives immediate NIST enrichment under the 2026 model |
| CISA KEV | Vulnerabilities with evidence of exploitation in the wild | Urgent remediation prioritization | It is a confirmed-exploitation subset, not a list of every vulnerability likely to be exploited |
| EPSS | Daily probability that a published CVE will be exploited in the next 30 days | Ranking vulnerabilities not already known to be exploited | It is a probability forecast, not a severity or environment-specific risk score |
| SSVC | Decision-tree based vulnerability response prioritization | Turning vulnerability attributes into action decisions | Requires organizational and mission context rather than a single universal score |
In June 2026, NVD expanded its feeds and API to include CISA-sourced SSVC information and CVE affected-product data. That change matters for defenders building a vulnerability list from machine-readable feeds because prioritization context can increasingly travel alongside traditional CVSS metadata. It does not remove the need to understand what each field means. A high CVSS score, a high EPSS score, a KEV listing, and an SSVC decision are related signals, not interchangeable labels.
Which Vulnerabilities Are Actually Exploited?
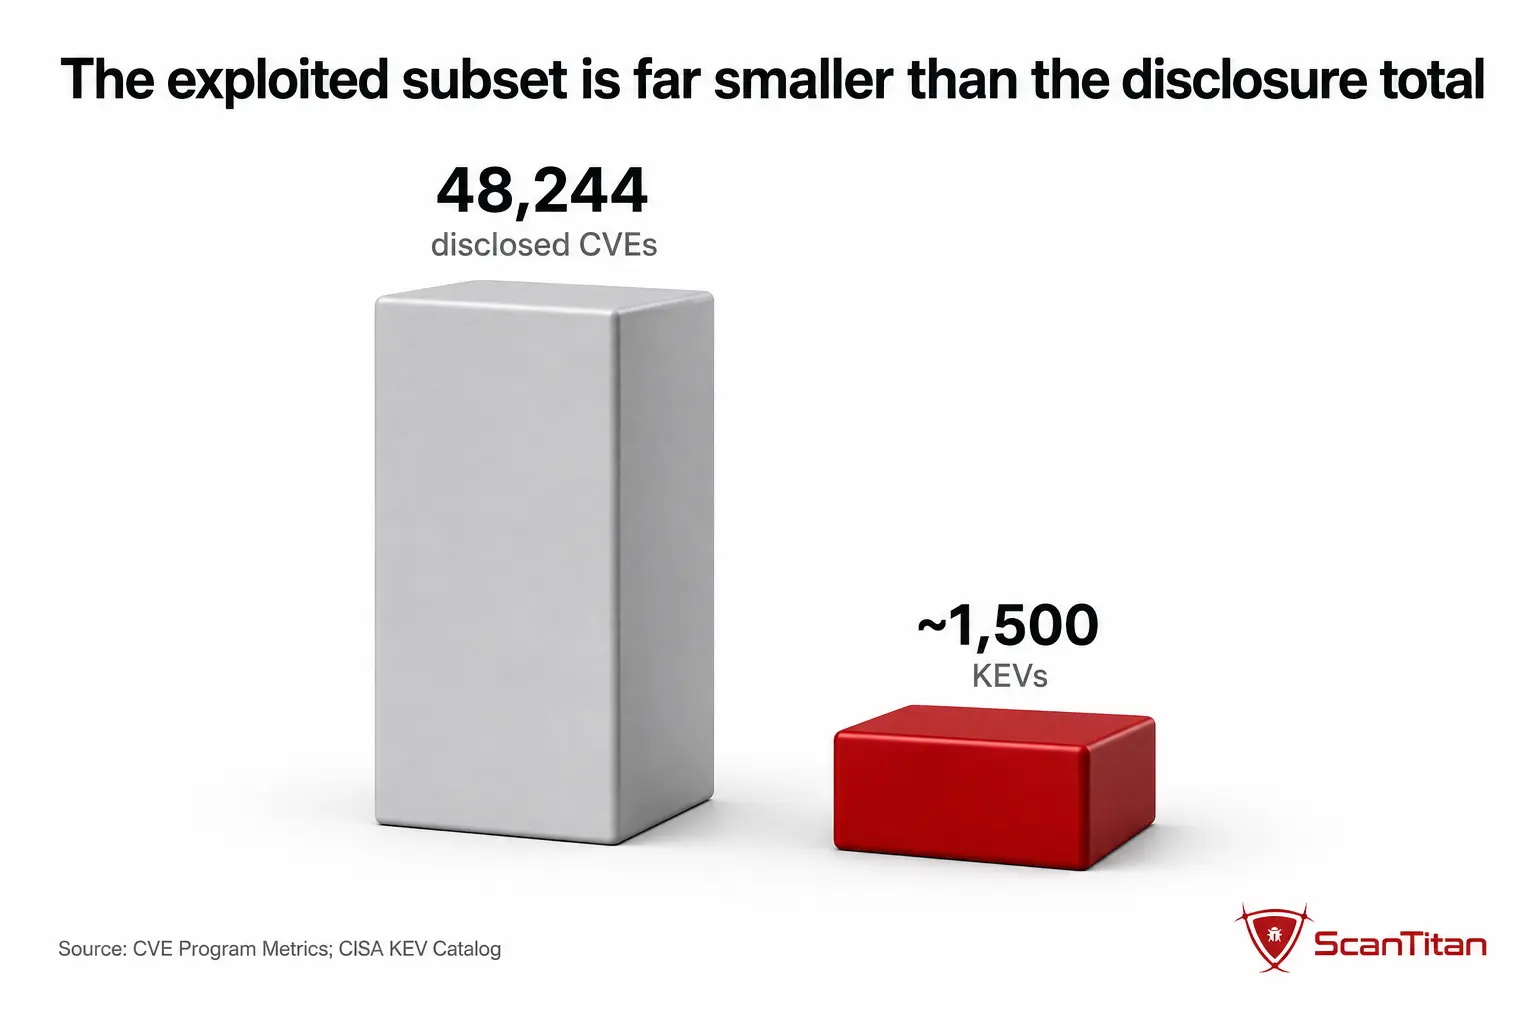
VulnCheck identified 495 CVEs with first-time exploitation evidence in the first half of 2026. It calculated a KEV-to-CVE ratio of 1.4%, down from 1.9% in the first half of 2025. That is an important counterweight to the rapidly growing CVE total: disclosure volume is rising much faster than the number of vulnerabilities that reach confirmed exploitation in VulnCheck’s dataset. The practical implication is not that the other 98% are safe. It is that exploitation evidence provides a far stronger prioritization signal than disclosure volume alone.
CISA’s Known Exploited Vulnerabilities catalog remains the most important public list for confirmed exploitation in the United States vulnerability-management ecosystem. Its value is binary and operational: a listed vulnerability has evidence of exploitation in the wild. EPSS answers a different question by forecasting exploitation probability for CVEs that may not yet have confirmed exploitation. FIRST explicitly describes EPSS as a forward-looking probability estimate and KEV as a historical record of confirmed exploitation. If a vulnerability is already in KEV, confirmed exploitation should take precedence over a low forecast probability.
How Fast Are Vulnerabilities Exploited?
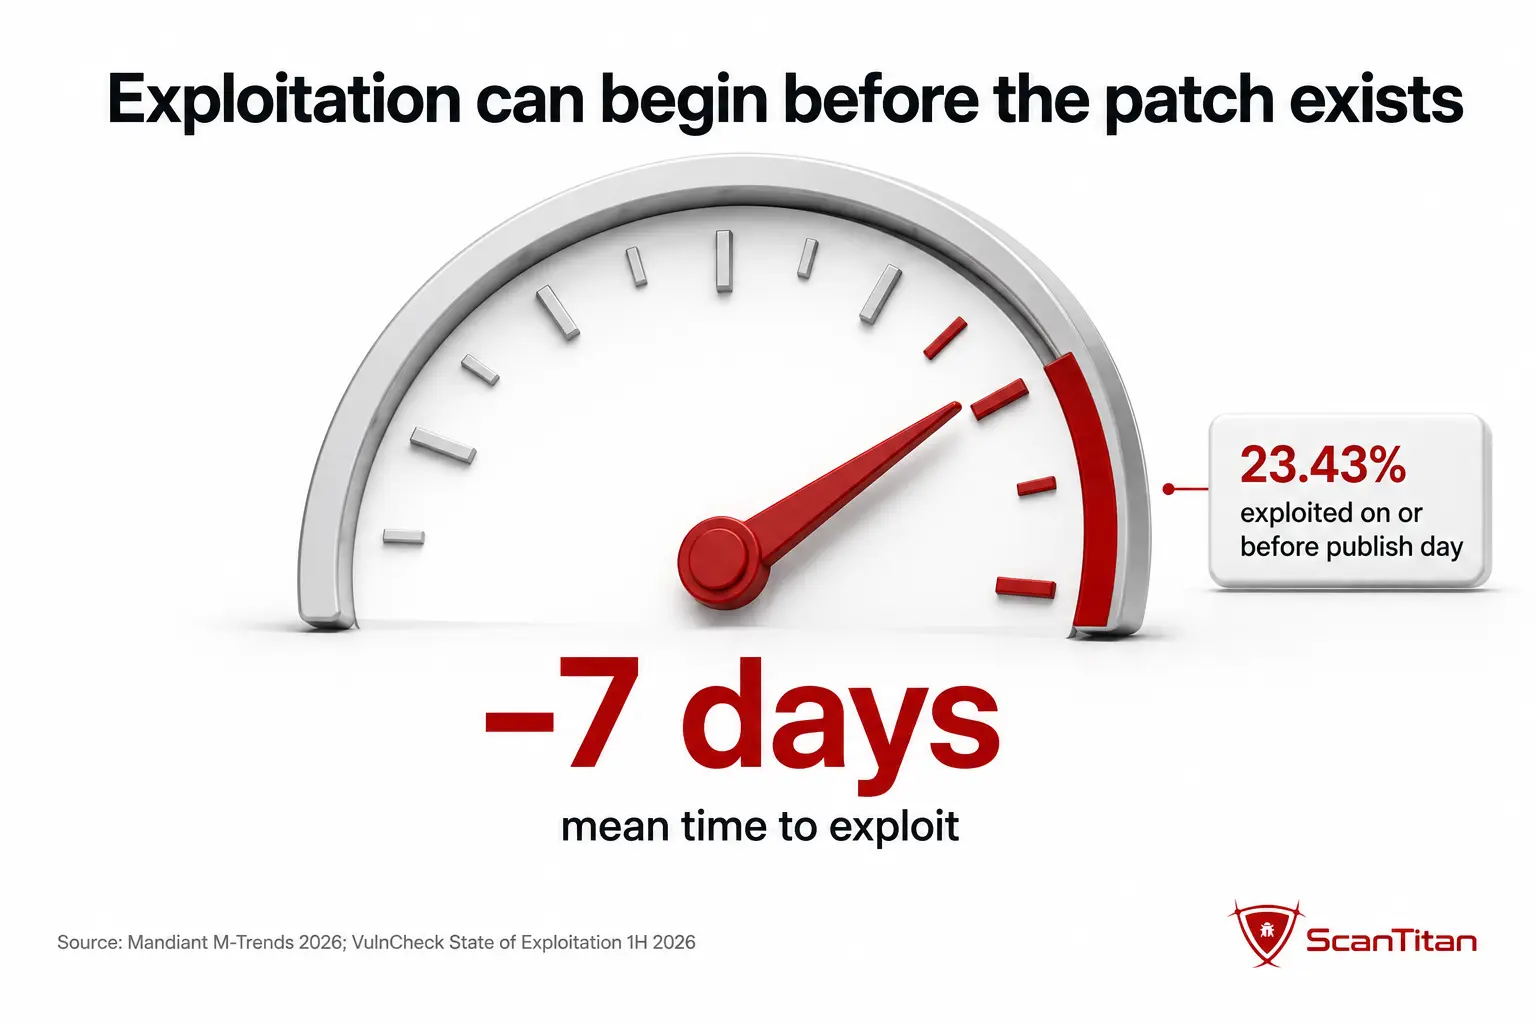
The exploitation window has compressed enough that patching after a public advisory is sometimes already late. VulnCheck found that 23.43% of the 495 KEVs in its first-half 2026 analysis had evidence of exploitation on or before the day the CVE was published. The same research found the median time from CVE publication to KEV status fell from 120 days in 2025 to 80 days in the first half of 2026, while roughly 200 CVEs became exploited within 31 days. These measurements describe VulnCheck’s exploited-vulnerability population, not every published CVE.
Mandiant provides a separate, broader timing signal. M-Trends 2026 reports an estimated mean time to exploit of negative seven days, compared with 63 days in 2018 and negative one day in 2024. A negative value means exploitation occurred, on average in the measured set, before a patch became available. That does not mean every vulnerability is exploited seven days before a patch. It reflects the growing weight of zero-day and pre-patch exploitation in the incidents Mandiant investigated.
| Measure | Figure | Population | Source |
|---|---|---|---|
| Exploited on or before CVE publication | 23.43% | VulnCheck KEVs identified in 1H 2026 | VulnCheck |
| Median CVE publication to KEV | 80 days | VulnCheck exploited-vulnerability dataset | VulnCheck |
| CVEs exploited within 31 days | About 200 | First half of 2026 | VulnCheck |
| Estimated mean time to exploit | -7 days | Mandiant incident and threat intelligence observations | Mandiant M-Trends 2026 |
The 2026 Vulnerability Gap: Exploitation Is Faster While Remediation Is Slower
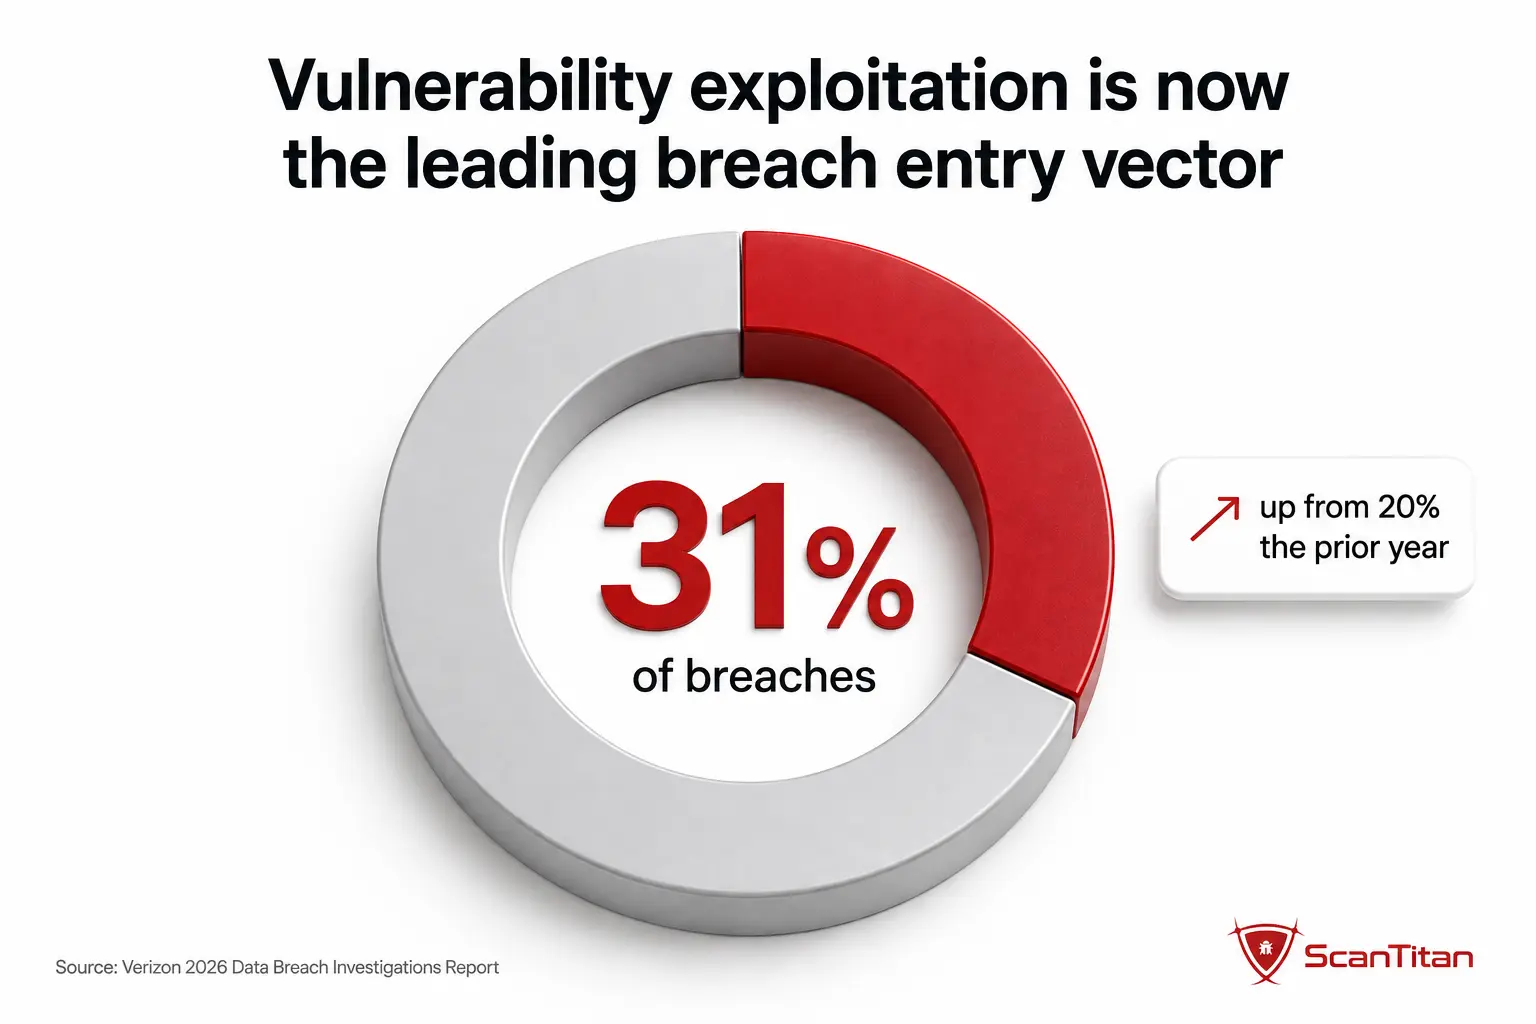
The most important vulnerability statistic of 2026 may be the gap between attacker speed and defender closure. Verizon’s 2026 Data Breach Investigations Report found that vulnerability exploitation became the leading initial access vector, accounting for 31% of breaches and overtaking credential abuse for the first time in the report’s 19-year history. In the same vulnerability-management analysis, organizations fully remediated only 26% of detected vulnerabilities in the CISA KEV catalog, down from 38% the prior year.
The rate varies significantly by sector. In Verizon’s retail-specific dataset, vulnerability exploitation accounted for 42% of known initial access. See our Retail Data Breach Statistics for the complete retail breach profile.Industry-level rates can differ significantly from that cross-industry benchmark. In financial services, Verizon’s sector-specific dataset reports vulnerability exploitation at 22% of known initial access. See ScanTitan’s Financial Data Breach Statistics research for the full finance-sector comparison. Remediation also took longer. Verizon reports that median time to full resolution increased from 32 days to 43 days, while organizations in the median case had 50% more critical vulnerabilities to patch than in the previous reporting dataset. Put beside VulnCheck’s exploitation timing and Mandiant’s negative mean time to exploit, the direction is uncomfortable: attackers are reaching selected vulnerabilities sooner while many organizations are taking longer to remove known exploited exposure.
The important comparison is directional, not mathematical. Verizon, VulnCheck, and Mandiant use different datasets and definitions. Their numbers should not be subtracted from one another to invent a universal “exposure window.” They do independently support the same operational conclusion: internet-facing exploited vulnerabilities cannot wait for a slow quarterly remediation cycle, That exploitation trend is part of a broader breach shift involving ransomware and third-party exposure, covered in our 2026 data breach statistics.
Vulnerability Severity Is Not the Same as Vulnerability Priority
CVSS remains the standard language for communicating technical vulnerability severity, but FIRST is explicit that the CVSS Base score measures severity, not risk. A Base score describes intrinsic vulnerability characteristics under generalized assumptions. It does not know whether your organization runs the affected software, whether the vulnerable service is internet-facing, whether a compensating control blocks the attack, or whether threat actors are exploiting the flaw today. Using CVSS alone for patch order therefore creates a queue sorted by technical potential rather than real exposure.
A more defensible prioritization model layers several signals. Start with confirmed exploitation, then add exploitation probability, technical severity, reachability, asset importance, and local controls. FIRST also warns against multiplying EPSS by CVSS to create a homemade risk score because the two values are built on different scales and the resulting number has no interpretable meaning. Treat them as separate inputs to a decision rather than ingredients in an arbitrary formula.
| Signal | Question it answers | Use |
|---|---|---|
| CVSS | How severe could exploitation be? | Technical severity baseline |
| CISA KEV | Is this vulnerability known to be exploited? | Urgent prioritization |
| EPSS | How likely is exploitation in the next 30 days? | Forecast-based triage |
| SSVC | What response decision fits this vulnerability and stakeholder context? | Action-oriented prioritization |
| Reachability and asset context | Can an attacker reach it, and what does the affected asset matter to us? | Environment-specific risk |
What Types of Vulnerabilities Matter Most?
Global CVE counts do not tell you which vulnerability classes dominate every environment because the answer changes by technology layer. Edgescan’s 2026 vulnerability statistics report, built from thousands of security assessments across millions of assets and more than 250 companies, found that more than 20% of internet-facing findings across its full stack were high or critical. In its application testing, SQL injection remained the most common critical web application vulnerability, continuing a pattern Edgescan says has held since 2022.
That does not mean SQL injection is the most common vulnerability in the global CVE database. It means SQL injection led the critical web application findings in Edgescan’s assessment dataset. The distinction matters because a vulnerability class can be uncommon in raw disclosure data and still be disproportionately important when it appears on a public application. The most useful vulnerability statistics therefore segment by layer: applications, APIs, CMS platforms, endpoints, network devices, cloud services, and third-party components.
Web Application and Website Vulnerabilities
Web applications deserve their own view because they are reachable by design. Edgescan reported an average time to remediate of 54.81 days for high and critical application/API vulnerabilities in its 2025 assessment data, compared with 39 days for high and critical device/network vulnerabilities. That gap is especially concerning when public-facing applications can be probed continuously by automated scanners and exploit infrastructure. For the weakness classes behind these figures, including OWASP occurrences, the CWE Top 25 and CISA KEV counts by web weakness, see our web application attack statistics.
For a site owner the actionable number is the exploitation window, not the disclosure count, which is the argument for keeping a website security scanner running continuously.
The broader web attack picture is covered in our Website Hacking Statistics research, which separates attack traffic, compromised-site detections, CMS vulnerability data, and organizational breach costs. The distinction is useful here because an application vulnerability count does not tell you how many websites were hacked, just as malicious traffic does not prove compromise.
API Vulnerability Statistics in Context
APIs expand the attack surface in ways that traditional CVE counts do not fully capture. Many serious API weaknesses are authorization, authentication, inventory, and business-logic problems rather than a published CVE in a reusable software package. That means a vulnerability database can be complete for known software CVEs and still miss a broken object level authorization flaw in a custom endpoint. For the incident, attack-volume, breach-cost, API growth, and visibility data, see our API Security Statistics.
This also changes how API vulnerabilities are tested. A CVE scanner can match known component versions, but authorization flaws require authenticated requests, multiple identities, object-level access checks, and awareness of API structure. ScanTitan’s guide to API vulnerability scanning explains why OpenAPI coverage, authentication, BOLA testing, and retesting are separate from ordinary website crawling.
CMS Vulnerability Statistics
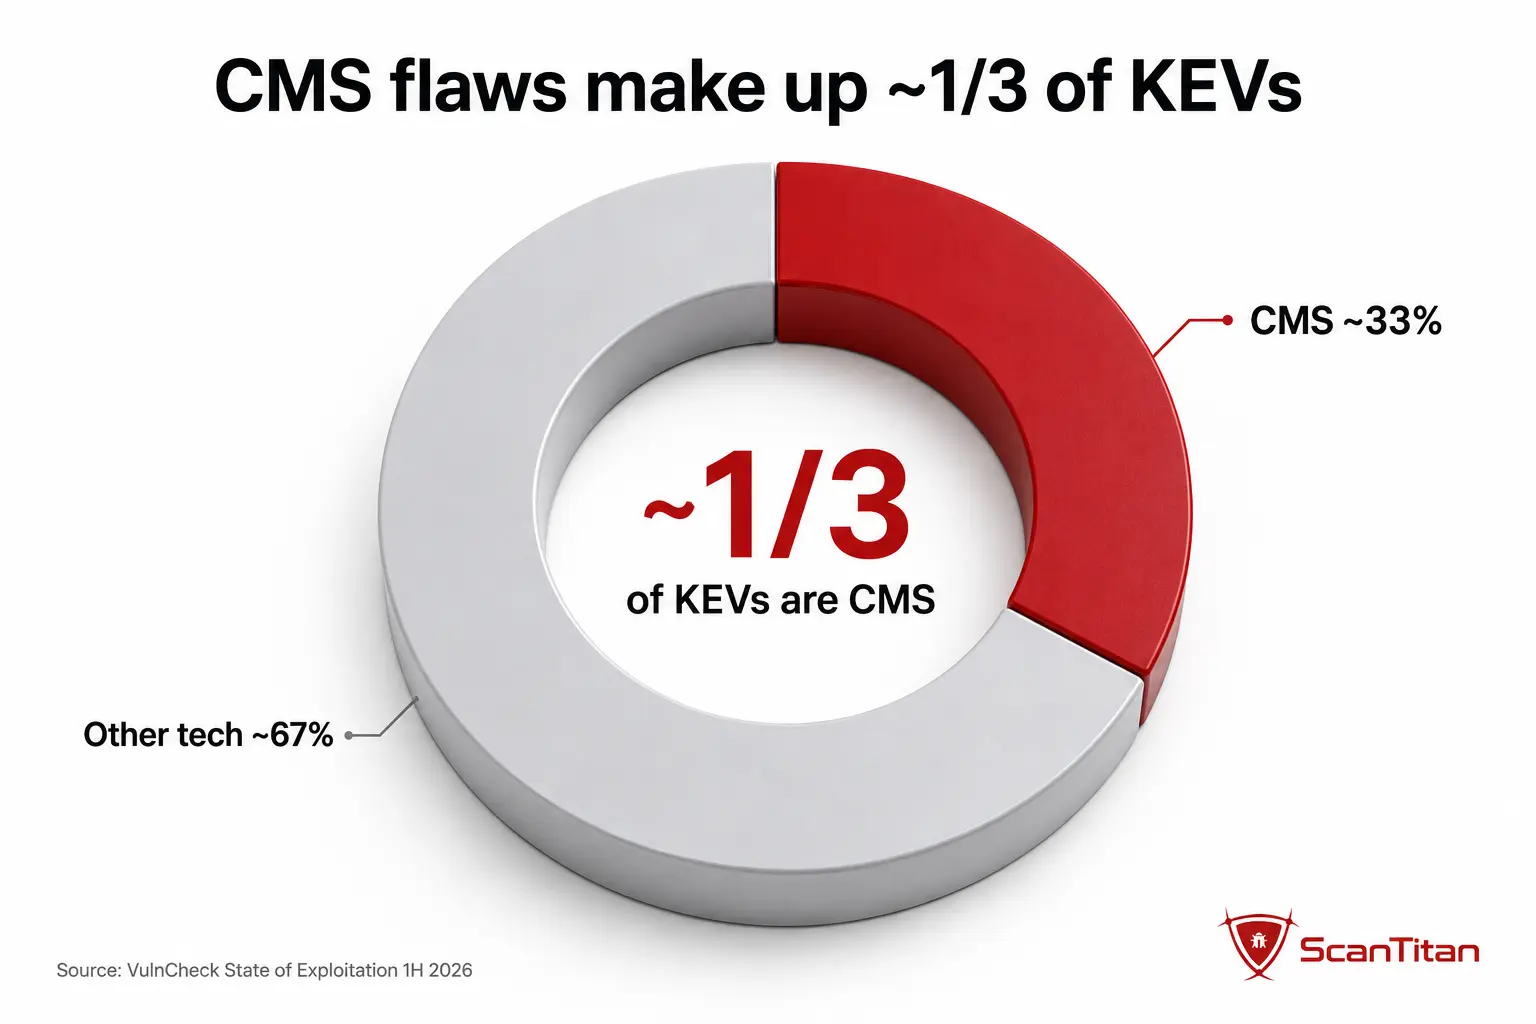
Content management systems stand out in exploitation data. VulnCheck reported 163 CMS-related KEVs in the first half of 2026, roughly one third of the exploited vulnerabilities in its dataset and the largest technology category it tracked. That concentration is important because CMS installations combine public exposure with third-party extensions, themes, plugins, and long-lived sites that may outlast their maintenance process, Drupal illustrates why CMS vulnerability data needs deployment context: a supported core release can still be exposed through vulnerable contributed modules, insecure custom code, excessive permissions, or server configuration. Our Drupal security guide explains where the platform itself is strong and where real Drupal site risk usually sits.
WordPress shows the plugin effect clearly. Patchstack recorded 11,334 new WordPress ecosystem vulnerabilities in 2025, up 42% year over year, with the overwhelming majority concentrated in plugins and themes rather than core. Our WordPress Plugin Vulnerability Statistics research reconciles Patchstack, WPScan, and Wordfence data instead of treating every database record as the same unit.
Ecommerce adds another counting problem. WooCommerce core vulnerability totals differ materially among Wordfence, Patchstack, WPScan, and CVE-based product mapping because each source counts records differently. The WooCommerce Vulnerability Statistics report separates core, WooPayments, extensions, and the wider WordPress ecosystem so extension vulnerabilities are not mislabeled as WooCommerce core flaws.
Joomla presents a similar distinction between platform core and the extension ecosystem. ScanTitan’s Joomla Vulnerability Statistics research analyzes a selected 2026 extension disclosure sample separately from the core CMS and identifies which flaws reached CISA KEV status rather than treating every extension advisory as evidence of ecosystem-wide prevalence.
Where Vulnerabilities Fit Into Ransomware
Vulnerability exploitation is an important ransomware entry path, but ransomware reporting becomes distorted when every exploited flaw is described as a ransomware event. Verizon’s breach data shows exploitation is now the leading initial access vector across breaches overall, while ransomware-specific datasets also measure stolen credentials, phishing, remote access, encryption, extortion, payment, and recovery. Those are different stages of an incident. For the ransomware-specific picture, see Ransomware Statistics.
The security implication is straightforward: vulnerability management reduces one major route into ransomware, especially through internet-facing appliances and applications, but it does not replace identity security, phishing resistance, endpoint controls, segmentation, backup integrity, or incident response. Statistics should preserve that distinction rather than turning a vulnerability-management dataset into a general ransomware dataset.
What Vulnerability Data Means for Small Businesses
Small organizations are not exposed to a separate vulnerability internet. Automated scanning reaches the same public software regardless of company size, while smaller teams usually have less staff to inventory assets, test patches, monitor advisories, and verify remediation. Verizon’s 2026 small-business data shows vulnerability exploitation as a major entry route, while ransomware research shows smaller organizations generally stop fewer attacks before damage than larger enterprises. The broader SMB evidence is covered in Small Business Cybersecurity Statistics.
The answer for a lean team is not to process every CVE manually. It is to narrow the problem. Maintain an inventory of what is actually exposed, prioritize KEV-listed flaws first, use EPSS as an additional forecast signal for the remainder, account for severity and business criticality, and verify that remediation actually closed the finding. That turns a global stream of tens of thousands of disclosures into a local queue tied to the software the business really runs.
AI Vulnerability Discovery Is Growing Faster Than Confirmed Exploitation
AI-assisted vulnerability discovery is producing enough findings to deserve its own statistical treatment, but the exploitation data is more measured than the headlines. VulnCheck tracked 1,061 vulnerabilities attributed to AI-assisted discovery and found only 14, or 1.3%, with confirmed evidence of exploitation in the wild. That rate roughly matched its broader exploitation rate for the first half of 2026. The data does not support the claim that AI-discovered vulnerabilities are automatically becoming exploited at extraordinary rates.
VulnCheck also tracked 1,611 AI-discovered findings against a 90-day disclosure deadline and reported that only 27 patches had been released as of July 21, 2026. Separately, AI products themselves emerged as a measurable attack-surface category, with VulnCheck identifying 28 KEVs tied to AI products in the first half of 2026. These are three different phenomena: AI finding vulnerabilities, vulnerabilities in AI products, and attackers using AI. They should not be collapsed into one “AI cyberattack” statistic.
The NVD Changed How It Enriches Vulnerabilities in 2026
Any 2026 vulnerability statistics report that relies on NVD severity or product metadata needs to account for NIST’s April 15 change in enrichment policy. NIST said CVE submissions increased 263% between 2020 and 2025, while submissions in the first three months of 2026 were nearly one third higher than the same period a year earlier. NIST enriched nearly 42,000 CVEs in 2025, 45% more than in any prior year, but still could not keep pace with the growing submission volume.
Under the new risk-based model, all submitted CVEs continue to be added to NVD, but NIST prioritizes enrichment for vulnerabilities in the CISA KEV catalog, software used by the United States federal government, and critical software defined under Executive Order 14028. Other CVEs may be labeled “Lowest Priority – not scheduled for immediate enrichment.” Backlogged records with an NVD publish date earlier than March 1, 2026 were moved into a “Not Scheduled” category for later consideration.
The consequence is precise: the number of published CVE records and the number of fully NVD-enriched records are not the same metric. A new CVE can exist without a complete NIST-added severity score, product applicability mapping, or weakness classification. That does not make the vulnerability unimportant. It means researchers should stop treating absence of NVD enrichment as evidence of low risk and should name whether a statistic came from CVE.org, NVD, CISA KEV, or another vulnerability database.
Vulnerability Remediation Statistics
The remediation data is where disclosure growth turns into operational risk. Verizon found only 26% of detected CISA KEV vulnerabilities were fully remediated by organizations in 2025, down from 38% in the prior year. Median full-resolution time increased from 32 to 43 days. Edgescan separately found that high and critical application/API vulnerabilities took an average of 54.81 days to close, while high and critical device/network findings averaged 39 days. These are different datasets, but both show that high-priority exposure often remains open for weeks.
The problem is not solved by demanding that every vulnerability be patched immediately. That is impossible at modern disclosure volume. Better vulnerability management reduces the denominator before remediation starts: identify the assets you own, remove unsupported systems, collapse duplicate findings, determine reachability, rank confirmed exploitation, add exploitation probability, and then use severity and business impact to order the rest. A scheduled website vulnerability scanner is the single service-page link in this report because the value of vulnerability data appears only when it is mapped back to the software and services an organization actually exposes.
From a Global Vulnerability Count to Your Real Exposure
A global vulnerability list cannot tell an organization how vulnerable it is. Real exposure is the intersection of at least five things: affected software, deployed version, reachability, exploit activity, and business impact. A company that does not run a vulnerable product has no exposure to that CVE. A company that runs it on an isolated internal system faces a different risk from one exposing it directly to the internet. A KEV-listed flaw on a critical public gateway belongs ahead of an unexploited high-CVSS issue on a decommissioning server.
This is also why asset discovery is inseparable from vulnerability management. You cannot patch an application, host, API, plugin, or subdomain that nobody knows exists. Continuous inventory and continuous vulnerability scanning reduce the lag between a new disclosure and the moment a team knows whether it matters locally. The objective is not a perfectly empty vulnerability dashboard. It is a continuously updated understanding of which reachable weaknesses create the most realistic path to compromise.
Vulnerability Statistics to Stop Citing
Large vulnerability statistics spread quickly because they sound authoritative even when the denominator has disappeared. A research page should remove bad numbers rather than compete with them. The following claims are especially easy to misuse.
| Claim | Verdict | Use instead |
|---|---|---|
| “48,244 vulnerabilities threatened every organization in 2025.” | Overstated. This is a CVE disclosure total. | State the disclosure count, then narrow by affected software, KEV, EPSS, exposure, and severity. |
| “One third of all vulnerabilities are CMS flaws.” | Wrong denominator. | VulnCheck found CMS flaws accounted for about one third of its KEVs in 1H 2026. |
| “A critical CVSS score means attackers will exploit it.” | Incorrect. | CVSS Base measures technical severity. Use KEV for confirmed exploitation and EPSS for forecast probability. |
| “Every database should have the same CVE total.” | Incorrect. | Name the source, snapshot date, and counting method. |
| “AI-discovered vulnerabilities are being exploited at unprecedented rates.” | Not supported by VulnCheck’s 1H 2026 data. | Only 14 of 1,061 AI-assisted discoveries in that dataset had confirmed exploitation. |
| “The -7 day mean time to exploit means every vulnerability is attacked seven days before disclosure.” | Incorrect. | It is Mandiant’s aggregate estimate relative to patch availability across its measured set. |
Source-Lineage Verification Table
The table below shows which source should be treated as the primary reference for the major statistics in this report. This matters because cybersecurity articles often cite another article that cites a vendor summary that cites an original dataset. Wherever the primary publisher is available, ScanTitan links to it directly.
| Statistic | Primary or original source used | Scope note |
|---|---|---|
| 2025 and 2026 CVE publication totals | CVE Program Metrics | Published CVE records, reconciled annually |
| 2026 NVD enrichment policy | NIST | NVD operational and enrichment changes |
| Confirmed exploited vulnerability catalog | CISA KEV | Evidence of exploitation in the wild |
| 1H 2026 exploitation timing and AI discovery | VulnCheck | VulnCheck KEV and exploitation research |
| 31% breach initial access and remediation metrics | Verizon 2026 DBIR | Confirmed breach and vulnerability-management observations |
| -7 day mean time to exploit | Mandiant M-Trends 2026 | Threat intelligence and incident investigations |
| CVSS definitions and severity guidance | FIRST CVSS v4.0 | Technical severity framework |
| EPSS probability definition | FIRST EPSS | 30-day exploitation probability |
| Application/network vulnerability and MTTR benchmarks | Edgescan 2026 Vulnerability Statistics Report | Vendor assessment dataset, not global CVE population |
How to Use Vulnerability Data Without Chasing Every CVE
A modern vulnerability program should reduce uncertainty, not produce the largest possible finding count. The data supports a short sequence that starts with exposure and ends with verification.
- Inventory what you actually run. Identify internet-facing applications, APIs, hosts, appliances, CMS components, plugins, cloud services, and unsupported systems.
- Match vulnerabilities to deployed versions. Remove CVEs for products and versions that do not exist in your environment.
- Prioritize confirmed exploitation. Move CISA KEV-listed vulnerabilities to the top when the affected software is present and reachable.
- Add exploitation probability. Use EPSS to rank the large remainder without pretending it is a severity score.
- Apply severity and business context. Combine technical impact with reachability, asset criticality, privileges, data sensitivity, and compensating controls.
- Remediate and retest. A closed ticket is not proof that exposure disappeared. Re-scan or validate the affected path after the fix.
- Measure the queue. Track time to remediate, age of open KEVs, reopened findings, and the share of critical exposure actually removed.
Methodology and Sources
This vulnerability statistics report follows a source-audit method rather than a “largest number wins” method. The CVE Program is used for published CVE counts because it owns the public CVE record system and explains how its quarterly and annual metrics are reconciled. NIST is used for the 2026 NVD enrichment change. CISA is used for the Known Exploited Vulnerabilities concept. FIRST is used for CVSS and EPSS definitions. VulnCheck is used for first-half 2026 exploitation timing, KEV composition, and AI-assisted discovery analysis. Verizon is used for breach-entry and remediation statistics. Mandiant is used for mean time to exploit. Edgescan is used only for findings drawn from its assessment dataset and is not presented as a global census.
Calculated values in this report are derived directly from published source totals. The 20.4% 2025 CVE growth rate is calculated from 48,244 versus 40,077. The 51.3% first-half 2026 growth rate is calculated from 35,872 versus 23,710 in the first half of 2025. The 74.4% figure compares 35,872 first-half 2026 CVEs with the full-year 2025 total of 48,244 and is explicitly not a full-year forecast. Dynamic counts should be rechecked when this report is updated.
Different datasets are kept separate when their populations or definitions differ. VulnCheck’s 23.43% publication-day exploitation figure is not merged with Mandiant’s negative seven-day mean time to exploit. Verizon’s 43-day median remediation figure is not subtracted from either exploitation measure to manufacture a universal exposure window. Edgescan’s high/critical severity shares and MTTR apply to its customers and assessments rather than the global CVE population. This page is reviewed quarterly, and disputed or weakly sourced statistics are removed rather than repeated.
Vulnerability Statistics FAQ
How many vulnerabilities were disclosed in 2025?
48,244 vulnerabilities were disclosed in 2025, according to the CVE Program’s reconciled total. That was up 20.4% from 40,077 in 2024. This is a disclosure count, not a count of vulnerabilities exploited in the wild or vulnerabilities affecting every organization.
How many vulnerabilities have been disclosed in 2026?
35,872 vulnerabilities were disclosed in the first half of 2026, according to CVE.org: 15,163 in Q1 and 20,709 in Q2. Because 2026 is still in progress, this is a first-half count rather than a final annual total.
What percentage of vulnerabilities are actually exploited?
There is no single percentage of vulnerabilities that are actually exploited across all datasets and timeframes. VulnCheck reported a 1.4% KEV-to-CVE ratio for the first half of 2026, identifying 495 CVEs with first-time exploitation evidence. CISA KEV separately tracks vulnerabilities with confirmed exploitation. Any exploitation percentage should therefore be cited with its dataset and timeframe.
How quickly are vulnerabilities exploited?
Vulnerabilities can be exploited before or on the day they are publicly disclosed. In VulnCheck’s first-half 2026 exploited-vulnerability dataset, 23.43% showed exploitation evidence on or before CVE publication, while the median time from publication to KEV status was 80 days. Mandiant’s broader M-Trends 2026 measurement reported a mean time to exploit of negative seven days relative to patch availability. These are separate measurements and should not be combined.
What is the difference between CVE and NVD?
The difference is that CVE identifies and records vulnerabilities, while NVD enriches CVE records with additional security data. CVE provides standardized identifiers and public vulnerability records. NVD adds information such as CVSS scores, CWE classifications, CPE applicability, affected-product data, and other assessment information. In 2026, NIST moved to a risk-based enrichment model, so a CVE may be published before full NVD enrichment is available.
What is the difference between CVSS, EPSS, and CISA KEV?
The difference is what each signal measures: CVSS measures technical severity, EPSS estimates exploitation probability, and CISA KEV identifies vulnerabilities known to be exploited. EPSS specifically estimates the probability that a published CVE will be exploited in the next 30 days. These signals answer different questions and work best when combined with asset exposure and business context.
Does a critical CVSS score mean a vulnerability will be exploited?
No, a critical CVSS score does not mean a vulnerability will be exploited. CVSS Base scores describe technical severity rather than the probability of exploitation. A critical vulnerability can have severe potential impact without evidence that attackers are exploiting it or that your organization is exposed. Exploitation evidence, EPSS, reachability, asset criticality, and compensating controls should also inform prioritization.
Why do vulnerability databases show different totals?
Vulnerability databases show different totals because they use different data sources, snapshot dates, counting methods, and record-processing rules. Differences can result from rejection handling, enrichment status, advisory definitions, product mappings, and branch-level records. CVE.org also recalculates quarterly figures during the year before annual reconciliation, so vulnerability totals should always be reported with their source and counting method.
Reviewed by Obaida Al-Sulaiman, Information Security Manager (CISSP, GWAPT, GXPN, GCIH, CEH), September 2026.