
API security statistics are becoming harder to interpret as APIs spread across web applications, mobile apps, microservices, SaaS integrations, artificial intelligence systems, and machine-to-machine workflows. The strongest 2026 data does not point to one universal “API attack rate.” It shows several different problems moving together: more API-related incidents, rapid API growth, weak visibility into sensitive data, high rates of authenticated abuse, and a disproportionate share of known exploited vulnerabilities. This report separates those measurements, verifies them against primary sources, and explains what the latest API security data actually says.
Short answer: Akamai’s 2026 survey found that 87% of respondents experienced an API-related security incident in the previous 12 months, while Wallarm found that API-related flaws made up 17% of the vulnerabilities it analyzed but 43% of 2025 CISA Known Exploited Vulnerabilities additions. Salt Security reported that 66% of organizations saw API counts grow by more than 50%, yet only 18% were extremely confident in their ability to detect attacks leveraging generative AI. The common theme is not simply “more APIs.” It is growth without equivalent visibility, authorization control, and detection maturity.
Last updated: September 2026. This page is a source audit and is reviewed quarterly. You are welcome to cite this research with a link back to ScanTitan.
Key API Security Statistics for 2026
The table below brings together the strongest current API security statistics from Akamai, Wallarm, Salt Security, Traceable and OWASP. Each figure includes its denominator or measurement type because survey prevalence, attack telemetry, vulnerability disclosures, confirmed exploitation and breach analysis are not interchangeable.
| Metric | Figure | What it measures | Source |
|---|---|---|---|
| Organizations reporting an API-related security incident | 87% | Survey respondents reporting at least one incident in the previous 12 months | Akamai 2026 |
| Average API-related security incidents | 3.5 | Average number reported by organizations in the previous 12 months | Akamai API Security Impact Study |
| Combined average annual financial impact | ~$700,000 | Total reported financial impact of API incidents over the previous year | Akamai 2026 |
| API-related published vulnerabilities | 11,053 of 67,058 | 17% of vulnerability bulletins analyzed by Wallarm | Wallarm 2026 |
| API-related CISA KEV additions | 43% | Share of 2025 CISA Known Exploited Vulnerabilities additions classified as API-related | Wallarm 2026 |
| Organizations with API count growth above 50% | 66% | Organizations reporting more than 50% API growth over the previous year | Salt Security H1 2026 |
| Production APIs with sensitive-data exposure | 44% | Organizations finding sensitive-data exposure in production APIs | Salt Security H1 2026 |
| Production APIs with vulnerabilities | 43% | Organizations finding vulnerabilities in production APIs | Salt Security H1 2026 |
| Production APIs with authentication problems | 41% | Organizations finding authentication problems in production APIs | Salt Security H1 2026 |
| Attack attempts from authenticated sources | 99% | Attack attempts analyzed by Salt Labs that originated from authenticated sources | Salt Security H1 2026 |
| Organizations hit by an API-related data breach | 57% | Respondents reporting an API-related data breach in the previous two years | Traceable/Ponemon 2025 |
| High API-layer attack detection ability | 21% | Organizations reporting strong ability to detect API-layer attacks | Traceable/Ponemon 2025 |
| Can prevent more than half of API attacks | 13% | Organizations able to prevent more than 50% of API attacks | Traceable/Ponemon 2025 |
| Incidents involving APIs linked to AI | 42% | Share of API incidents involving APIs connected to AI technologies | Akamai 2026 |
| Organizations knowing which APIs return sensitive data | 23% | Visibility among organizations claiming a full API inventory | Akamai 2026 |
What API Security Data Actually Measures
API security statistics become misleading when different denominators are blended into a single narrative. An “API security incident” is not the same thing as an attack request, a disclosed vulnerability, an actively exploited vulnerability, or a confirmed data breach, The same denominator problem applies across the broader threat landscape; our cybersecurity statistics research separates attack attempts, incidents, confirmed breaches, vulnerabilities, financial losses and vendor telemetry before comparing them, Akamai’s 87% figure comes from a survey of 1,840 security professionals across 10 countries and six industries. Wallarm’s 17% vulnerability share comes from analysis of 67,058 published vulnerability bulletins. Traceable’s 57% breach figure comes from a survey of 1,548 respondents across more than 100 countries. Each answers a different question.
- Survey prevalence: tells us what share of respondents experienced or observed something.
- Attack telemetry: counts or classifies observed requests and attack attempts.
- Vulnerability data: measures disclosed flaws, not successful exploitation.
- Known exploitation: tracks vulnerabilities with evidence of real-world exploitation, such as CISA KEV.
- Breach analysis: studies incidents where compromise or data exposure was confirmed.
That distinction is essential when comparing API security data across vendors. A page that says “43% of APIs are exploited” because 43% of CISA KEV additions were API-related is wrong. The 43% denominator is known exploited vulnerabilities added to KEV, not all APIs, all organizations, or all breaches.
API Attacks and Incidents Are Now a Mainstream Enterprise Problem
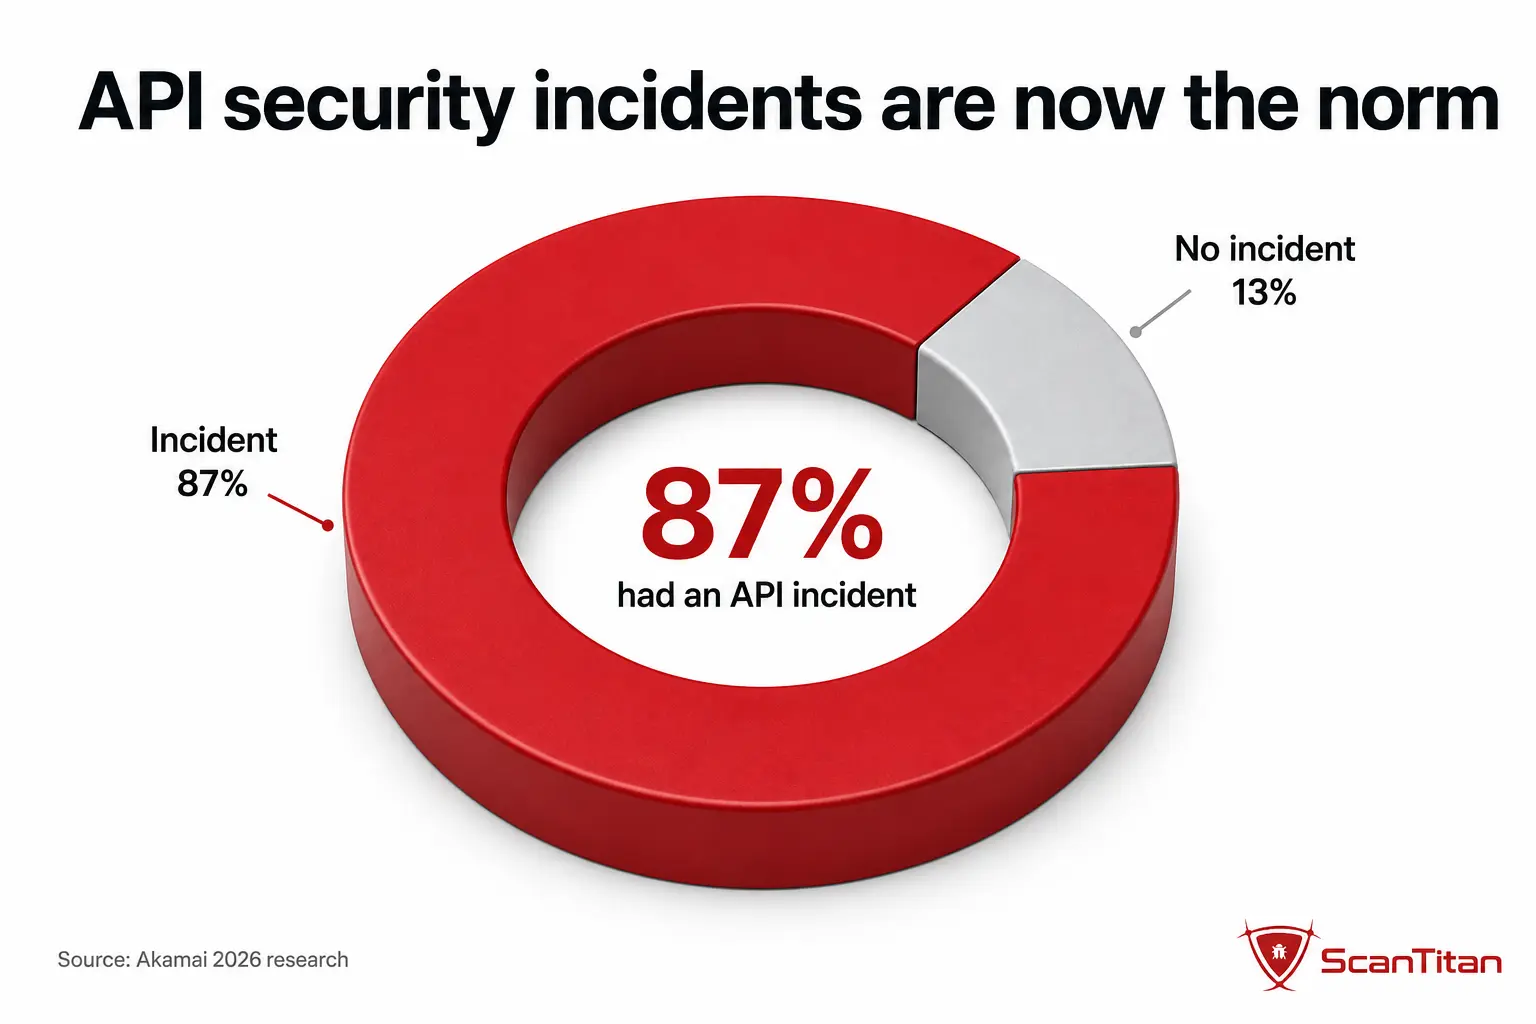
Akamai’s fourth annual API Security Impact Study found that 87% of respondents experienced an API-related security incident in the previous year, up from 76% in its 2022 comparison. Organizations reported an average of 3.5 API-related incidents over 12 months. That makes API incidents common enough that the useful question is no longer whether an organization can avoid all API risk, but whether it can discover the surface, prevent repeatable authorization failures, detect abnormal use and recover quickly when controls fail.
The business impact is also material. The underlying Akamai study says organizations experiencing API incidents reported a combined average financial impact of about $700,000 over the prior 12 months. This wording matters: some promotional summaries describe the number as a per-incident cost, but the study’s survey question asks respondents for the total financial impact of their incidents during the year. For a statistics page, the underlying survey instrument is the safer denominator.
API growth also creates operational friction before a breach happens. Salt Security reports that 32% of organizations experienced an API security incident during the prior year and 47% delayed application deployment because of API security concerns. That means API security is not only a breach-risk problem. It can become a delivery and engineering bottleneck when security review happens after APIs have already proliferated.
API Vulnerability Statistics: 17% of Disclosures, 43% of Known Exploitation
One of the strongest 2026 findings comes from Wallarm’s API ThreatStats analysis. Wallarm reviewed 67,058 published vulnerabilities from 2025 and classified 11,053, or 17%, as API-related. It then compared that disclosure pool with CISA’s Known Exploited Vulnerabilities additions and found 43% of 2025 KEV additions were API-related.
ScanTitan calculation: API-related vulnerabilities represented about 17% of Wallarm’s published-vulnerability dataset but 43% of KEV additions. By share, API-related flaws were therefore about 2.5 times as concentrated in known exploitation as they were in general vulnerability disclosures (43 ÷ 17 ≈ 2.53). This does not mean an individual API vulnerability is 2.5 times more likely to be exploited. It means API-related flaws occupy a much larger share of the confirmed-exploitation dataset than of the disclosure dataset.
This is the clearest bridge between broad vulnerability statistics and API-specific risk. Raw CVE growth tells a security team how large the disclosure universe is. KEV concentration tells the team where confirmed attacker activity is disproportionately appearing. For API owners, the combination argues for prioritizing exposed API flaws using exploitation evidence and reachability rather than CVSS alone.
| Measure | API-related share | Meaning |
|---|---|---|
| Published vulnerabilities analyzed by Wallarm | 17% | 11,053 of 67,058 vulnerability bulletins |
| CISA KEV additions analyzed by Wallarm | 43% | API-related share of vulnerabilities with known exploitation |
| Relative concentration | ~2.5× | ScanTitan calculation: 43% ÷ 17% |
API Security Trends in 2026
The most important API security trend is a shift from anonymous perimeter probing toward authenticated, behavior-based abuse. Salt Security says 99% of attack attempts analyzed by Salt Labs originated from authenticated sources. That statistic does not mean authentication has stopped mattering. It means authentication by itself is not an authorization decision. A valid token can still be used to enumerate objects, manipulate workflows, scrape data, abuse business logic or call functions a user should not be allowed to access.
This is why the 2026 API threat model increasingly centers on identity, authorization and behavior rather than only signatures. A request can be syntactically valid, come from an authenticated account and still be malicious. Traditional controls that ask “is the user logged in?” need to be paired with controls that ask “is this identity allowed to access this object, execute this function, perform this action at this rate, and follow this workflow?”
A second trend is the convergence of API security and AI security. Salt reports that 66% of organizations saw their API counts grow by more than 50% in the prior year, while nearly 90% are already using or planning to use generative AI in API development. Akamai separately found that 42% of reported API incidents involved APIs linked to AI technologies. AI systems do not eliminate the API layer; they depend on it to retrieve data, call tools and execute actions.
API Growth Is Outpacing Visibility
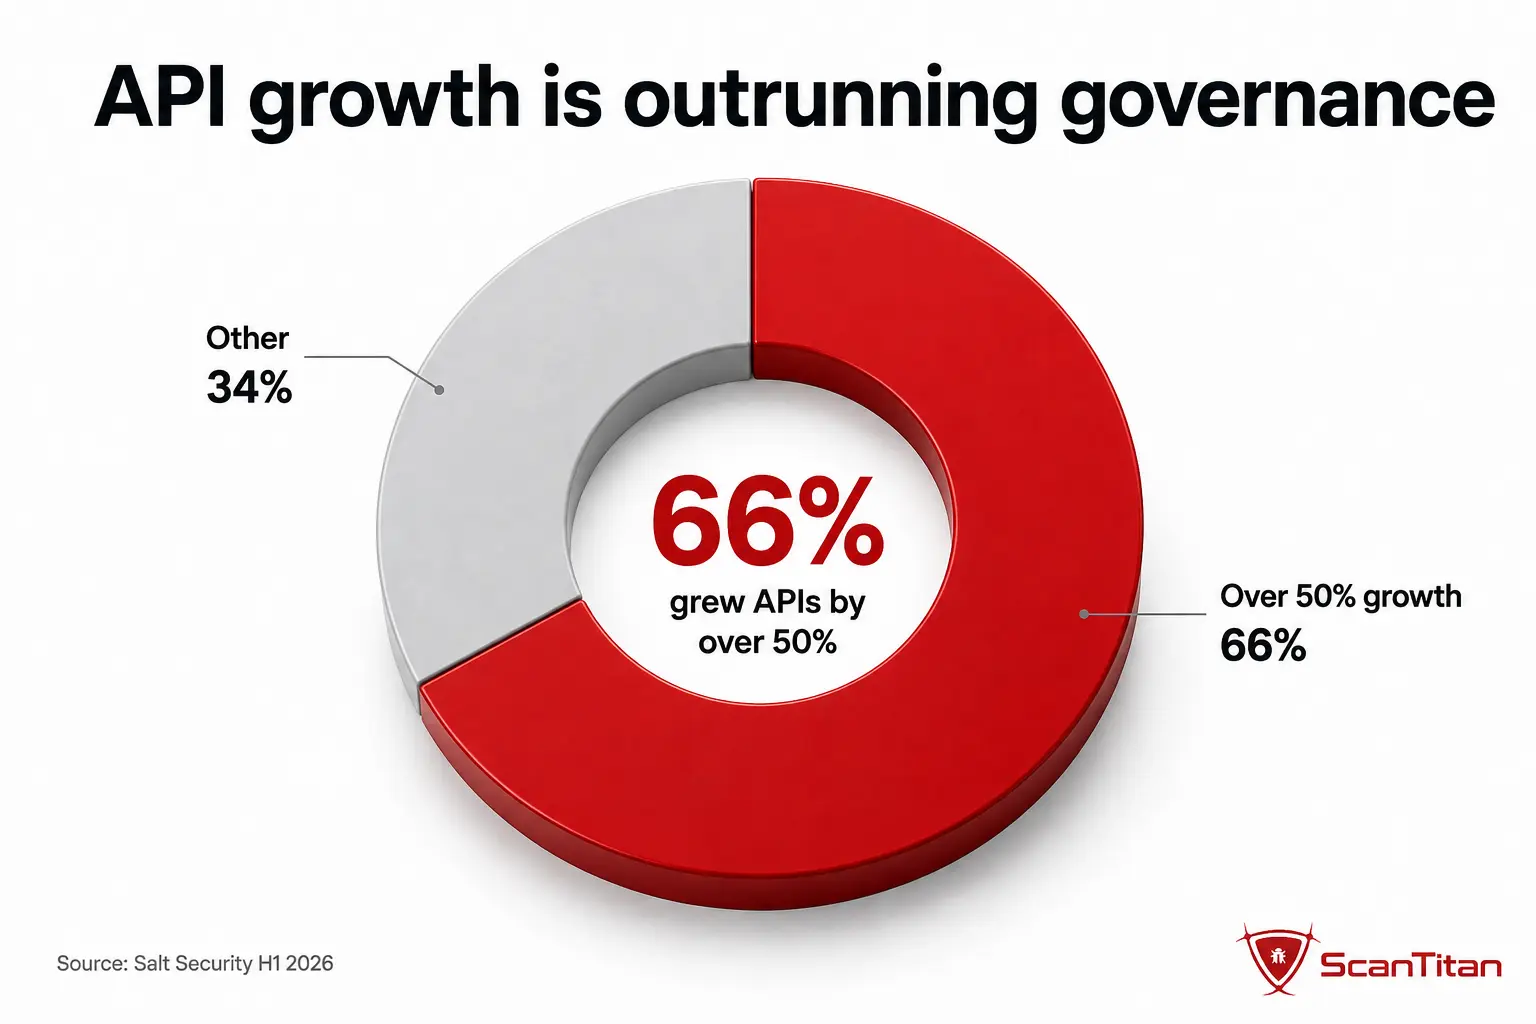
Rapid growth matters because an organization cannot test, monitor or retire an endpoint it does not know exists. Salt Security’s H1 2026 data says two-thirds of organizations reported API growth above 50% over the previous year. Akamai’s survey reveals the other side of that expansion: although many organizations claim to maintain complete API inventories, only 23% know which APIs return sensitive data.
Shadow APIs usually appear on hosts you already own, so scan your website regularly and the undocumented endpoints surface alongside everything else.
Akamai’s historical comparison makes the trend worse, not better. The share of organizations with that sensitive-data visibility was 40% in 2022 and 23% in 2026, a decline of 17 percentage points. Expressed as a relative change, that is a 42.5% decline from the 2022 level. The calculation does not prove that every organization became less mature; survey populations can change. It does show that self-reported inventory completeness is not translating into equivalent knowledge of data exposure.
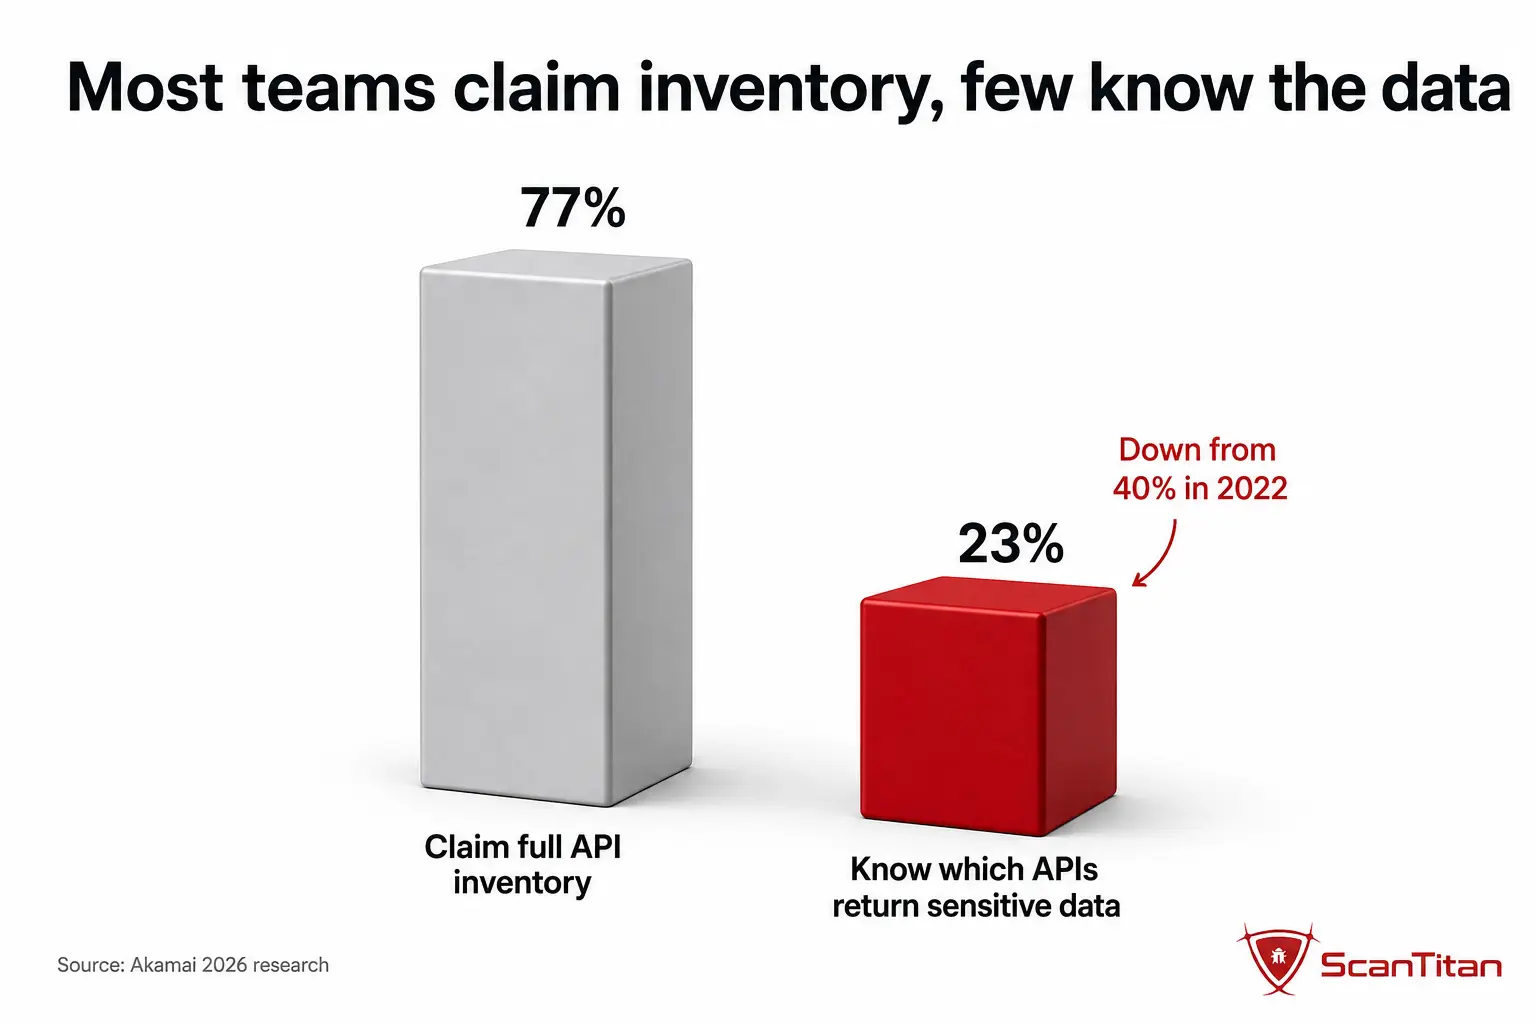
This gap is where shadow APIs and zombie APIs matter. A shadow API is an endpoint operating outside the documented or approved inventory. A zombie API is an old or deprecated endpoint that remains reachable. OWASP includes Improper Inventory Management as API9 in the API Security Top 10 because stale versions, undocumented hosts and forgotten endpoints can continue exposing data long after a newer interface has replaced them.
Authentication and Authorization Dominate API Risk
OWASP’s 2023 API Security Top 10 places Broken Object Level Authorization (BOLA) first and Broken Authentication second. OWASP also notes that three of the top five API risks are authorization-related. That emphasis matches recent breach and attack data rather than merely reflecting a theoretical framework.
Salt Security found authentication problems in 41% of production APIs reported by respondents, while credential stuffing or brute-force attacks appeared in 27%. Wallarm’s breach analysis adds a separate denominator: among 60 API-related breaches disclosed in 2025, broken authentication was involved in 52% and unsafe API consumption in 27%. Traceable’s survey likewise places brute force among the top three reported API breach methods at 27%.
| Finding | Figure | Source |
|---|---|---|
| Production APIs with authentication problems | 41% | Salt Security H1 2026 |
| Credential stuffing / brute force found in production | 27% | Salt Security H1 2026 |
| Disclosed API breaches involving broken authentication | 52% | Wallarm 2026 ThreatStats |
| API breaches using brute force | 27% | Traceable/Ponemon 2025 |
| Attack attempts from authenticated sources | 99% | Salt Labs H1 2026 |
The practical distinction is simple. Authentication establishes who or what is calling. Authorization decides what that caller is allowed to do. A stolen session, compromised API token or malicious authenticated account can pass authentication and still violate authorization. That is why BOLA testing requires object-level checks on every endpoint that receives an identifier, and why BFLA testing requires role and function checks even when a token is valid.
BOLA remains the highest-priority API access-control risk
OWASP describes BOLA as widespread because APIs commonly accept object identifiers in paths, query strings, headers or request bodies. If the server checks that a user is logged in but fails to verify that the user is allowed to access the specific object requested, changing an ID can expose or modify another user’s records. A well-designed API should perform object-level authorization for every function that retrieves or changes a record based on client-controlled input.
Broken authentication still creates direct account risk
OWASP lists weak token validation, credential stuffing, brute-force weaknesses, weak passwords, sensitive tokens in URLs and improperly validated JWTs among common broken-authentication conditions. The 2026 Salt data shows why those checks cannot be treated as a one-time login problem: attackers increasingly operate inside authenticated sessions, so session integrity, token lifecycle, rate limiting and re-authentication for sensitive actions all matter.
API Breach Statistics Show a Detection and Prevention Gap
Traceable’s 2025 State of API Security report, produced with the Ponemon Institute, surveyed 1,548 respondents across more than 100 countries and at least six industries. It found that 57% of organizations had experienced an API-related data breach in the previous two years. The more important finding may be what happened on the defensive side: only 21% reported a high ability to detect API-layer attacks, and just 13% said they could prevent more than half of API attacks.
The API defense gap: 57% reported an API-related data breach, while only 21% reported high detection ability and 13% could prevent more than half of attacks. These are separate survey questions, not a direct causal relationship, but the difference shows why breach prevalence cannot be solved by inventory alone.
Traceable also reported that DDoS accounted for 37% of reported API breach methods, fraud, abuse and misuse for 31%, and brute force for 27%. These categories matter because they show that API security extends beyond vulnerability exploitation. Business-logic abuse, automated fraud, credential attacks and resource exhaustion can all target correctly functioning endpoints.
| Metric | Figure |
|---|---|
| API-related data breach in previous two years | 57% |
| High ability to detect API-layer attacks | 21% |
| Can prevent more than half of API attacks | 13% |
| DDoS among reported API breach methods | 37% |
| Fraud, abuse and misuse | 31% |
| Brute force | 27% |
For comparison with broader organizational breach patterns, costs, causes and sector data, see our global data breach statistics research.
Bot and Automated API Abuse Statistics
Automated traffic is another place where API and website security overlap. ScanTitan’s website hacking statistics page tracks the broader shift toward automated web traffic, while API-specific studies show how automation is used for credential attacks, scraping, fraud and workflow abuse.
Traceable reports that 53% of organizations experienced bot-related attacks, yet only 21% said they could effectively mitigate bot traffic. It also found that 69% considered API-related fraud serious, while 53% said traditional WAF or WAAP controls were not effective at detecting fraud at the API layer. Those results are consistent with the broader shift toward behavior-based abuse: a request can look structurally legitimate while its sequence, rate, object access pattern or business intent is malicious.
That is why API protection increasingly needs endpoint discovery, identity context, per-object authorization, rate controls and behavioral analysis together. A WAF signature can block a known injection string. It is much harder for a signature alone to distinguish a real customer from a bot using a valid account to scrape every object the API will return.
OWASP API Security Top 10: What the Data Says About the Risk Classes
The OWASP API Security Top 10 is not itself a statistical ranking of incident frequency. It is a risk-awareness framework. The value of the 2026 data is that several independent datasets reinforce the framework’s emphasis on access control, authentication, resource abuse, inventory and third-party API consumption.
| Rank | Risk | 2026 data connection |
|---|---|---|
| API1 | Broken Object Level Authorization | Authorization remains the central API access-control challenge |
| API2 | Broken Authentication | 41% authentication problems in Salt production-API survey; 52% of Wallarm breach set involved broken authentication |
| API3 | Broken Object Property Level Authorization | Directly relevant to sensitive-data exposure and unauthorized field access |
| API4 | Unrestricted Resource Consumption | Relevant to DDoS and automated high-volume API abuse |
| API5 | Broken Function Level Authorization | Important when authenticated users can reach privileged functions |
| API6 | Unrestricted Access to Sensitive Business Flows | Maps to fraud, workflow abuse and automation |
| API7 | Server Side Request Forgery | API input can be abused to force server-side outbound requests |
| API8 | Security Misconfiguration | Includes exposed debug behavior and insecure deployment settings |
| API9 | Improper Inventory Management | Directly connected to shadow, zombie and undocumented APIs |
| API10 | Unsafe Consumption of APIs | 27% of Wallarm’s disclosed-breach analysis involved unsafe API consumption |
Salt Security reports that 78% of attack attempts leveraged one or more OWASP API Security Top 10 methods. That does not mean every OWASP category appears equally often, but it reinforces why the list remains a useful baseline for testing and threat modeling. Teams building REST or GraphQL APIs should still supplement OWASP coverage with business-specific abuse cases, because logic flaws can be unique to the product even when the underlying control failure maps back to authorization or business-flow access.
AI and API Security Statistics
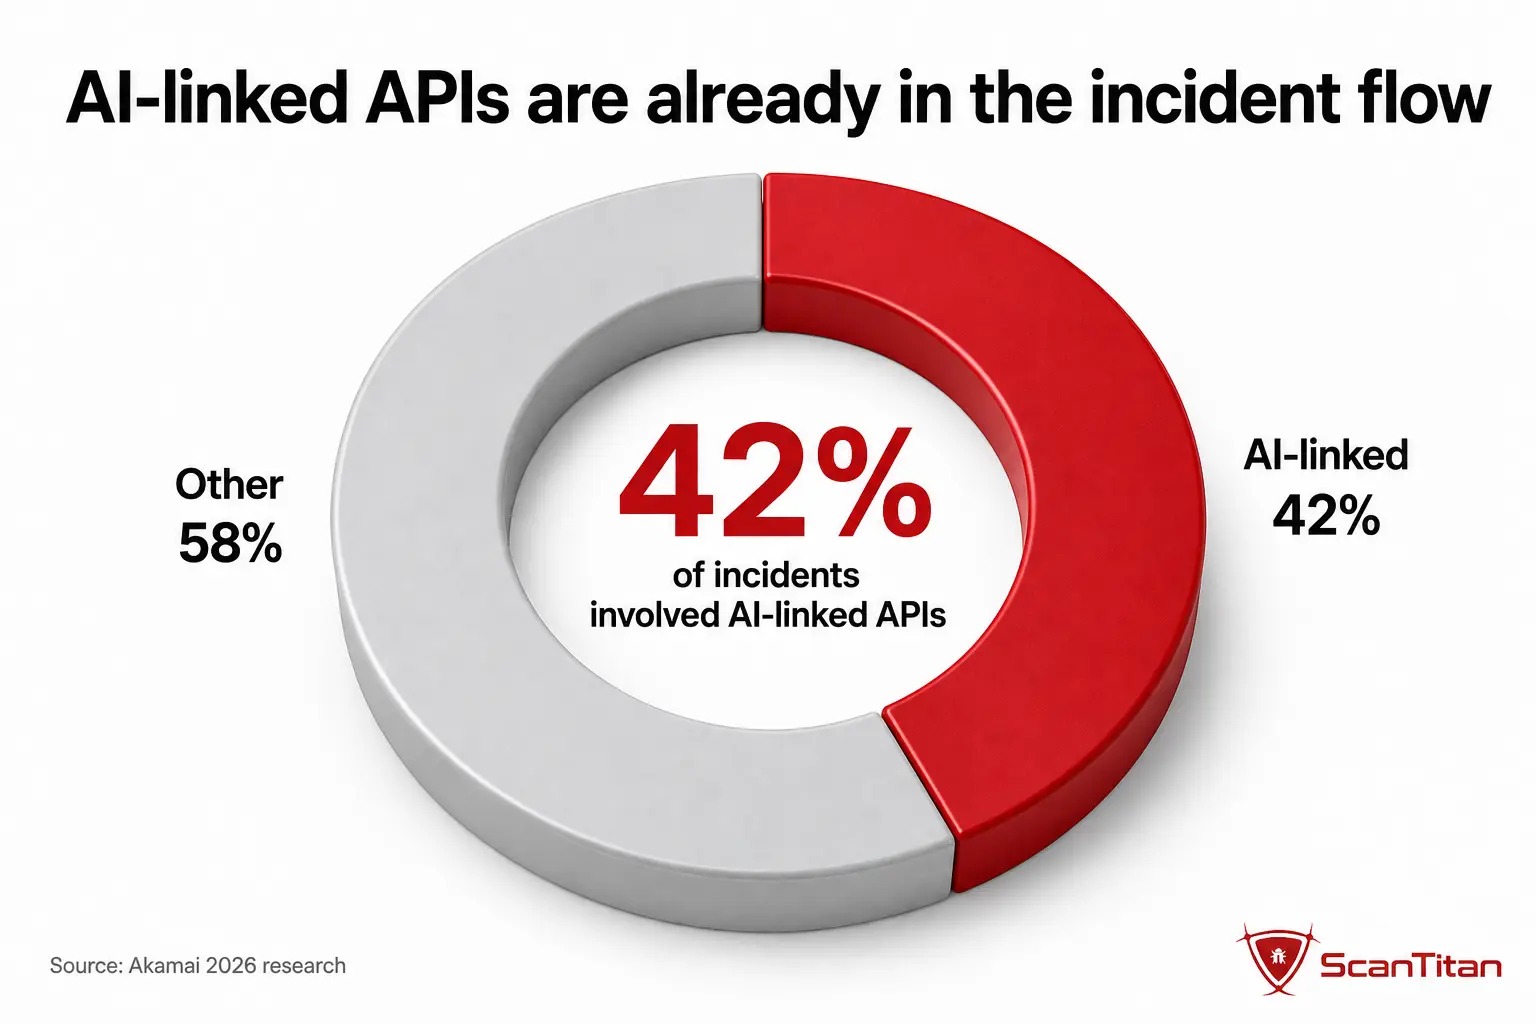
AI is accelerating API creation and changing who or what is making API calls. Akamai found that 42% of API incidents involved APIs linked to AI technologies, including large language models and autonomous agents. Salt Security reports that nearly 90% of organizations are already using or planning to use generative AI in API development, while 79% of boards and executive teams increased scrutiny of AI security risks.
The confidence level is much lower than the adoption level. Only 18% of Salt respondents were extremely confident in their ability to detect and respond to attacks leveraging generative AI. Traceable’s earlier global study found that 65% viewed generative AI as a serious to extreme API-security risk, 60% were concerned about data leakage through GenAI APIs, 50% struggled to monitor GenAI API traffic, and 34% could not discover and catalog GenAI APIs.
| Metric | Figure | Source |
|---|---|---|
| API incidents involving AI-linked APIs | 42% | Akamai 2026 |
| Using or planning GenAI for API development | Nearly 90% | Salt Security H1 2026 |
| Boards/executives increasing AI-security scrutiny | 79% | Salt Security H1 2026 |
| Extremely confident detecting GenAI attacks | 18% | Salt Security H1 2026 |
| GenAI viewed as serious/extreme API risk | 65% | Traceable/Ponemon 2025 |
| Concerned about GenAI API data leakage | 60% | Traceable/Ponemon 2025 |
| Struggle to monitor GenAI API traffic | 50% | Traceable/Ponemon 2025 |
| Cannot discover/catalog GenAI APIs | 34% | Traceable/Ponemon 2025 |
The security implication is broader than “AI code may contain vulnerabilities.” An AI agent can hold credentials, call internal APIs, retrieve sensitive data and trigger actions without a human sending each request. That makes machine identity, token scope, object-level authorization, rate control and auditable tool permissions part of API security. The API becomes the execution layer through which an AI system reaches the rest of the environment.
API Security Cost Statistics
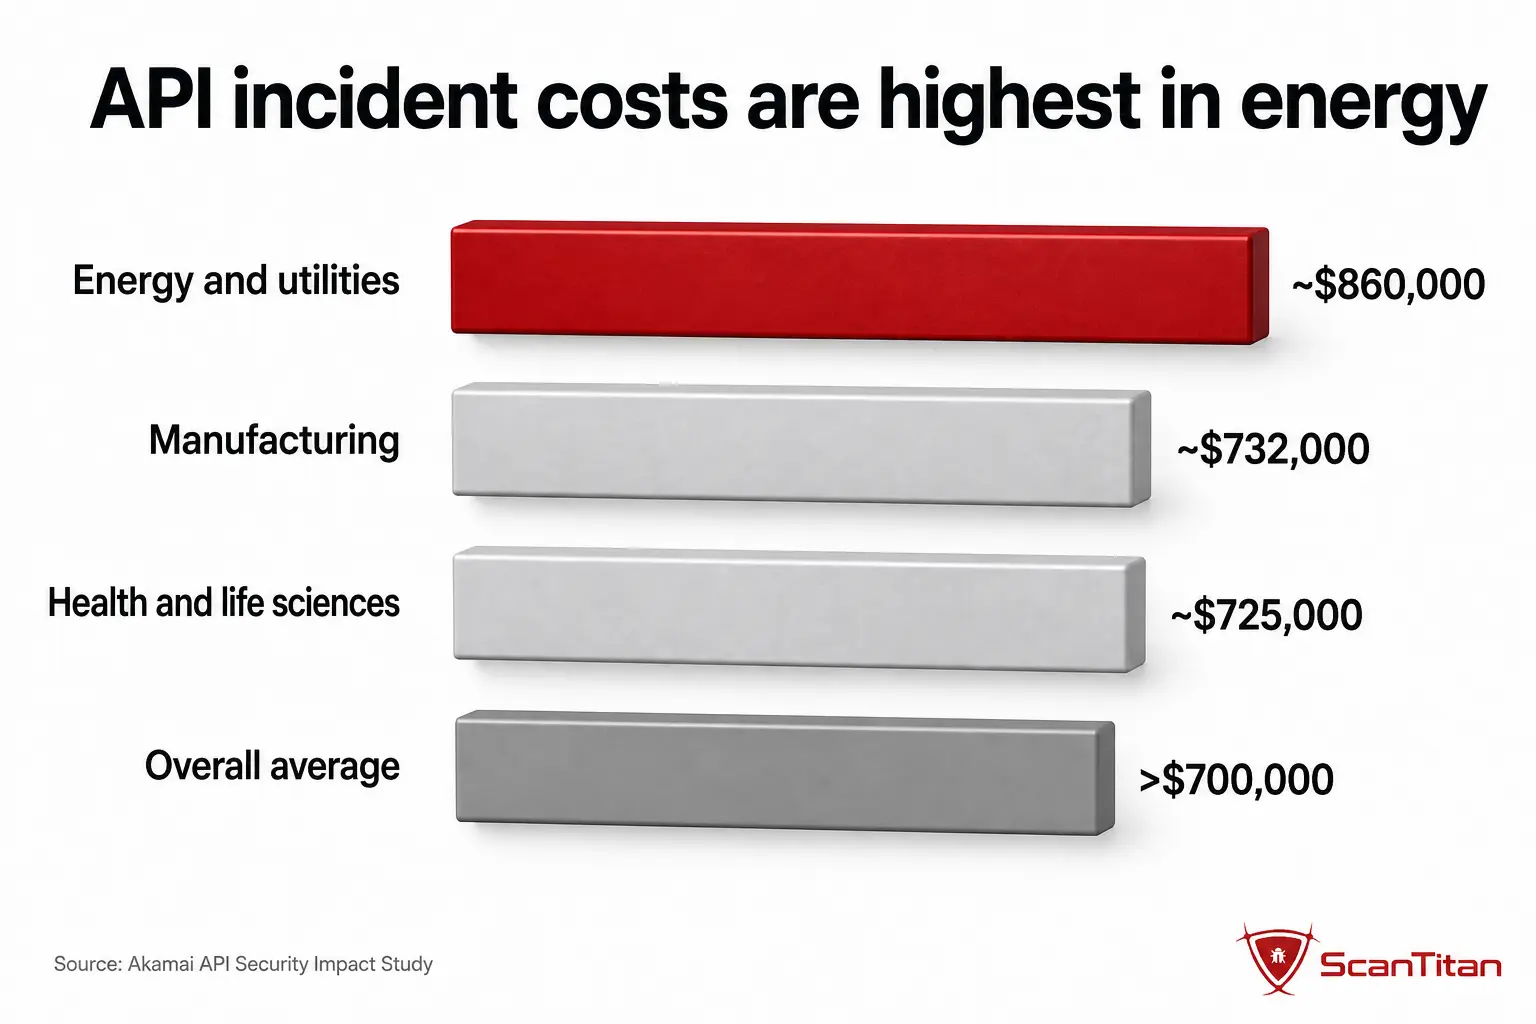
Akamai’s 2026 API Security Impact Study surveyed 1,840 security professionals and asked organizations that experienced API incidents to estimate the total financial impact over the previous 12 months, including repairs, downtime, legal fees, fines and related costs. The study reports a combined average cost of about $700,000 across the incidents organizations experienced during that period.
This is a useful example of why statistics pages need source-lineage checks. Akamai’s press release describes average costs as exceeding $700,000 “per incident,” while the underlying PDF describes 3.5 incidents with a combined average cost of roughly $700,000 and shows a survey question asking for total financial impact. Because the PDF contains the underlying question, ScanTitan uses the combined annual-impact framing rather than multiplying the number by incident count.
The wider point remains strong even with the more conservative interpretation: API incidents generate meaningful downtime, remediation and legal cost, and those losses appear alongside deployment delays and security rework. API security therefore has both incident cost and opportunity cost.
API Security by Industry
Industry comparisons should be used carefully because vendor surveys often have different sample sizes by sector. Akamai’s 2026 study still offers useful directional benchmarks. Its EMEA research found 88% of organizations in the region experienced an API-related incident, compared with 87% globally. Akamai also reports that financial services organizations are among the sectors under particularly high API attack pressure, while industries such as energy, manufacturing and health/life sciences can carry high financial impact when incidents disrupt operations or expose regulated data.
Wallarm’s analysis of 60 disclosed API-related breaches in 2025 showed concentration in software, AI platforms/tooling, cybersecurity, SaaS, automotive and cloud services. That does not prove those industries have the highest global breach rate because the dataset is based on disclosed incidents. It does show that API failures are not limited to companies selling public APIs. Any business operating SaaS, mobile applications, AI services, ecommerce workflows or cloud integrations can expose API attack paths.
For smaller organizations, this matters because APIs are increasingly embedded in SaaS products, payment flows, mobile applications and third-party integrations even when the company does not think of itself as an “API company.” Our small business cybersecurity statistics cover the broader resource, credential and vulnerability-exploitation pressures that shape how smaller teams manage that exposure.
API Security Statistics You Should Stop Citing
API statistics are repeated quickly and often lose their original denominator. Several claims should be retired unless a publisher can trace them to a current, transparent methodology.
| Popular claim | Problem | Use instead |
|---|---|---|
| “APIs are a fixed percentage of all web traffic.” | Traffic share changes by network, dataset and measurement method. | Use dated attack or traffic telemetry with the publisher and scope named. |
| “43% of APIs are actively exploited.” | Misreads Wallarm’s denominator. | 43% of 2025 CISA KEV additions in Wallarm’s analysis were API-related. |
| “The average API incident costs $700,000.” | The underlying Akamai PDF asks for combined financial impact across incidents. | Organizations experiencing API incidents reported combined annual impact of about $700,000. |
| “95% of API attacks come from authenticated users.” | Older Salt figure is superseded by H1 2026 analysis. | Salt now reports 99% of analyzed attack attempts originated from authenticated sources. |
| “Every API breach is caused by a vulnerability.” | Breaches can involve fraud, brute force, DDoS, workflow abuse and credential misuse without a CVE. | Separate vulnerability exploitation from business-logic and identity abuse. |
| “MFA reduces API breach risk by 99.9%.” | Dated claim and not API-specific; authentication does not replace authorization. | Use current API authentication, authorization and authenticated-attack data. |
What These API Security Statistics Mean for Security Teams
The 2026 data points to four priorities. First, discover the full API surface continuously. Inventory that is not connected to runtime endpoints and data flows gives a false sense of completeness. Second, treat authorization as a first-class control. Authenticated traffic can still be malicious, and object-level and function-level authorization must be enforced on every relevant call. Third, prioritize exploited and reachable flaws rather than raw CVE counts. The 17% disclosure share versus 43% KEV share shows why exploitation context matters. Fourth, bring AI-connected APIs under the same security ownership as other production APIs instead of treating AI integrations as a separate experimental layer.
- Discover every endpoint. Reconcile OpenAPI/Swagger definitions, gateway logs, traffic observation and deployment data to identify shadow and zombie APIs.
- Test authentication and authorization separately. Use multiple roles and accounts to test BOLA, BFLA, token validation, session handling and privileged functions.
- Prioritize known exploitation. Map exposed API findings to CVE, CISA KEV and exploit evidence rather than relying on severity alone.
- Monitor behavior after login. Valid credentials should not bypass object, rate, workflow or business-rule controls.
- Govern AI-linked APIs explicitly. Inventory agent credentials, tool permissions, token scope, data access and machine-to-machine flows.
For teams implementing the testing side, our guide on how to scan API for vulnerabilities covers OpenAPI/Swagger import, authenticated testing, BOLA/BFLA checks, injection testing and CI/CD scanning. If you need a single service page for the commercial next step, ScanTitan’s API vulnerability scanner supports REST and GraphQL testing, OpenAPI/Swagger import and OWASP API Top 10 coverage.
Methodology and Source Notes
This page is built as a source audit rather than a count-maximizing statistics list. We prioritize primary research and first-party security reports, label survey results separately from telemetry and vulnerability analysis, keep attack attempts separate from incidents and breaches, and avoid combining incompatible vendor datasets into invented global totals.
The principal sources are Akamai’s 2026 API Security Impact Study and related research, Wallarm’s 2026 API ThreatStats analysis, Salt Security’s H1 2026 State of AI and API Security data, Traceable/Ponemon’s 2025 State of API Security study, and the OWASP API Security Top 10. Akamai’s survey covers 1,840 security professionals across 10 countries and six industries. Traceable/Ponemon’s survey covers 1,548 respondents across more than 100 countries and six-plus industries. Wallarm’s vulnerability analysis covers 67,058 published 2025 vulnerability bulletins and its breach analysis covers 60 disclosed API-related breaches.
Where ScanTitan performs a calculation, the calculation is labeled. For example, the roughly 2.5× known-exploitation concentration is derived from Wallarm’s 43% API share of KEV additions divided by its 17% share of published vulnerabilities. We do not infer individual exploit probability from that ratio. Dynamic figures are date-stamped and should be rechecked during the next quarterly review.
API Security Statistics FAQ
How common are API security incidents in 2026?
Akamai’s 2026 survey found that 87% of respondents experienced an API-related security incident during the previous 12 months, up from 76% in its 2022 comparison. Organizations reported an average of 3.5 incidents over the year. This is survey prevalence, not a count of global API attacks.
What percentage of vulnerabilities are API-related?
Wallarm analyzed 67,058 published vulnerability bulletins from 2025 and classified 11,053, or 17%, as API-related. In the same research, API-related vulnerabilities accounted for 43% of CISA Known Exploited Vulnerabilities additions, showing a much higher concentration in the known-exploitation dataset than in general disclosures.
What is the biggest API security trend in 2026?
The clearest trend is the move toward authenticated and behavior-based abuse. Salt Security reports that 99% of attack attempts analyzed by Salt Labs originated from authenticated sources. That makes authorization, object access, business-flow controls and behavior monitoring critical even after a user or machine has successfully authenticated.
What is the most important API vulnerability?
OWASP ranks Broken Object Level Authorization as API1:2023 and Broken Authentication as API2:2023. Authorization remains the broadest access-control challenge, while recent breach data also shows authentication failures are common. Wallarm found broken authentication involved in 52% of the 60 disclosed API-related breaches it analyzed.
How many organizations have suffered an API-related data breach?
Traceable/Ponemon’s 2025 global survey found that 57% of respondents reported an API-related data breach in the previous two years. The same study found only 21% reported high API-layer attack detection ability and 13% could prevent more than half of API attacks.
How is AI changing API security?
AI is increasing both API creation and machine-driven API use. Akamai found 42% of reported API incidents involved APIs linked to AI technologies. Salt Security says nearly 90% of organizations are using or planning to use GenAI in API development, while only 18% are extremely confident in detecting attacks that leverage GenAI.
Are authenticated APIs safe from attacks?
No. Authentication verifies identity but does not prove the caller is authorized for every object, function or business action. Salt Security reports that 99% of attack attempts in its H1 2026 analysis originated from authenticated sources, which is why object-level authorization, token scope, rate limits and behavioral controls remain necessary.
How much do API security incidents cost?
Akamai’s underlying 2026 API Security Impact Study says organizations that experienced API incidents reported combined average financial impact of about $700,000 over the previous 12 months. ScanTitan uses that combined annual-impact framing because the study’s survey question asks for total financial impact across incidents rather than the cost of one isolated incident.
The strongest API security statistic in 2026 is not a single percentage. It is the convergence of several datasets: APIs are growing quickly, sensitive-data visibility is weak, authenticated abuse dominates modern attack attempts, and API-related flaws occupy a disproportionately large share of known exploited vulnerabilities. That combination makes discovery, authorization and exploitation-aware prioritization the core of API security.