How to read this researchA breach, incident, compromise, victim notice, affected account, exposed record and affected person are different units. They should not be added together or treated as competing estimates of one global breach total. Every figure below keeps its original source, timeframe, scope and measurement caveat.
Last updated: September 20, 2026. Partial-year figures are explicitly labeled H1, Q1, Q2 or YTD, and live tracker counts may be revised after organizations refine affected-person totals.
Executive Benchmark: Data Breach Statistics 2025–2026
The table below prioritizes recent figures from primary research, regulators and first-party breach trackers. It is intentionally weighted toward metrics with a clear denominator rather than the largest or most dramatic number.
| Metric | Latest figure | Period | Trend / context | Source |
|---|---|---|---|---|
| U.S. data compromises | 3,322 | 2025 | About 5% above the 2024 comparator in ITRC’s 2025 report | ITRC 2025 Annual Data Breach Report |
| U.S. data compromises | 1,803 | H1 2026 | Partial-year; Q2 alone recorded 1,029 | ITRC H1 2026 |
| U.S. victim notices | 471.2 million | H1 2026 | Already above the revised 2025 total cited by ITRC in its H1 2026 release | ITRC H1 2026 |
| Notices disclosing an attack vector | 24% | H1 2026 | Record-low transparency in the ITRC dataset | ITRC H1 2026 |
| Breaches beginning with vulnerability exploitation | 31% | 2026 DBIR | Up from 20% in the 2025 DBIR; now Verizon’s leading breach entry point | Verizon 2026 DBIR |
| Breaches involving ransomware | 48% | 2026 DBIR | Up from 44% in the prior edition | Verizon 2026 DBIR |
| Breaches involving third parties | 48% | 2026 DBIR | Up from 30% in 2025 and 15% in 2024 | Verizon |
| Exploitation as initial infection vector | 32% | 2025 investigations | Most common initial vector in Mandiant’s IR sample | Mandiant M-Trends 2026 |
| Vishing as initial infection vector | 11% | 2025 investigations | Second-most commonly observed vector in Mandiant’s sample | Mandiant M-Trends 2026 |
| Email phishing as initial infection vector | 6% | 2025 investigations | Down from 14% in the prior Mandiant sample | Mandiant executive edition |
| Global median dwell time | 14 days | 2025 investigations | Up from 11 days | Mandiant M-Trends 2026 |
| Investigations first detected internally | 52% | 2025 investigations | Up from 43% | Mandiant M-Trends 2026 |
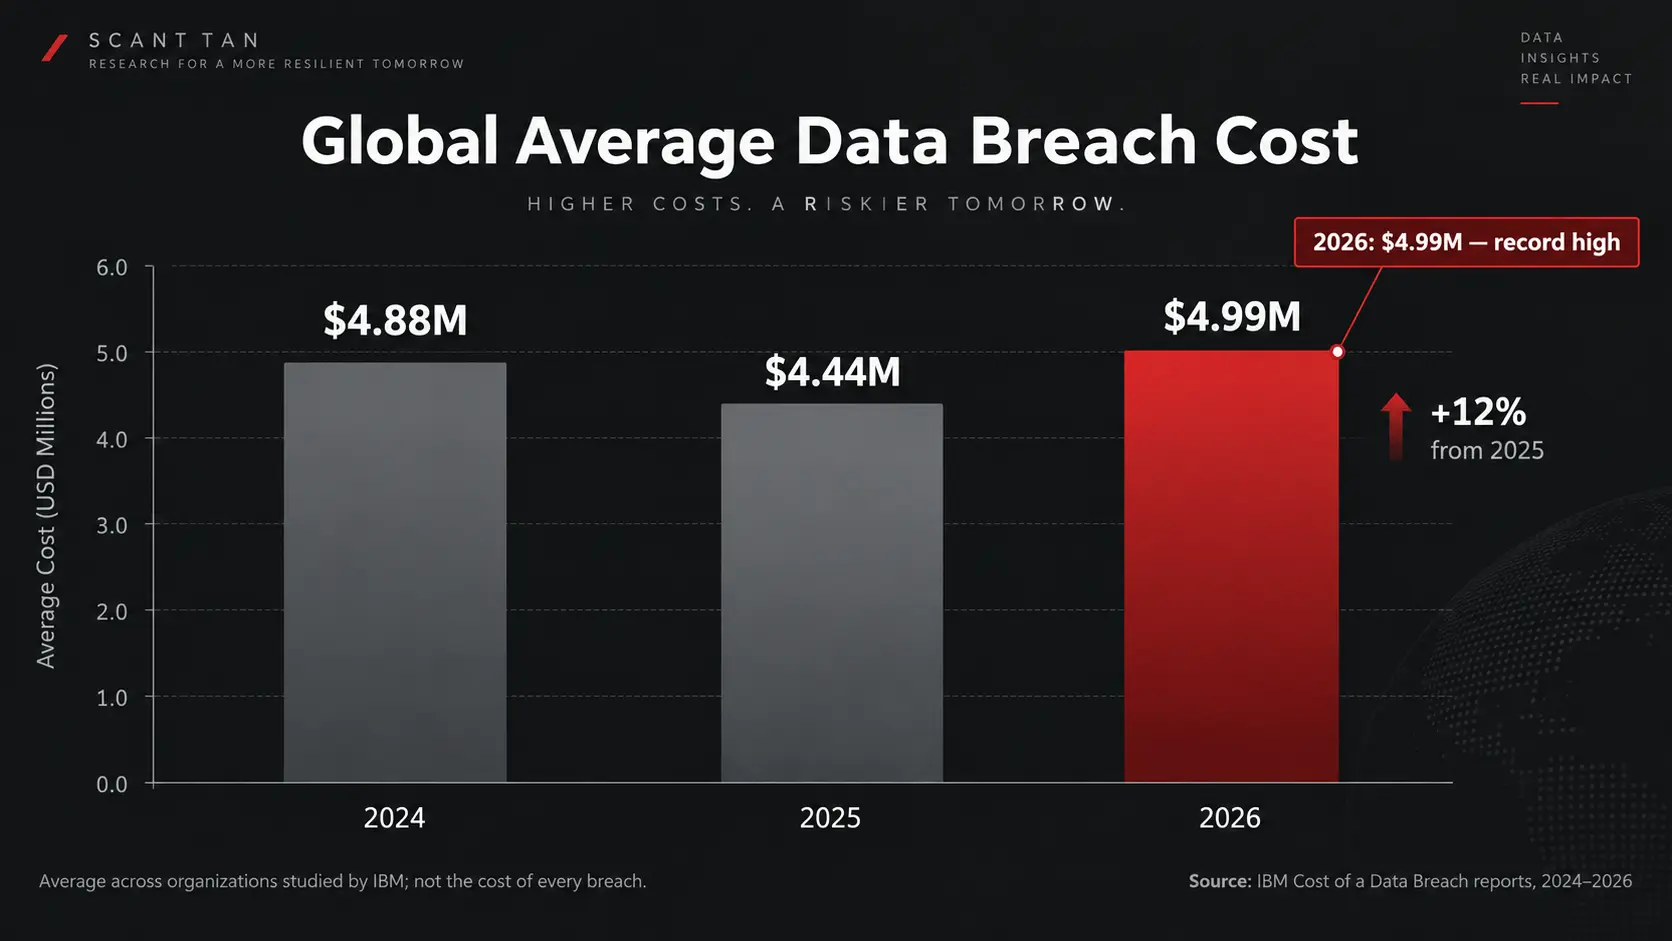
| Global average breach cost | $4.99 million | IBM 2026 study | Up 12% from $4.44 million in 2025 | IBM Cost of a Data Breach 2026 |
| U.S. average breach cost | $11.5 million | IBM 2026 study | Highest country average cited by IBM | IBM |
| Healthcare average breach cost | $6.64 million | IBM 2026 study | Highest industry average for the 15th consecutive year | IBM |
| Malicious breaches that were AI-enabled | 25% | IBM 2026 study | Study-specific figure; not a global breach census | IBM newsroom |
| Average cost of AI-enabled malicious breaches | About $6 million | IBM 2026 study | Roughly $1 million above IBM’s global breach average | IBM newsroom |
| Australia NDB notifications | 1,205 | 2025 | Up 8% from 2024 | OAIC |
| Canada breach reports | 1,147 | FY2025–26 | Reports fell while affected-account totals rose slightly | Office of the Privacy Commissioner of Canada |
| Canadian accounts affected | 20.38 million | FY2025–26 | Account count; not necessarily unique people | OPC Canada |
Trend key: increases and declines above are only shown where the source provides a directly comparable prior period or the calculation is straightforward within the same reporting family.
The important finding is not simply that “data breaches are increasing.” Different dimensions are moving differently. ITRC recorded a record U.S. compromise count in 2025, yet victim notices fell sharply from the mega-breach-heavy 2024 total before surging again in H1 2026. Verizon and Mandiant independently show exploitation becoming more prominent, while ransomware and third-party involvement remain high. IBM, meanwhile, measures the financial consequences rather than event frequency. These results can all be true at the same time because they describe different parts of the breach lifecycle.
Methodology: What Counts as a Data Breach?
A defensible statistics page starts with definitions. Without them, a high-volume tracker, a privacy regulator and an incident-response firm can appear to contradict one another even when all three are correct within their own populations.
Breach vs Incident vs Compromise vs Victim Notice
| Term | What it means in this research | Why it cannot be substituted for another unit |
|---|---|---|
| Security incident | A security event that may or may not include confirmed data disclosure. | A DDoS outage or attempted intrusion can be an incident without being a data breach. |
| Confirmed breach | An event with confirmed unauthorized access, acquisition or disclosure of data under the source’s methodology. | Thresholds differ by dataset and jurisdiction. |
| ITRC compromise | An event tracked in ITRC’s U.S. breach database. | It is a tracker-defined U.S. event, not a worldwide census. |
| Victim notice | A notification generated by a compromise. | Notices are not necessarily unique people or records and can be concentrated in mega-breaches. |
| Affected account / person / record | The unit reported by an organization or regulator. | One account can contain multiple records; one person can appear in multiple systems or incidents. |
| Average breach cost | An economic mean across studied breached organizations. | It is not an annual global loss total and does not represent every breach. |
Why Data Breach Counts Disagree
National reporting laws, tracker inclusion rules, sample composition and reporting lag all change what gets counted. Australia’s Notifiable Data Breaches scheme covers entities under the Privacy Act and requires notification when a breach is likely to result in serious harm. Canada applies different federal and private-sector regimes. The U.K. government’s Cyber Security Breaches Survey is a survey of organizations that identified breaches or attacks, not a statutory count of confirmed data disclosures. Verizon’s DBIR is a contributed analytical corpus rather than a global census.
Research ruleDo not rank countries or add U.S. compromises, Australian NDB notifications, Canadian breach reports and Verizon confirmed breaches into one “global total.” Their reporting systems, denominators and legal thresholds are not comparable.
Source Confidence and Verification
This research gives the highest weight to regulators, SEC/company filings and original primary datasets such as Verizon, IBM, Mandiant, ITRC, OAIC and Canada’s privacy commissioner. Tracker figures are retained with their dataset label. Attacker claims and secondary roundups are not promoted to the same evidentiary level unless they can be cross-verified.
Data Breach Statistics by Year
U.S. Data Compromises: 2023–H1 2026
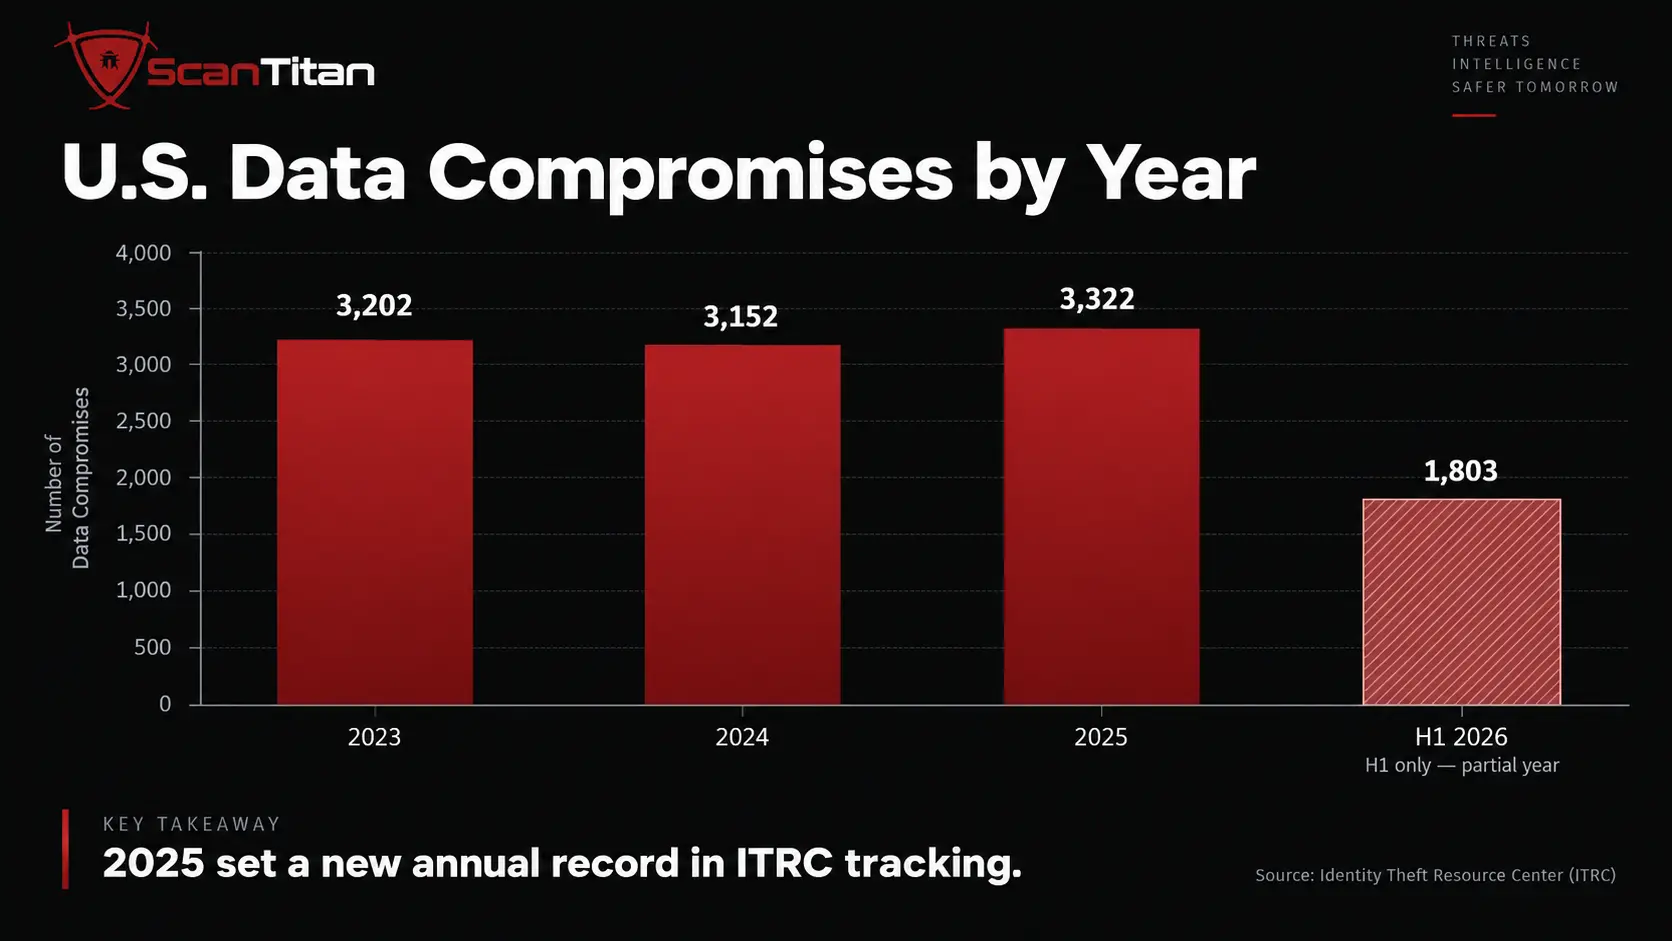
ITRC’s annual series provides one of the cleaner year-over-year views because the same organization applies a consistent tracking framework. Its 2025 annual report cites 3,202 compromises in 2023, 3,152 in 2024 and a record 3,322 in 2025. H1 2026 then recorded 1,803 compromises, including 1,029 in Q2 alone. The half-year figure should not be plotted as though it were a full-year decline or increase.
Victim Notices Show Why Mega-Breaches Distort the Trend
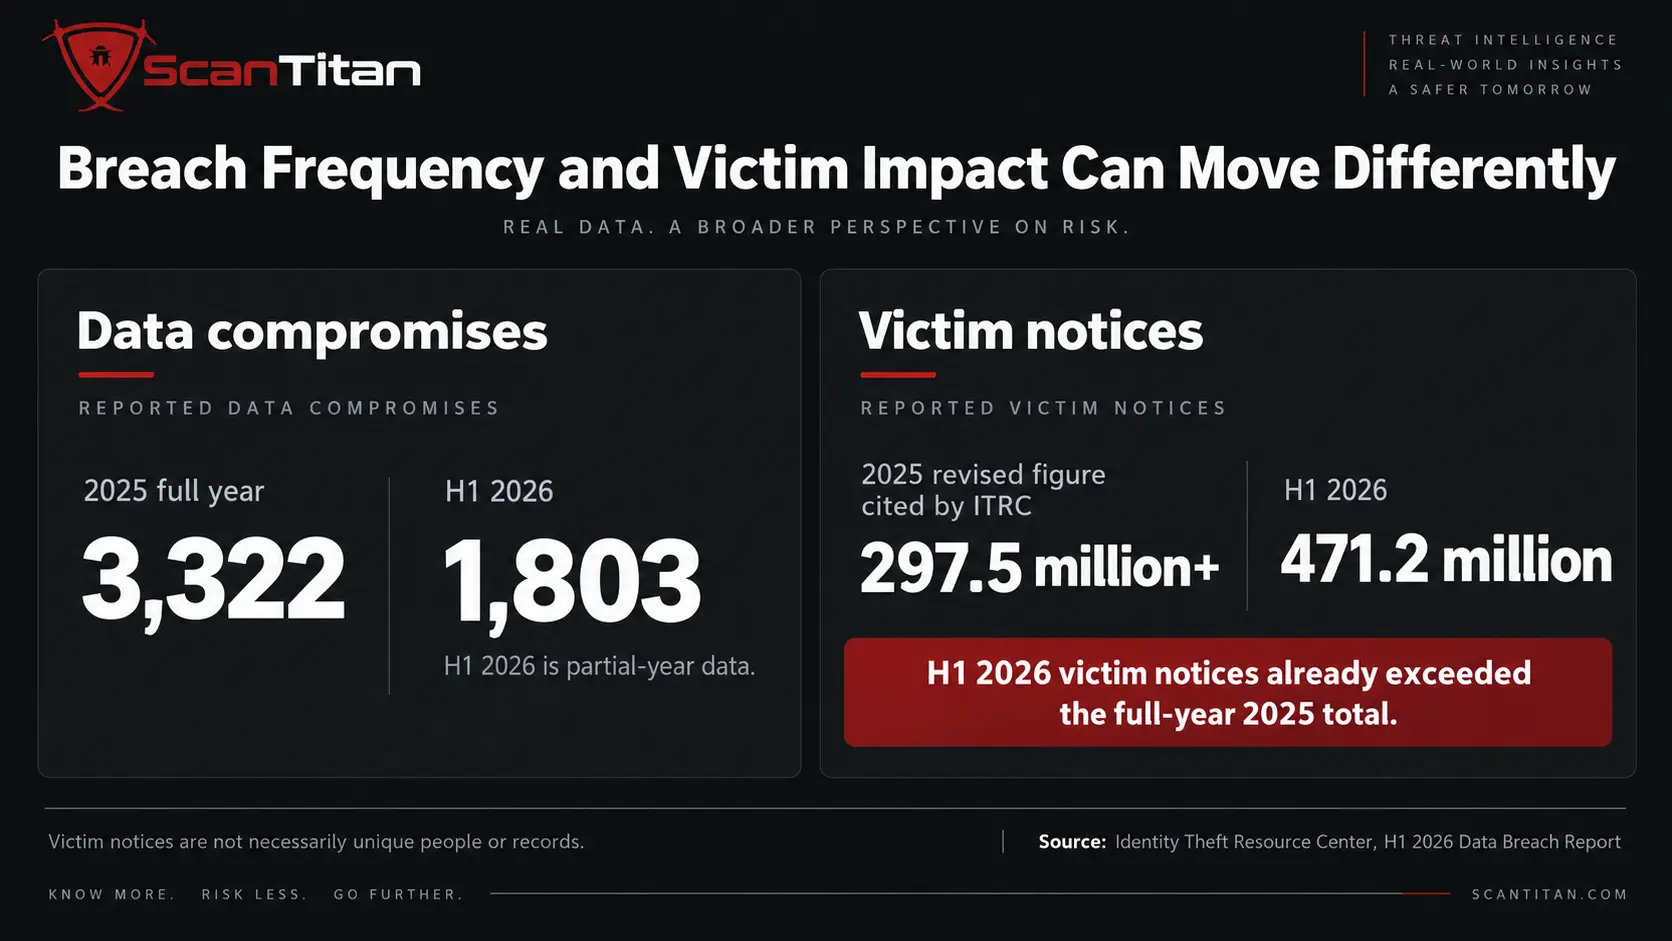
The number of compromise events and the number of victim notices can move in opposite directions. ITRC reported roughly 1.37 billion victim notices in 2024, driven heavily by a handful of mega-events. Its January 2026 annual release initially reported 278.8 million notices for 2025; the later H1 2026 release referenced a revised 2025 figure above 297.5 million. H1 2026 then reached 471.2 million notices in only six months.
This is why a headline such as “records exposed rose X%” can be misleading without checking whether one or two events dominate the denominator. It is also why tracker datasets should be cited with the edition date: affected-person totals are often revised as organizations complete investigations.
Breach Transparency Is Getting Worse
ITRC reported that 70% of 2025 breach notices did not include attack information. In H1 2026, only 24% of notices disclosed an attack vector. That creates a fundamental research limitation: breach counts may be known before root cause is publicly disclosed, and some organizations never publish enough technical detail to classify the initial vector with confidence.
What Causes Data Breaches in 2026?
There is no single universal cause ranking, but the latest high-quality datasets show a clear change in entry mechanisms. The strongest common signal is the rise of software exploitation, while credentials, social engineering, ransomware and third-party exposure remain important parts of the same attack chain.
Exploited vulnerabilities remain a leading cause, so scan your website regularly and treat internet-facing findings as the highest priority.
Vulnerability Exploitation Has Become a Leading Entry Point
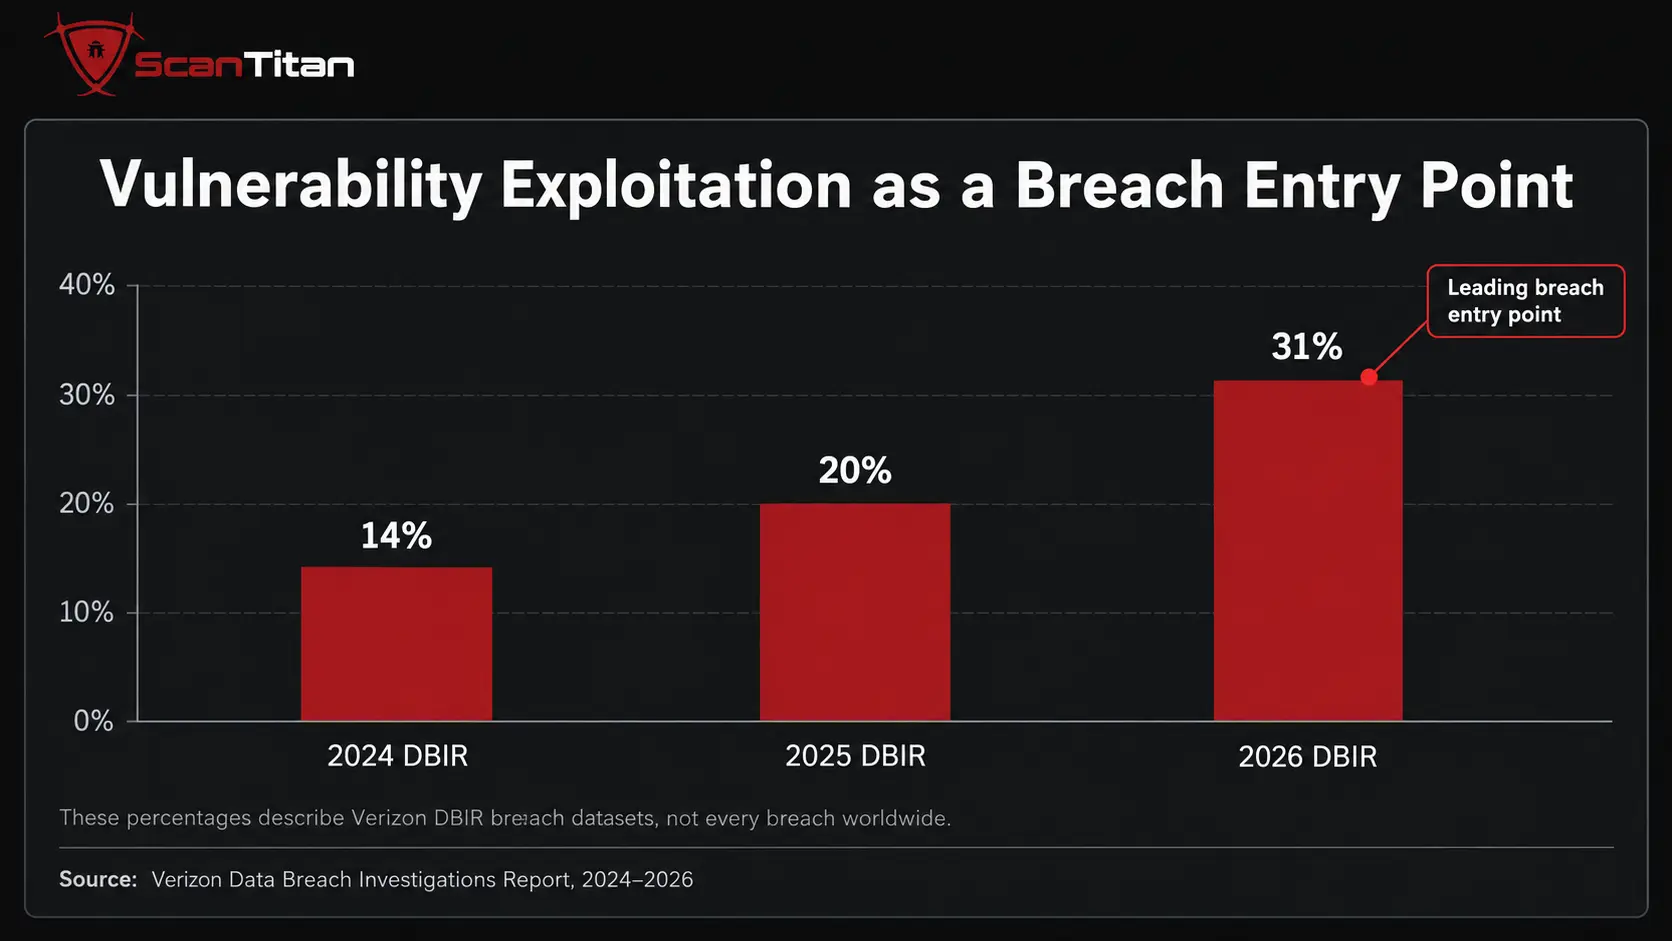
Verizon’s DBIR shows vulnerability exploitation rising from about 14% of breach initial access in the 2024 edition to 20% in 2025 and 31% in 2026. For the first time in the DBIR’s history, exploitation surpassed stolen credentials as the leading breach entry point. Mandiant independently found exploitation in 32% of its 2025 incident-response investigations.
The two percentages should not be averaged because Verizon measures breach entry points in a contributed corpus while Mandiant measures initial infection vectors in IR engagements. Their agreement is still analytically important because two differently constructed datasets point in the same direction. ScanTitan’s Vulnerability Statistics 2026 research goes deeper into CVEs, known exploitation, remediation and the gap between disclosure volume and real-world risk.
Ransomware Appeared in 48% of Verizon’s 2026 Breaches
Ransomware was present in 44% of breaches in Verizon’s 2025 DBIR and 48% in the 2026 edition. This does not mean ransomware caused initial access in 48% of breaches or that 48% of victims paid. It means ransomware was part of the breach pattern. Mandiant adds another layer: in ransomware-related engagements, a prior compromise was the initial route in 30% of cases, showing how access brokers and hand-offs can separate entry from eventual extortion.
“Human Element” Is Not the Same as “Human Error”
Popular articles often collapse social engineering, credential use, privilege misuse and mistakes into a single “human error” percentage. That is methodologically weak. Verizon’s human-element terminology is broader than accidental error, and the newest breach-entry data does not support the blanket claim that 95% of all data breaches are caused by human mistakes.
Third-Party and Supply-Chain Data Breach Statistics
For a deeper analysis of vendor involvement, supply-chain exposure, breach costs and downstream impact, see our third-party data breach statistics research.
class=”stw”>
A Small Number of Originating Breaches Can Create Huge Downstream Impact
ITRC reported that 38 initial H1 2026 supply-chain breaches affected 206 organizations and generated 280.6 million victim notices. That concentration is the important story: the number of originating events can be small while the downstream notification volume is enormous.
Third-party involvement should not be treated as synonymous with software supply-chain compromise. The latter is a narrower mechanism. ScanTitan’s guide to JavaScript npm supply-chain attacks covers one specific software-dependency path, while the breach statistics here include a wider vendor and service ecosystem.
Data Breach Cost Statistics
The Global Average Breach Cost Reached $4.99 Million
IBM’s global average breach cost moved from $4.88 million in 2024 to $4.44 million in 2025, then rose to a record $4.99 million in the 2026 study. The current $4.99 million figure comes from 602 breached organizations with incidents experienced between March 2025 and February 2026. It is a sample mean, not a forecast of what every breach will cost.
This also exposes a freshness problem in the current SERP: some 2026 statistics pages still cite $4.88 million as the current average even though that is IBM’s 2024 figure.
U.S. and Healthcare Breaches Remain Especially Expensive
IBM’s 2026 report puts the U.S. average at $11.5 million. Healthcare averaged $6.64 million and remained the highest-cost industry for the 15th consecutive year. IBM also reported financial-services breaches averaging about $6.3 million in its 2026 analysis.
Detection, Escalation and Lost Business Drive Much of the Cost
IBM reports that detection and escalation plus lost business accounted for 63% of the costs in its 2026 study. That helps explain why breach cost is not just a “records stolen” metric. Downtime, forensic investigation, customer response, legal work, notification, remediation and lost revenue can exceed the direct value of the data itself.
Detection, Dwell Time and Containment Statistics
Dwell Time and Full Breach Lifecycle Measure Different Clocks
Mandiant’s global median dwell time rose from 11 to 14 days in its 2026 report. IBM’s 2025 study, by contrast, measured an average breach lifecycle of 241 days across identification and containment, while IBM’s current data-breach guidance cites an average 247 days to identify and contain a breach in the 2026 study. These numbers should not be plotted as direct competitors: one is a median attacker-presence metric from incident-response investigations, while the other is a broader organizational breach lifecycle mean.
Organizations Detected 52% of Mandiant Investigations Internally
Across Mandiant’s 2025 investigations, organizations first detected malicious activity internally 52% of the time, up from 43% in 2024. External entities notified organizations in 34% of cases, while adversaries themselves were the source of notification in 14%.
Security AI and Automation Were Associated With Faster Resolution
IBM reports that organizations with extensive security AI and automation resolved breaches 65 days faster and saved an average of $1.93 million compared with organizations using none. That is an association within IBM’s study population, not a guaranteed return from buying an AI product.
AI Data Breach Statistics
One in Four Malicious Breaches in IBM’s Study Were AI-Enabled
IBM found that 25% of malicious breaches in its 2026 study were AI-enabled, a 56% increase from the previous study. Those breaches averaged about $6 million in cost. The wording matters: this is a percentage within IBM’s study population, not evidence that one quarter of all breaches worldwide involve AI.
More Than 20% of Organizations Reported a Breach Targeting AI Models or Applications
IBM reported that more than one in five organizations in its sample experienced a breach targeting AI models or applications. Among those organizations, 92% lacked proper AI access controls. The surrounding environment mattered as much as the model itself: compromised APIs, applications or plug-ins accounted for 27% of the causes cited in AI-related incidents, and cloud misconfigurations accounted for another 27%.
That finding links AI breach risk to the same API, identity and cloud controls that already matter elsewhere. ScanTitan’s API Security Statistics 2026 research covers the wider API attack and visibility problem.
AI Has Not Replaced Conventional Breach Paths
Mandiant’s 2026 analysis provides an important counterweight: its frontline investigations still show software exploitation, social engineering and prior compromise as the dominant routes into organizations. The strongest reading of the evidence is that AI is accelerating and scaling parts of the attack lifecycle while conventional vulnerabilities, credentials and access-control weaknesses remain the underlying path to compromise.
What Data Is Compromised in Breaches?
There is no defensible single global ranking of “most stolen data types.” The mix changes by region, industry and breach pattern, and categories can overlap. Verizon’s 2026 regional table illustrates that variation.
| Region in Verizon 2026 DBIR | Selected data categories reported in breaches | Important caveat |
|---|---|---|
| Asia-Pacific | Internal 70%; credentials 36%; secrets 30% | Categories overlap and describe Verizon’s regional corpus. |
| EMEA | Internal 73%; personal 34%; secrets 24% | Not a population-wide prevalence estimate. |
| Northern America | Internal 77%; credentials 36%; personal 9% | Regional DBIR data, not national regulator data. |
Company disclosures also use different units. Qantas reported customer records, Aflac reported individuals, and Coupang reporting distinguishes accounts accessed from data retained by the perpetrator. Converting all of those into one “records exposed” total would manufacture precision that the source data does not support.
Data Breach Statistics by Industry
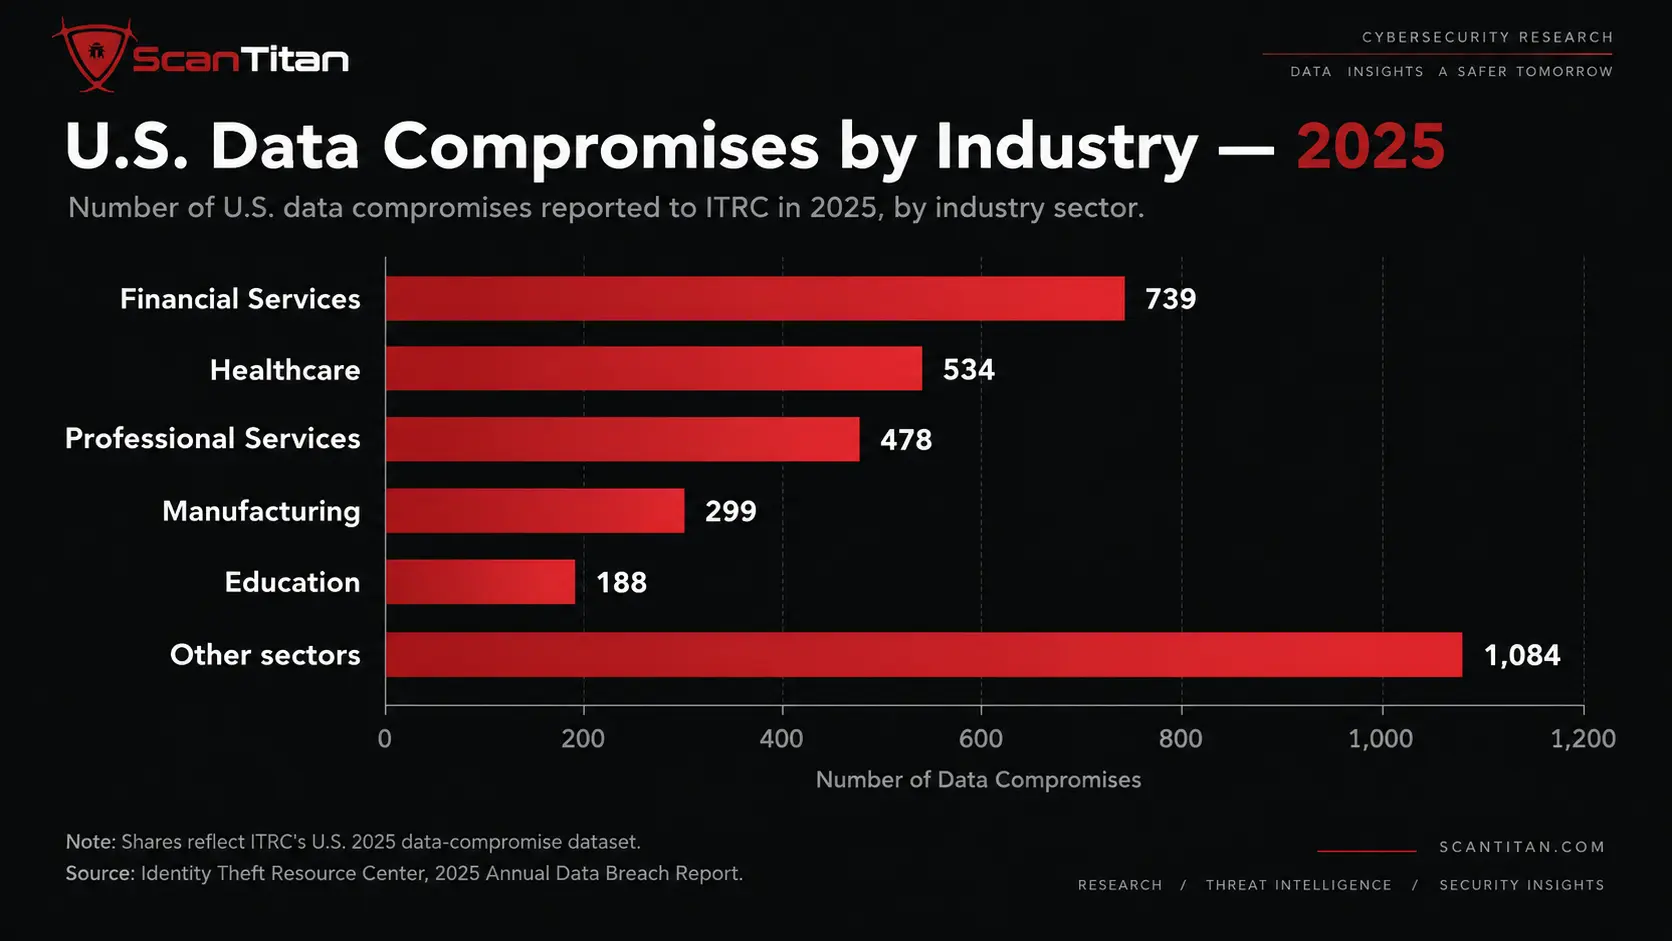
Industry rankings are only meaningful inside one dataset. In ITRC’s U.S. 2025 compromise dataset, financial services led the count, followed by healthcare and professional services. Verizon’s industry snapshots tell a different but complementary story because they analyze contributed confirmed breaches rather than U.S. public breach reports.
Financial Services
ITRC recorded 739 financial-services compromises in 2025, about 22.2% of its 3,322 U.S. events by derived calculation. IBM’s 2026 analysis places average financial-services breach cost at about $6.3 million, showing why frequency and financial impact should be tracked separately.
For a deeper sector-specific breakdown of breach frequency, costs, initial access vectors, third-party exposure and major incidents, see ScanTitan’s Financial Data Breach Statistics research.
Healthcare
ITRC recorded 534 U.S. healthcare compromises in 2025. IBM put the average healthcare breach cost at $6.64 million in 2026. The U.S. HHS Office for Civil Rights maintains a separate HIPAA breach portal for breaches of unsecured protected health information affecting 500 or more individuals, which means healthcare also has a sector-specific statutory reporting layer that should not be merged with ITRC counts.
HHS’s 2024 report to Congress recorded 663 large HIPAA breach notifications affecting approximately 242.9 million individuals, with hacking the most reported category. That is a 2024 regulatory benchmark, not a 2026 count, Healthcare also has its own statutory breach-reporting layer through HHS OCR. For the deeper breakdown of annual filings, affected individuals, breach causes, business associates, costs, and major incidents, see ScanTitan’s healthcare data breach statistics research.
Professional and Legal Services
Professional services accounted for 478 ITRC compromises in 2025. Australia’s regulator separately recorded 81 notifications across legal, accounting and management services in 2025. Neither figure is a global law-firm breach rate, so a dedicated “law firm breach percentage” should not be invented from them.
Manufacturing
ITRC recorded 299 U.S. manufacturing compromises in 2025. Verizon’s 2026 manufacturing snapshot analyzed 2,713 breaches with confirmed data disclosure; exploitation of vulnerabilities represented 38% of initial access, third parties were involved in 61%, and ransomware appeared in 61% of breaches. Those Verizon percentages apply to its manufacturing corpus, not all manufacturers worldwide.
Retail and E-Commerce
Verizon’s 2026 retail snapshot analyzed 806 breaches with confirmed data disclosure. Exploitation of vulnerabilities represented 42% of initial access, third parties were involved in 68%, and internal corporate data appeared in 84% of breaches. Retail’s threat profile therefore extends well beyond payment-card theft to credentials, internal data, ransomware and third-party systems.
For a deeper sector-specific breakdown of breach frequency, initial access vectors,third-party exposure, compromised data, ransomware and major incidents, see our Retail Data Breach Statistics research.
Education
ITRC recorded 188 education compromises in its 2025 U.S. dataset. Australia’s 2025 NDB statistics recorded 81 education notifications. These are different systems and should not be added or ranked against each other.
Small Business
Current public datasets do not support a universal percentage saying how many SMBs are breached each year. The better approach is to use dataset-specific SMB findings and reject the widely repeated “60% close within six months” claim, which the National Cybersecurity Alliance says it cannot verify. ScanTitan’s dedicated Small Business Cybersecurity Statistics 2026 page covers SMB-specific surveys and breach patterns without forcing them into this broader research.
Data Breach Statistics by Country and Region
Regional figures are useful when their reporting systems stay visible. They are not suitable for a “most breached country” ranking because legal thresholds, organizational coverage, survey design and notification rules differ.
| Region | Current metric | Figure | Period | What it measures |
|---|---|---|---|---|
| United States | ITRC data compromises | 3,322 | 2025 | Publicly reported U.S. compromises in ITRC tracking. |
| United States | ITRC compromises / victim notices | 1,803 / 471.2M | H1 2026 | Partial-year compromise events and notifications. |
| Australia | Notifiable Data Breaches notifications | 1,205 | 2025 | Notifications under Australia’s statutory NDB scheme. |
| Canada | Federal + private-sector breach reports | 1,147 | FY2025–26 | Reports to the federal privacy commissioner. |
| Canada | Accounts affected | 20.38M | FY2025–26 | Account count, not necessarily unique individuals. |
| United Kingdom | Businesses reporting a cyber breach or attack | 43% | 2025/2026 survey | Survey prevalence, not confirmed data breaches only. |
| Global / multinational | Confirmed breaches in Verizon’s 2025 DBIR corpus | 12,195 | Nov 2023–Oct 2024 underlying period | Contributed analytical corpus, not a global census. |
United States
ITRC’s 3,322 compromises in 2025 set a new annual record in its dataset. H1 2026 then produced 1,803 compromises and 471.2 million victim notices. These are public breach-tracking figures, not a statutory federal census.
Australia
OAIC received 1,205 Notifiable Data Breaches notifications in 2025, up 8% from 2024. Malicious or criminal activity accounted for 716 notifications, and health service providers were the most commonly affected sector at 225 notifications.
Canada
Canada’s federal privacy commissioner received 1,147 breach reports in FY2025–26 affecting 20,376,654 Canadian accounts. The number of reports fell from the prior fiscal year while affected accounts rose slightly, another example of event frequency and impact moving in different directions.
United Kingdom
The U.K. Cyber Security Breaches Survey 2025/2026 found that 43% of businesses and 28% of charities reported experiencing some kind of cyber security breach or attack in the prior 12 months. This is a survey of identified breaches and attacks, not a count of confirmed personal-data disclosures, so it belongs beside—not inside—regulator breach-notification totals.
Largest Verified Data Breaches of 2025–2026
Large breach lists are useful only when the status of each number is clear. The table below prioritizes company filings and regulator findings rather than attacker claims.
| Organization | Scale reported | What the source actually confirms | Primary source |
|---|---|---|---|
| Aflac | About 22.65M individuals | Unauthorized network access; later SEC disclosure supplied the affected-person count. The filing did not characterize the incident as ransomware. | SEC filing |
| Qantas | About 5.67M customer records | OAIC’s later inquiry refined the earlier public estimate and tied the incident to a third-party contact-center environment and social engineering. | OAIC inquiry |
| TransUnion | More than 4.4M people | Unauthorized access to a third-party application supporting U.S. consumer operations. | Michigan Attorney General |
| Coupang | Company: ~33M accounts; regulator: ~37.5M users | The company and regulator use different units and scope. Both figures should remain visible rather than silently choosing the larger one. | Korean PIPC |
| Coinbase | Not quantified in the cited filing | The SEC filing describes malicious insider / contractor-assisted collection of customer information and extortion. | SEC Form 8-K |
| DaVita | No final person count in the cited filing | Ransomware affected parts of the network and later investigation confirmed PII/PHI exfiltration. | SEC filing |
Tracker-Reported H1 2026 Mega-Events
ITRC’s H1 2026 reporting identified very large notification events including Under Armour at 72.7 million, SoundCloud at 29.8 million, CarGurus at 12.5 million, Panera at 5.1 million and QualDerm at 3.1 million. These are useful tracker figures, but they should be cited as ITRC-reported affected/notification counts unless the organization or regulator independently confirms the same unit and scope.
Reporting Rules Shape Data Breach Statistics
HIPAA Creates a Healthcare-Specific Reporting Dataset
The U.S. Department of Health and Human Services publishes breaches of unsecured protected health information affecting 500 or more individuals through its OCR portal. That statutory threshold is one reason healthcare counts from HHS should not be merged with ITRC’s broader breach-tracker totals.
Australia and Canada Apply Different Legal Thresholds
Australia’s NDB scheme focuses on covered entities and breaches likely to result in serious harm. Canada’s Privacy Act and PIPEDA reporting regimes use their own criteria, including real risk of significant harm in the private sector. A difference in report volume can therefore reflect legal and reporting architecture as much as attacker activity.
The U.K. Survey Measures Experience, Not a Confirmed-Breach Census
The U.K. Cyber Security Breaches Survey asks organizations whether they identified breaches or attacks. That is valuable prevalence data, but it includes events that would not necessarily qualify as a confirmed data breach or reportable personal-data incident.
Data Breach Statistics You Should Stop Quoting Without Context
| Claim | Verdict | What the evidence supports instead |
|---|---|---|
| “95% of data breaches are caused by human error.” | Outdated / misquoted / dataset-specific | Modern datasets distinguish social engineering, credential abuse, privilege misuse, errors and other human-element categories. Do not turn them into one universal error percentage. |
| “60% of small businesses close within six months of a cyberattack.” | Unverifiable | The National Cybersecurity Alliance says it did not generate the statistic, cannot verify the source and does not recommend continued use. |
| “The average data breach costs $4.88M in 2026.” | Outdated | $4.88M is IBM’s 2024 global mean. IBM reported $4.44M in 2025 and $4.99M in 2026. |
| “90% of data breaches start with phishing.” | Unsupported as a universal current statistic | Verizon’s 2026 DBIR puts vulnerability exploitation first at 31%; Mandiant found email phishing at 6% and vishing at 11% of its 2025 initial infection vectors. |
| “A cyberattack happens every 39 seconds.” | Historical study, not a current global counter | The original University of Maryland study dates to 2007 and observed automated attacks against four Linux computers. |
| “16 billion credentials leaked = one of the biggest data breaches ever.” | Misclassified | Large credential compilations can combine multiple datasets, infostealer logs and duplicates. They should not automatically be described as one breach. |
| “Data breaches increase every year.” | Too simplistic | Event counts, notification counts, affected people and breach costs do not move in lockstep. 2025 U.S. compromise counts rose while victim notices fell sharply before rebounding in H1 2026. |
What the 2026 Data Actually Means
Vulnerability exploitation is the strongest current entry-point signal. Verizon and Mandiant independently place exploitation at roughly one-third of their latest breach or intrusion datasets. For organizations managing internet-facing systems, that strengthens the case for continuous discovery and faster prioritization of exploitable findings rather than waiting for a quarterly patch cycle.
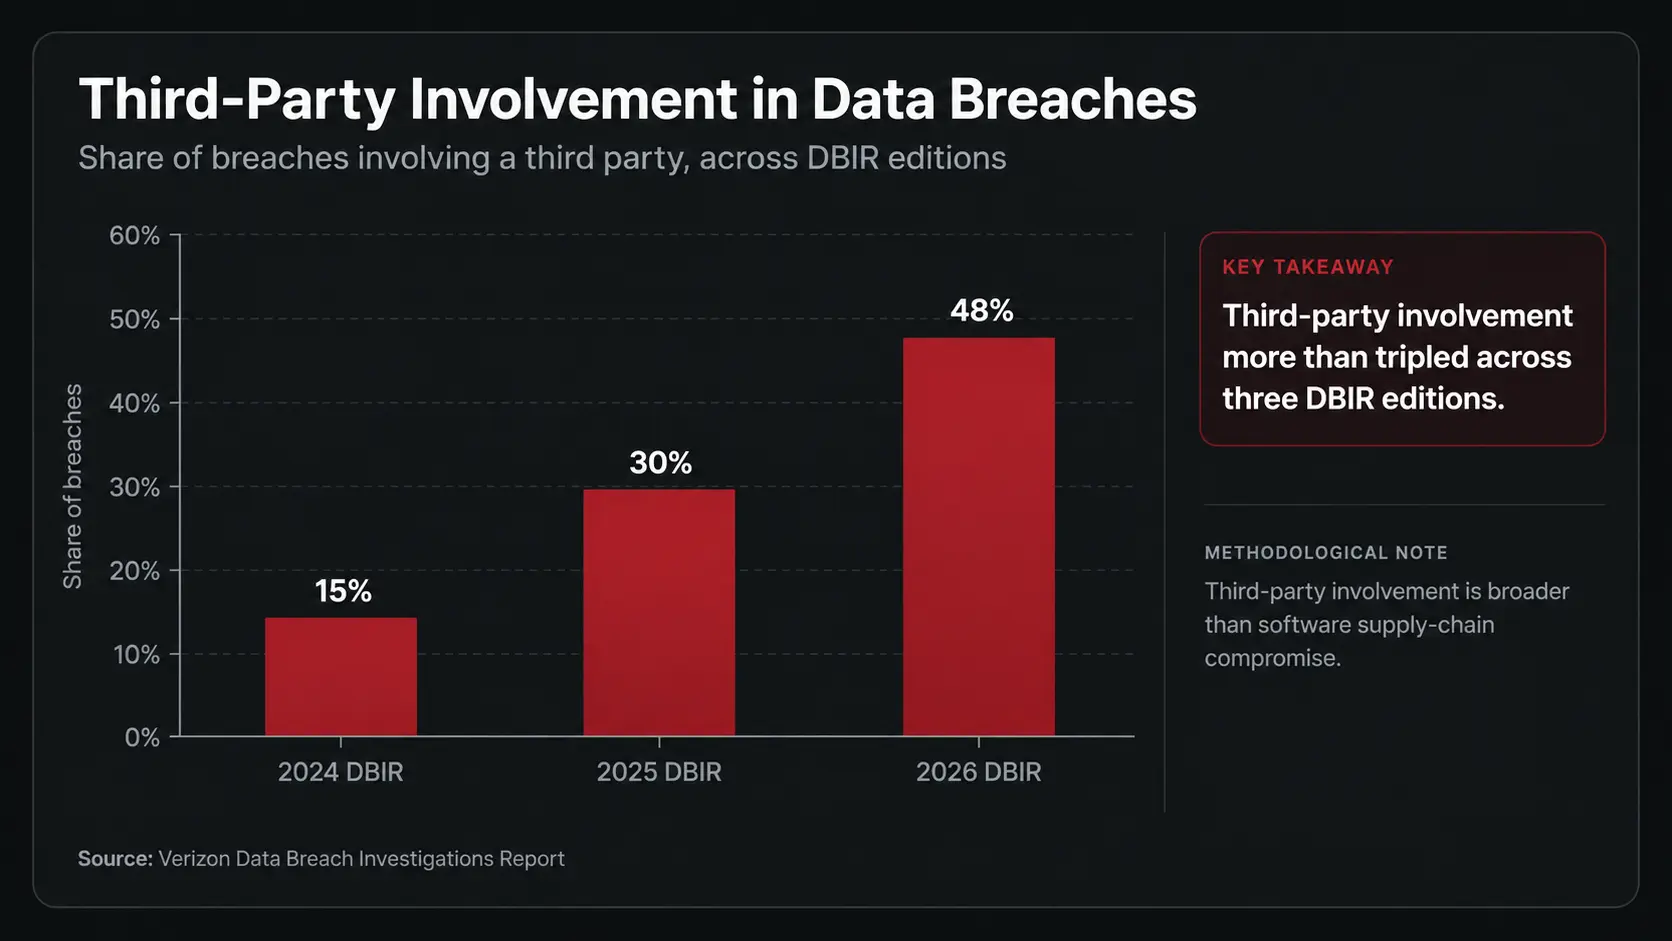
Third-party exposure is no longer a side issue. Verizon’s third-party involvement measure moved from 15% to 30% to 48% across three DBIR editions, while ITRC’s H1 2026 supply-chain data shows how a small number of originating breaches can produce hundreds of millions of downstream notices.
Breach impact cannot be inferred from breach count alone. H1 2026 produced fewer U.S. compromise events than a full year by definition, yet already generated more victim notices than all of 2025 because a few mega-events dominated the impact.
AI is changing breach economics and speed, but conventional weaknesses still matter. IBM’s AI-enabled breach findings are important, yet Mandiant and Verizon still point back to software flaws, credentials, third parties and social engineering. AI increasingly acts as an accelerator around familiar exposure paths rather than replacing them.
The practical defensive implication is prioritization. When exploitation is rising and disclosure-to-exploitation windows are shrinking, the useful question is not how many vulnerabilities exist but which reachable weaknesses have credible exploitation evidence and business impact. ScanTitan’s guide to vulnerability remediation prioritization explains how to combine exploitation evidence, exposure and asset context, while continuous vulnerability scanning reduces the time between a new exposure and the moment the team knows it applies.
Primary Sources and Research Notes
The final article prioritizes primary-source datasets, regulators and company filings. Competitor pages were used to identify coverage expectations and weakly sourced claims, but not as the evidentiary layer when the original source was available.
| Source | Period / edition | Used for |
|---|---|---|
| Verizon 2026 DBIR | 2026 edition; underlying incidents largely Nov 2024–Oct 2025 | Vulnerability exploitation, ransomware, third parties, regional and industry context. |
| IBM Cost of a Data Breach 2026 | Breaches Mar 2025–Feb 2026; 602 organizations | Global, U.S. and healthcare costs; AI-enabled breaches; automation savings. |
| Mandiant M-Trends 2026 | 2025 investigations | Initial infection vectors, dwell time, internal detection, industry mix. |
| ITRC 2025 Annual Data Breach Report | Calendar 2025 | U.S. compromise counts, victim notices, sectors and transparency. |
| ITRC H1 2026 Data Breach Report | Jan–Jun 2026 | 1,803 compromises, 471.2M notices, insider events, supply-chain impact and attack-vector disclosure rate. |
| OAIC 2025 NDB Statistics | Calendar 2025 | Australian notifications, cause and sector distribution. |
| Office of the Privacy Commissioner of Canada 2025–2026 Annual Report | FY2025–26 | Canadian breach reports, affected accounts and reporting context. |
| U.K. Cyber Security Breaches Survey 2025/2026 | 2025/2026 survey | Organization-reported breach/attack prevalence and survey limitations. |
| HHS OCR Breach Portal | Ongoing | HIPAA breaches affecting 500 or more individuals. |
| National Cybersecurity Alliance myth correction | 2022 statement | Verification failure of the “60% of SMBs close” claim. |
| University of Maryland 39-second study | 2007 experiment | Original context for the heavily recycled “attack every 39 seconds” claim. |
Frequently Asked Questions
How many data breaches happened in 2025?
There is no authoritative worldwide total. In the United States, ITRC tracked 3,322 data compromises in 2025. Verizon analyzed a multinational breach corpus, while regulators in Australia, Canada and other jurisdictions publish separate notification totals under different rules.
How many data breaches have happened in 2026?
No source provides a defensible global YTD total. ITRC tracked 1,803 U.S. compromises in H1 2026. That is a partial-year U.S. tracker figure, not a worldwide breach count.
What is the average cost of a data breach in 2026?
IBM’s 2026 Cost of a Data Breach report puts the global average at $4.99 million across 602 breached organizations. The U.S. average was $11.5 million and healthcare averaged $6.64 million.
What is the most common cause of data breaches?
There is no single global cause ranking. In Verizon’s 2026 DBIR, vulnerability exploitation became the leading breach entry point at 31%. Mandiant independently found exploitation in 32% of its 2025 incident-response investigations.
What percentage of breaches involve third parties?
Third parties were involved in 48% of breaches in Verizon’s 2026 DBIR, up from 30% in the prior edition and 15% in the 2024 edition. This includes more than software supply-chain compromise alone.
Which industry has the most data breaches?
The answer depends on the dataset. Financial services led ITRC’s U.S. 2025 compromise count with 739 events, while other datasets use different populations and industry taxonomies. A global industry ranking would not be methodologically defensible.
How long does it take to detect and contain a data breach?
IBM’s current 2026 guidance cites an average 247 days to identify and contain a breach. Mandiant reports a 14-day global median dwell time in its 2025 investigations. These measure different parts of the incident lifecycle and should not be treated as the same metric.
Are most data breaches caused by human error?
No current authoritative source supports a universal “95% of breaches are caused by human error” claim. Modern datasets separate errors, social engineering, credential abuse, privilege misuse, insider activity and technical exploitation rather than combining them into one universal percentage.
Is a cyberattack the same as a data breach?
No. A cyberattack can disrupt a system without exposing data. A data breach specifically involves unauthorized access, acquisition or disclosure of protected or sensitive information under the applicable dataset or legal definition.