Financial Data Breaches in 2026
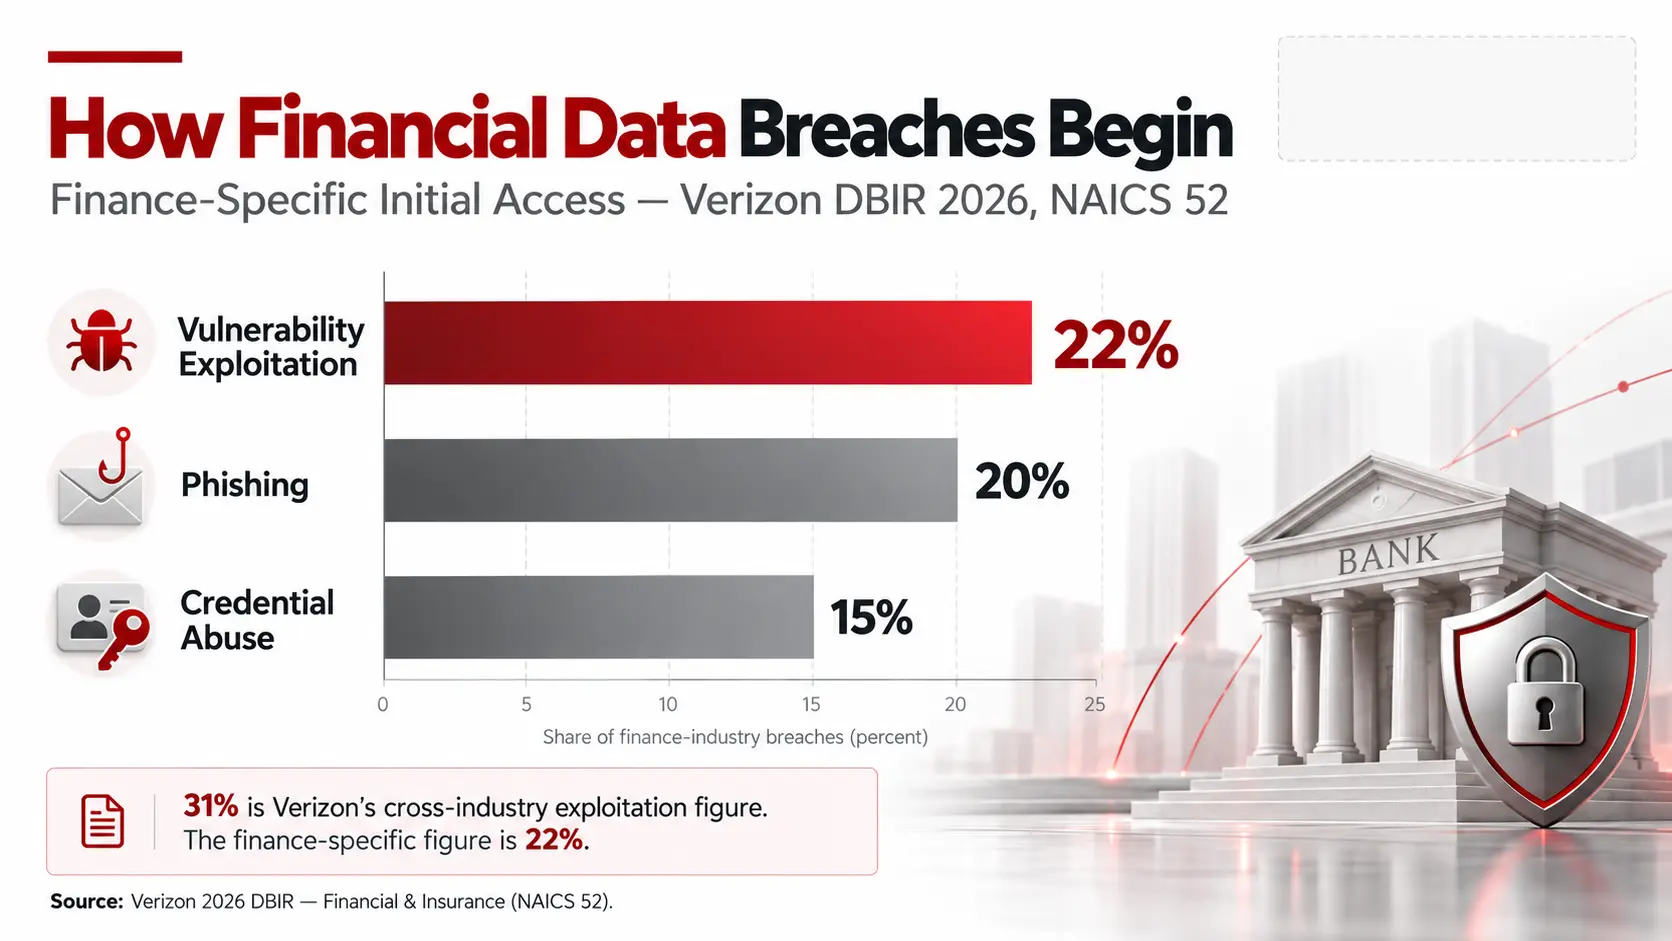
Financial and insurance organizations accounted for 3,809 security incidents and 1,300 confirmed data breaches in the Verizon 2026 Data Breach Investigations Report. Within the finance-specific dataset, exploitation of vulnerabilities accounted for 22% of known initial access, phishing for 20%, and credential abuse for 15%.
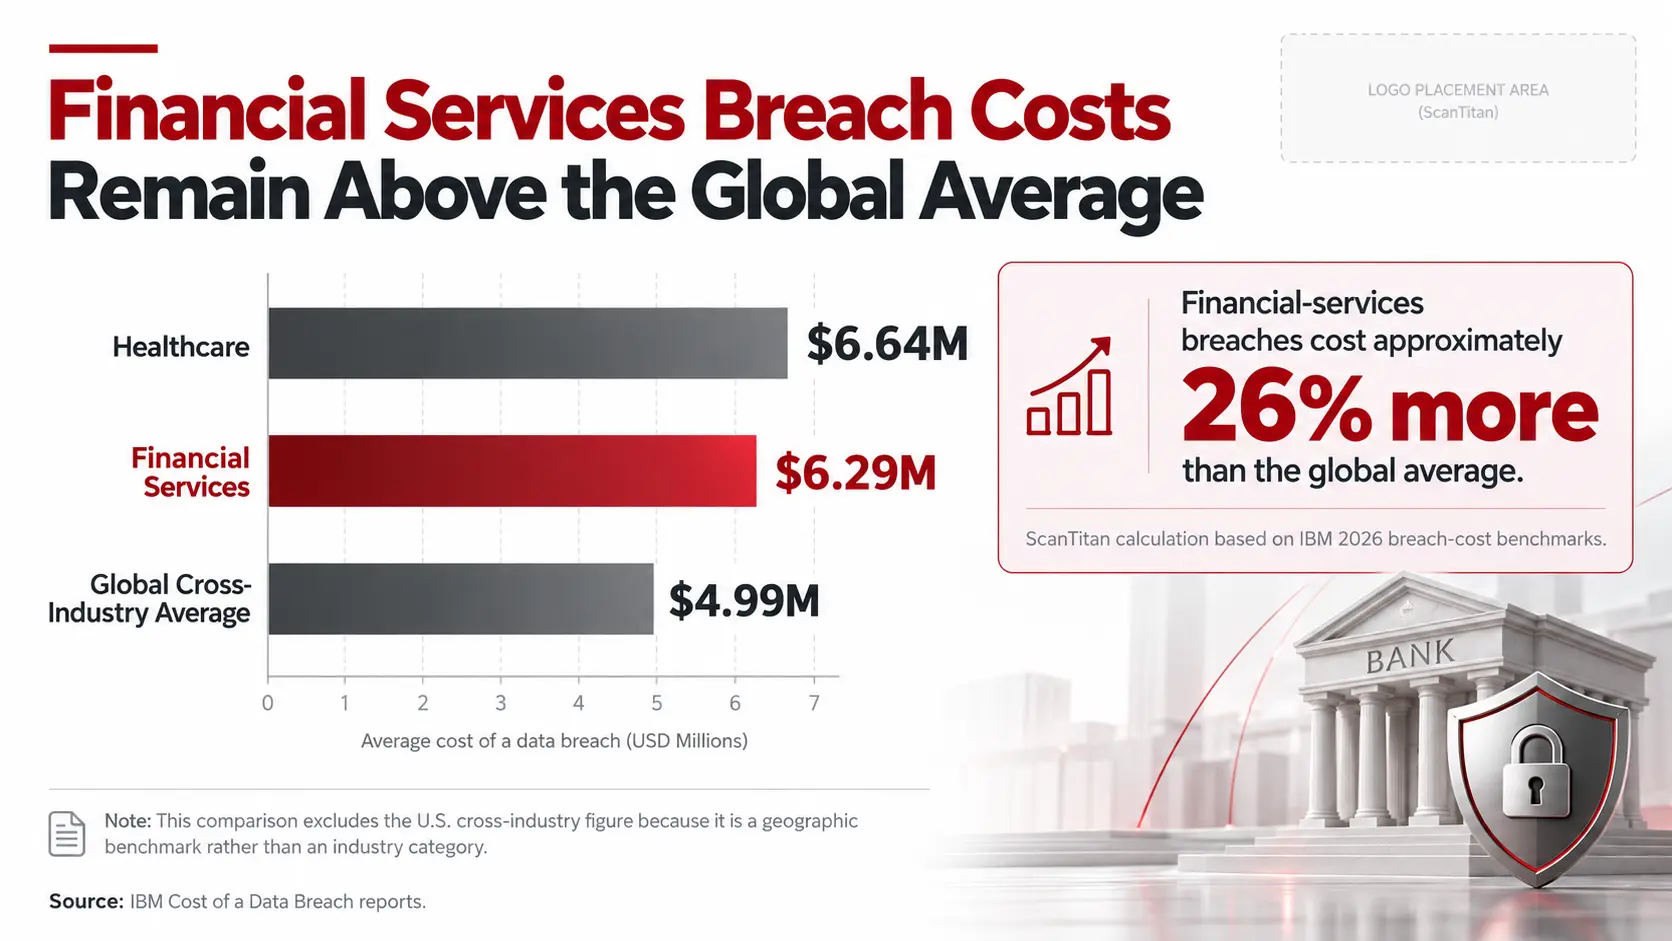
The financial impact is also unusually high. IBM’s 2026 Cost of a Data Breach research places the average financial-services breach at approximately $6.29 million, compared with a $4.99 million global cross-industry average. Based on those figures, financial-services breaches cost roughly 26% more than the global average.
U.S. disclosure data provides another perspective. The Identity Theft Resource Center recorded 387 financial-services data compromises in the first half of 2026, after recording 739 in full-year 2025.
Those numbers should not be added together. Verizon, IBM and ITRC measure different populations, use different methodologies and answer different questions. This same measurement problem appears across broader data breach statistics, where incidents, confirmed breaches, affected organizations, victim notices and exposed records must be kept separate.
Key Financial Data Breach Statistics for 2026
| Metric | Latest Finding | Scope |
|---|---|---|
| Average financial-services breach cost | $6.29 million | IBM 2026 global study |
| Global average breach cost | $4.99 million | IBM 2026, all industries |
| Financial-sector cost premium | ~26% | ScanTitan calculation from IBM benchmarks |
| Financial & insurance security incidents | 3,809 | Verizon 2026 DBIR, NAICS 52 |
| Confirmed financial & insurance breaches | 1,300 | Verizon 2026 DBIR, NAICS 52 |
| Top three breach patterns | 81% | Financial & Insurance breaches |
| Vulnerability exploitation | 22% | Finance-specific initial access |
| Phishing | 20% | Finance-specific initial access |
| Credential abuse | 15% | Finance-specific initial access |
| Human element involvement | 65% | Financial & Insurance breaches |
| Third-party involvement | 34% | Financial & Insurance breaches |
| External threat actors | 88% | Financial & Insurance breaches |
| Financially motivated breaches | 98% | Financial & Insurance breaches |
| U.S. financial-services compromises | 387 in H1 2026 | ITRC publicly reported U.S. compromises |
The scope column is essential. Verizon analyzes a contributed incident corpus, IBM measures breach economics, and ITRC tracks publicly reported U.S. compromises. ScanTitan applies the same source-separation approach in its broader Cybersecurity Statistics 2026 research, because attack telemetry, breach counts and financial losses are not interchangeable datasets.
How Many Financial Data Breaches Occur?
No single database captures every financial-services data breach worldwide. The most useful current benchmarks therefore come from multiple datasets.
The Identity Theft Resource Center recorded 739 financial-services data compromises in the United States during 2025, making financial services the largest industry category in its 2025 Annual Data Breach Report.
Another 387 financial-services compromises were recorded during the first half of 2026. Across all U.S. sectors, ITRC tracked 1,803 publicly reported compromises during that six-month period.
The 387 H1 figure should not simply be doubled to predict a full-year total. Breach activity is uneven, major supply-chain incidents can cause temporary spikes, and disclosure timing varies considerably.
For comparison, the U.S. healthcare sector operates under a different reporting system centered on HHS OCR. ScanTitan’s Healthcare Data Breach Statistics research shows why sector-specific disclosure systems should not be treated as directly comparable national breach censuses.
There is also a major transparency limitation: only 24% of H1 2026 breach notices disclosed the attack vector. Researchers can therefore count many public compromises without knowing how the attacker initially entered the affected environment.
How Much Does a Financial Services Data Breach Cost?
According to the IBM Cost of a Data Breach Report 2026, the average financial-services data breach cost approximately $6.29 million. The global cross-industry average was $4.99 million.
Using those benchmarks:
($6.29M − $4.99M) ÷ $4.99M × 100 = approximately 26.1%
Financial-services breaches therefore cost approximately 26% more than the global average in IBM’s 2026 research. This percentage is a ScanTitan calculation based on IBM’s published benchmarks rather than an IBM-published percentage.
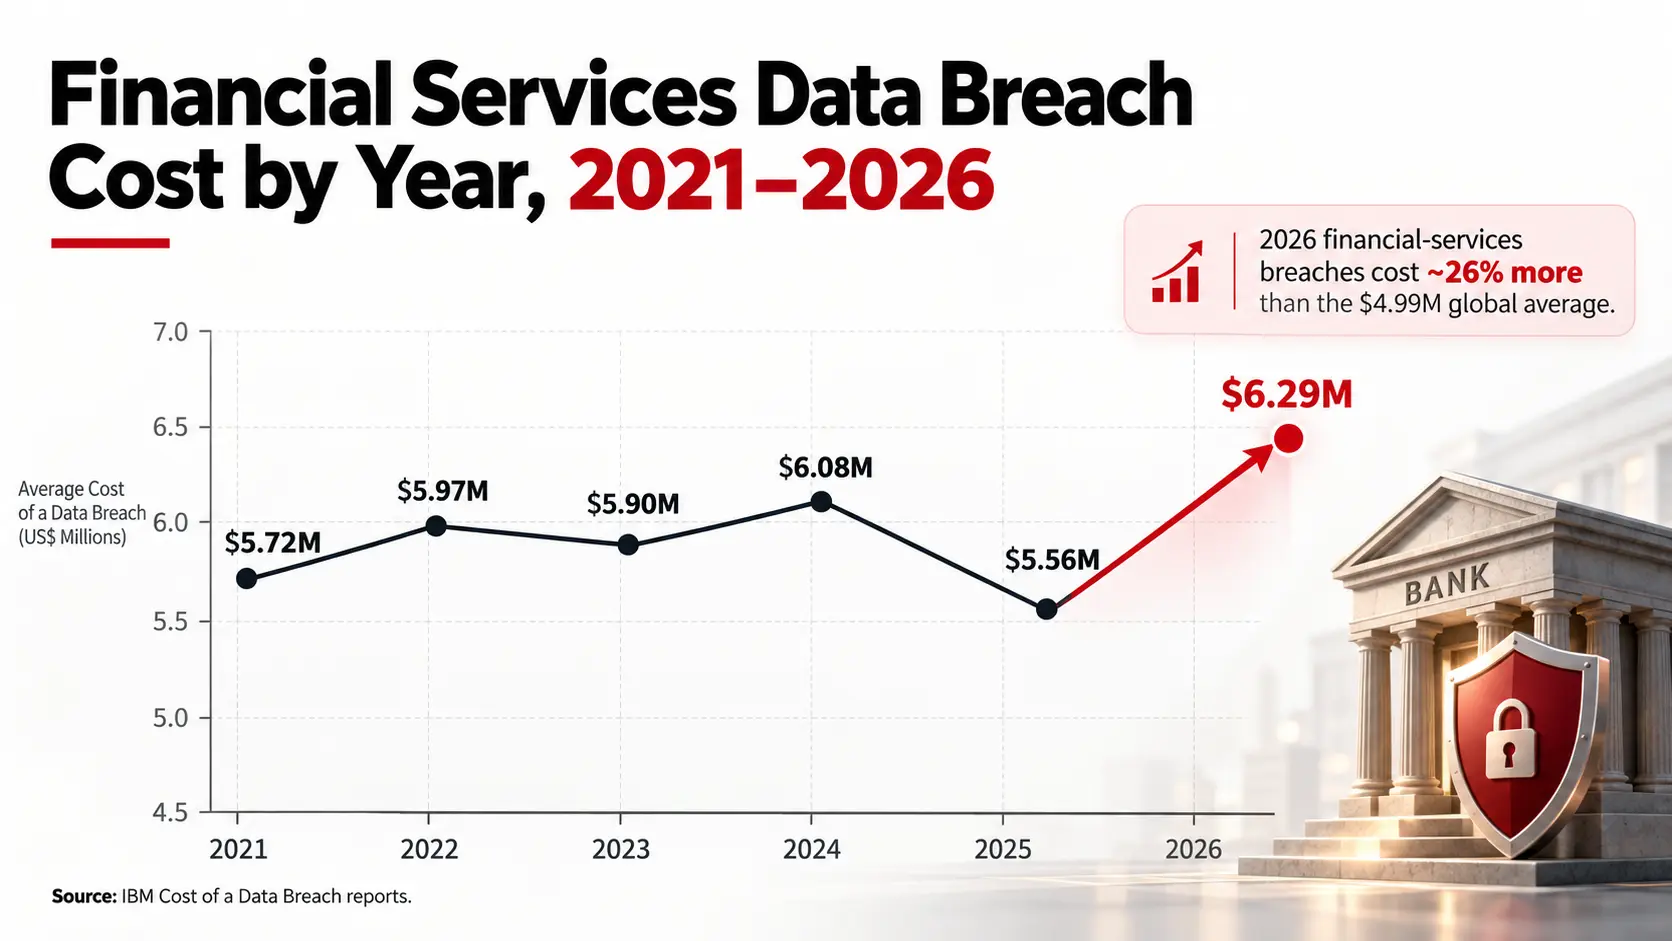
Financial Services Data Breach Cost by Year
| IBM Report Year | Average Financial-Sector Breach Cost | Change vs Previous Year |
|---|---|---|
| 2021 | $5.72 million | — |
| 2022 | $5.97 million | Increase |
| 2023 | $5.90 million | Slight decrease |
| 2024 | $6.08 million | Increase |
| 2025 | $5.56 million | Decrease |
| 2026 | $6.29 million | Strong increase |
IBM’s financial-industry breach analysis documents the earlier cost trajectory, including the $6.08 million financial-sector benchmark reported in 2024.
The time series also explains why many pages labeled “2026 financial cybersecurity statistics” still cite $5.56 million. That figure belongs to IBM’s 2025 reporting cycle, while the 2026 financial-services benchmark increased to approximately $6.29 million.
Why Financial Breach Costs Remain High
The total cost of a breach is broader than stolen funds or a ransom payment. Depending on the incident, financial institutions may incur investigation, recovery, notification, legal, regulatory, customer-support, business-interruption and remediation costs.
This is why an IBM breach-cost benchmark should not be compared directly with FBI cybercrime losses or Business Email Compromise losses. The underlying metrics are fundamentally different.
What Causes Financial Data Breaches?
One of the most common errors in financial cybersecurity content is applying Verizon’s global DBIR percentages directly to the financial sector.
Across Verizon’s broader 2026 DBIR, exploitation of vulnerabilities accounted for 31% of known initial access and credential abuse for 13%. The Financial and Insurance subset produces different numbers.
| Initial Access Vector | Financial-Services Share | Interpretation |
|---|---|---|
| Exploitation of vulnerabilities | 22% | Leading finance-specific initial access vector |
| Phishing | 20% | Close behind vulnerability exploitation |
| Credential abuse | 15% | Still significant, but below exploitation and phishing |
For a financial-sector article, 22% is therefore the appropriate vulnerability-exploitation benchmark—not the 31% figure from Verizon’s full cross-industry breach corpus. The wider growth in disclosed vulnerabilities, exploitability and remediation pressure is examined separately in ScanTitan’s Vulnerability Statistics 2026 research.
For organizations trying to identify exposed application weaknesses before exploitation, automated website vulnerability scanning can help identify known CVEs, security misconfigurations and common application-layer weaknesses, while manual testing remains necessary for business-logic flaws and other issues that automated tools cannot reliably detect.
Three Patterns Account for 81% of Financial Breaches
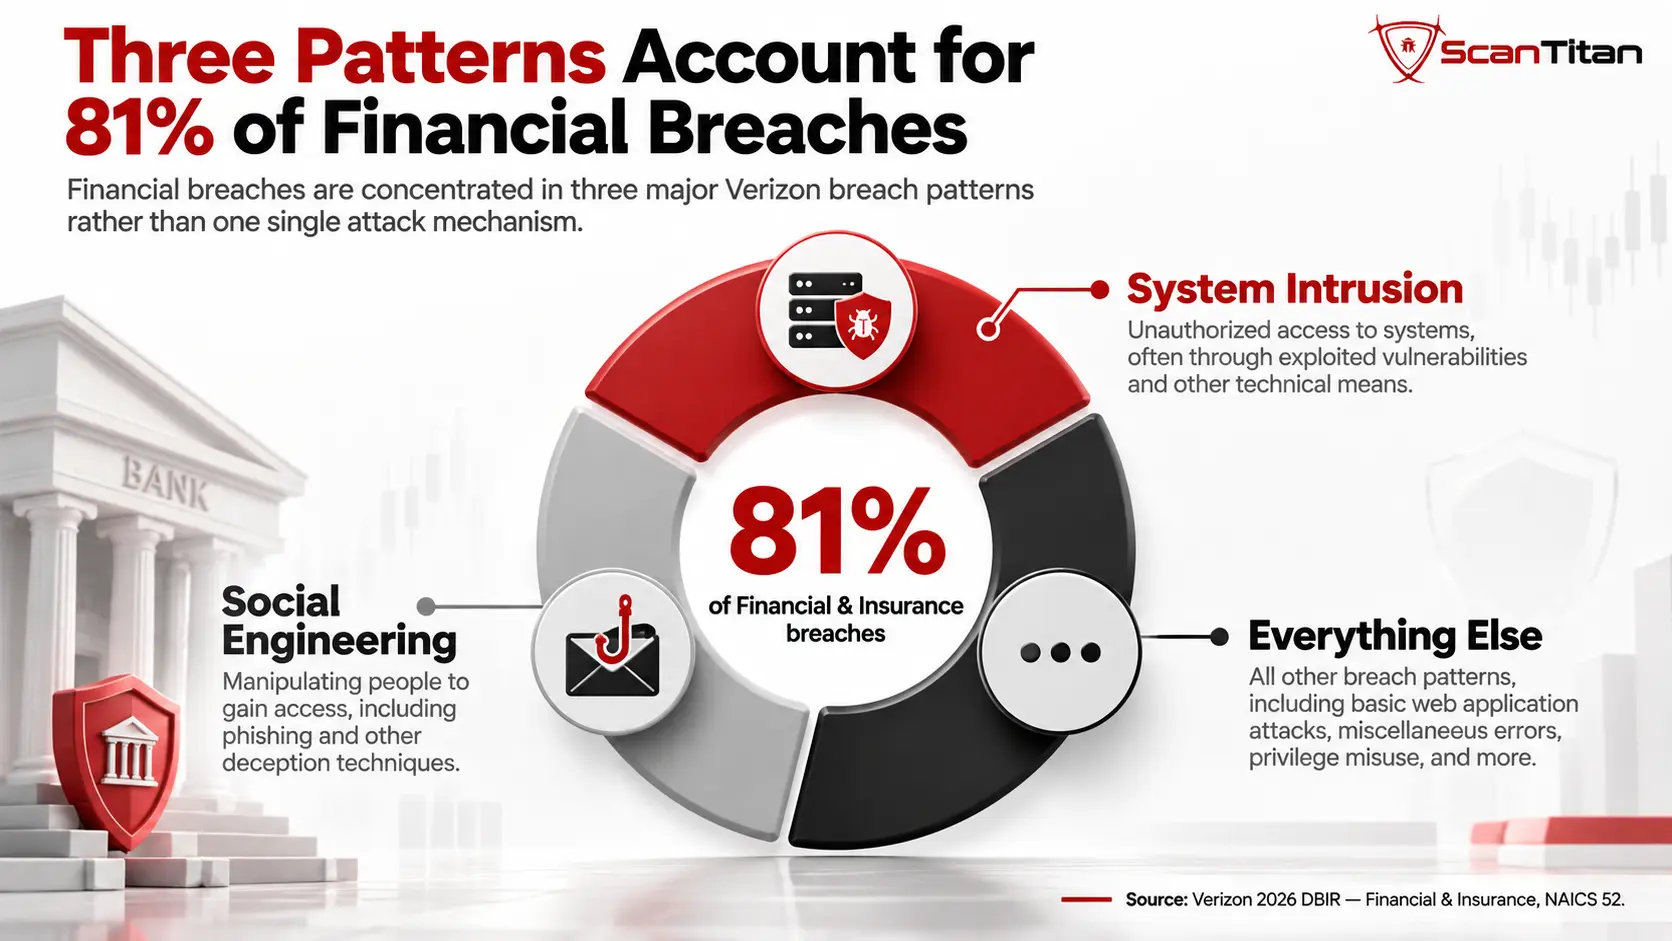
Verizon reports that three breach patterns account for 81% of Financial and Insurance breaches:
- System Intrusion
- Social Engineering
- Everything Else
The concentration demonstrates that financial-sector breaches are not driven by a single mechanism. Technical exploitation, social engineering and a wider range of uncategorized or less common breach paths all contribute materially to the sector’s exposure.
The Human Element Is Involved in 65% of Financial Breaches
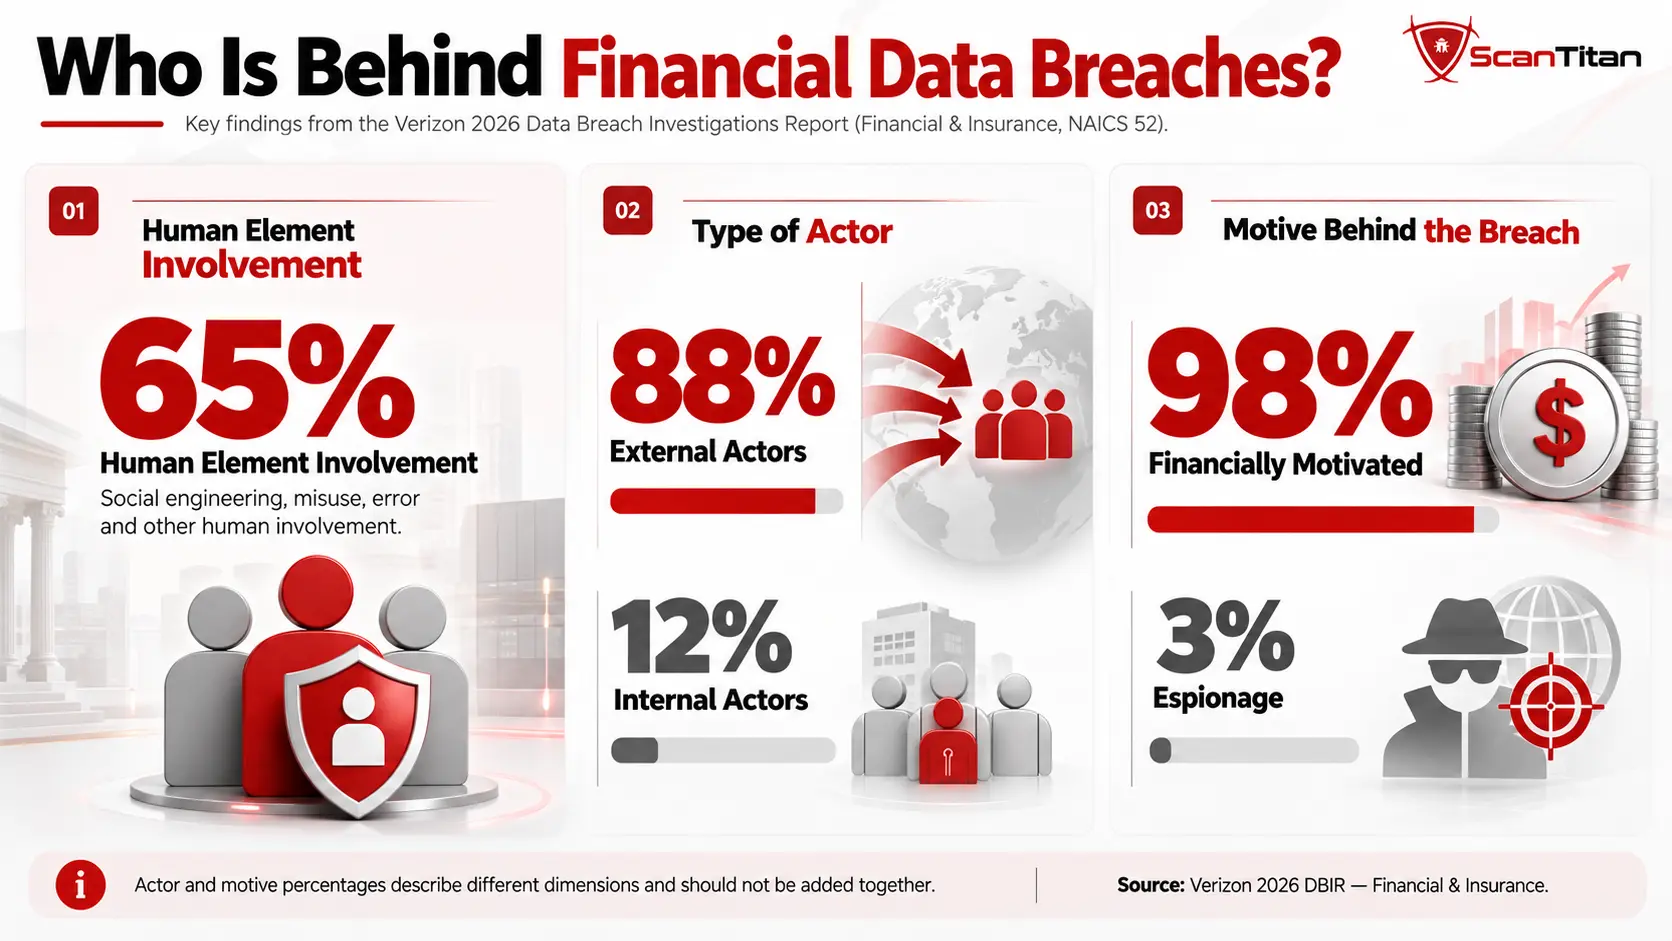
Verizon reports a 65% human-element involvement rate for Financial and Insurance breaches.
The human element is broader than phishing alone. It can include social engineering, misuse of credentials, user error, privilege misuse and other actions involving people.
This is why a 65% human-element figure can coexist with phishing representing 20% of known initial access. One statistic measures a broad characteristic of a breach, while the other measures a specific entry method.
For the broader measurement differences between phishing sites, campaigns, reported losses and confirmed breaches, see ScanTitan’s Phishing Statistics 2026 research.
Who Attacks Financial Institutions and Why?
| Threat Metric | Share |
|---|---|
| External actors | 88% |
| Internal actors | 12% |
| Financial motive | 98% |
| Espionage motive | 3% |
External attackers dominate the sector, and direct financial motivation remains overwhelmingly common.
Actor and motive percentages represent different dimensions of Verizon’s classification framework, so the percentages should not be added together as if they were mutually exclusive categories.
What Data Gets Compromised in Financial Services Breaches?
A financial-services data breach does not automatically mean payment-card information was stolen. Verizon’s finance-specific dataset shows a broader distribution of compromised information.
| Data Type | Share of Financial-Sector Breaches |
|---|---|
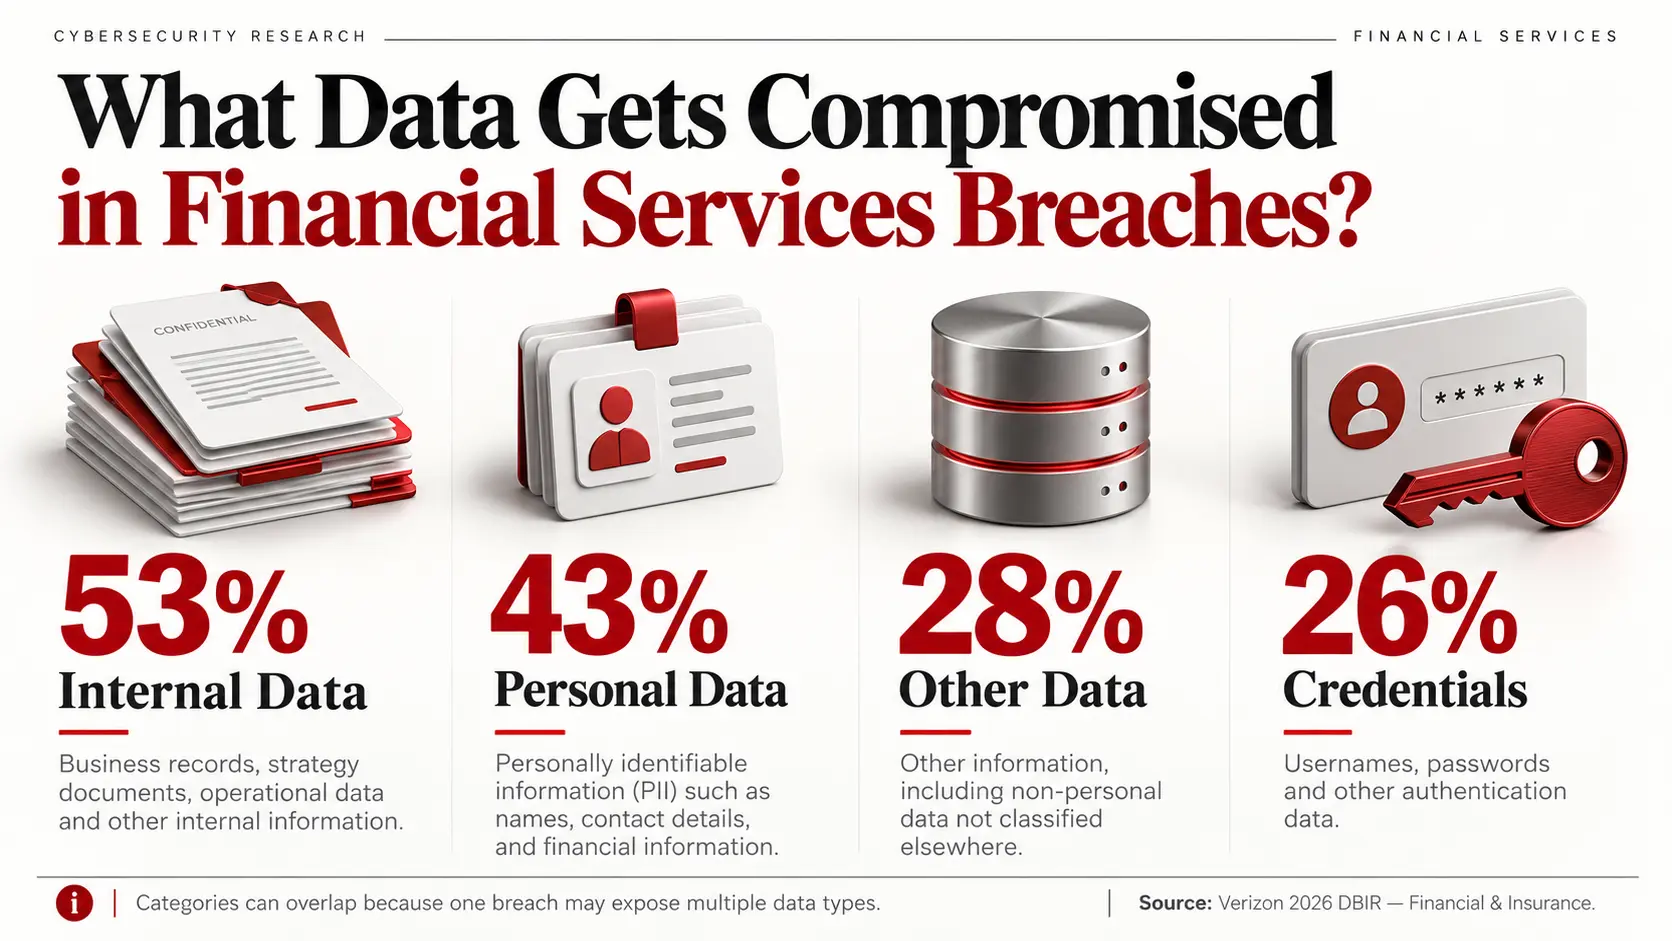
| Internal data | 53% |
| Personal data | 43% |
| Other data | 28% |
| Credentials | 26% |
The categories can overlap because a single breach may expose several types of information.
Financial organizations commonly hold identity records, mortgage documents, tax information, authentication credentials, employee records, transaction information and internal business data. The exact information exposed depends on the breached system and institution.
Third-Party and Supply-Chain Breach Statistics
Third-party compromise has become a structural financial-services risk. Verizon reports third-party involvement in 34% of Financial and Insurance breaches. The broader cross-industry trend and its growth over recent DBIR editions are covered in ScanTitan’s Data Breach Statistics 2026 research.
Vendor breaches also create an important measurement problem because a single upstream intrusion may produce dozens of downstream breach notifications.
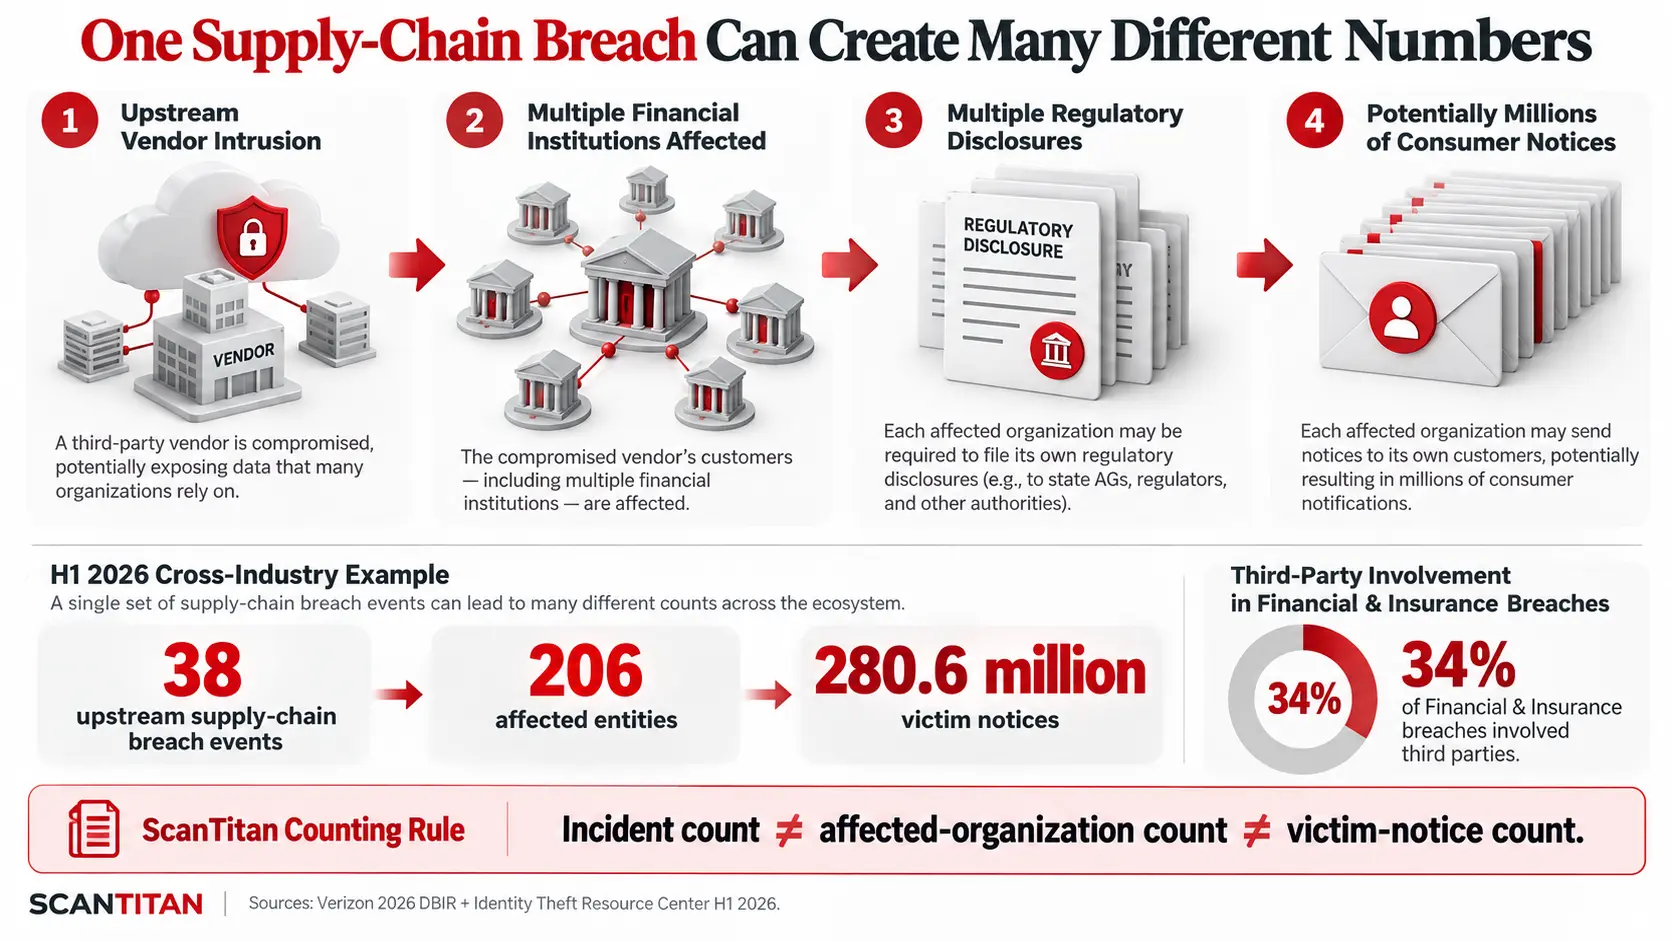
The Downstream Notification Multiplier
Consider a shared financial technology provider compromised by one attacker:
1 vendor intrusion → multiple financial institutions → multiple regulatory disclosures → potentially millions of consumer notices.
Those numbers measure different things and should not be treated as equivalent breach counts.
According to ITRC’s H1 2026 breach research, 38 initial supply-chain breach events affected 206 entities and generated approximately 280.6 million victim notices across industries.
ScanTitan Downstream Deduplication Rule
| Measurement | How It Should Be Counted |
|---|---|
| Upstream intrusion | Count the original vendor compromise as one intrusion when measuring attacker activity. |
| Affected organizations | Count downstream financial institutions separately when measuring organizational impact. |
| Regulatory or consumer notices | Track separately and do not treat each notice as another attacker intrusion. |
Without this distinction, major vendor incidents can significantly distort breach-frequency statistics.
Ransomware Statistics for Financial Services
Verizon reports ransomware in 48% of breaches across its overall 2026 dataset. That figure should not be relabeled as “48% of financial-services breaches.”
For finance-specific ransomware behavior, Sophos’ State of Ransomware in Financial Services provides a separate survey dataset. Its 2025 financial-services research included 369 IT and cybersecurity leaders.
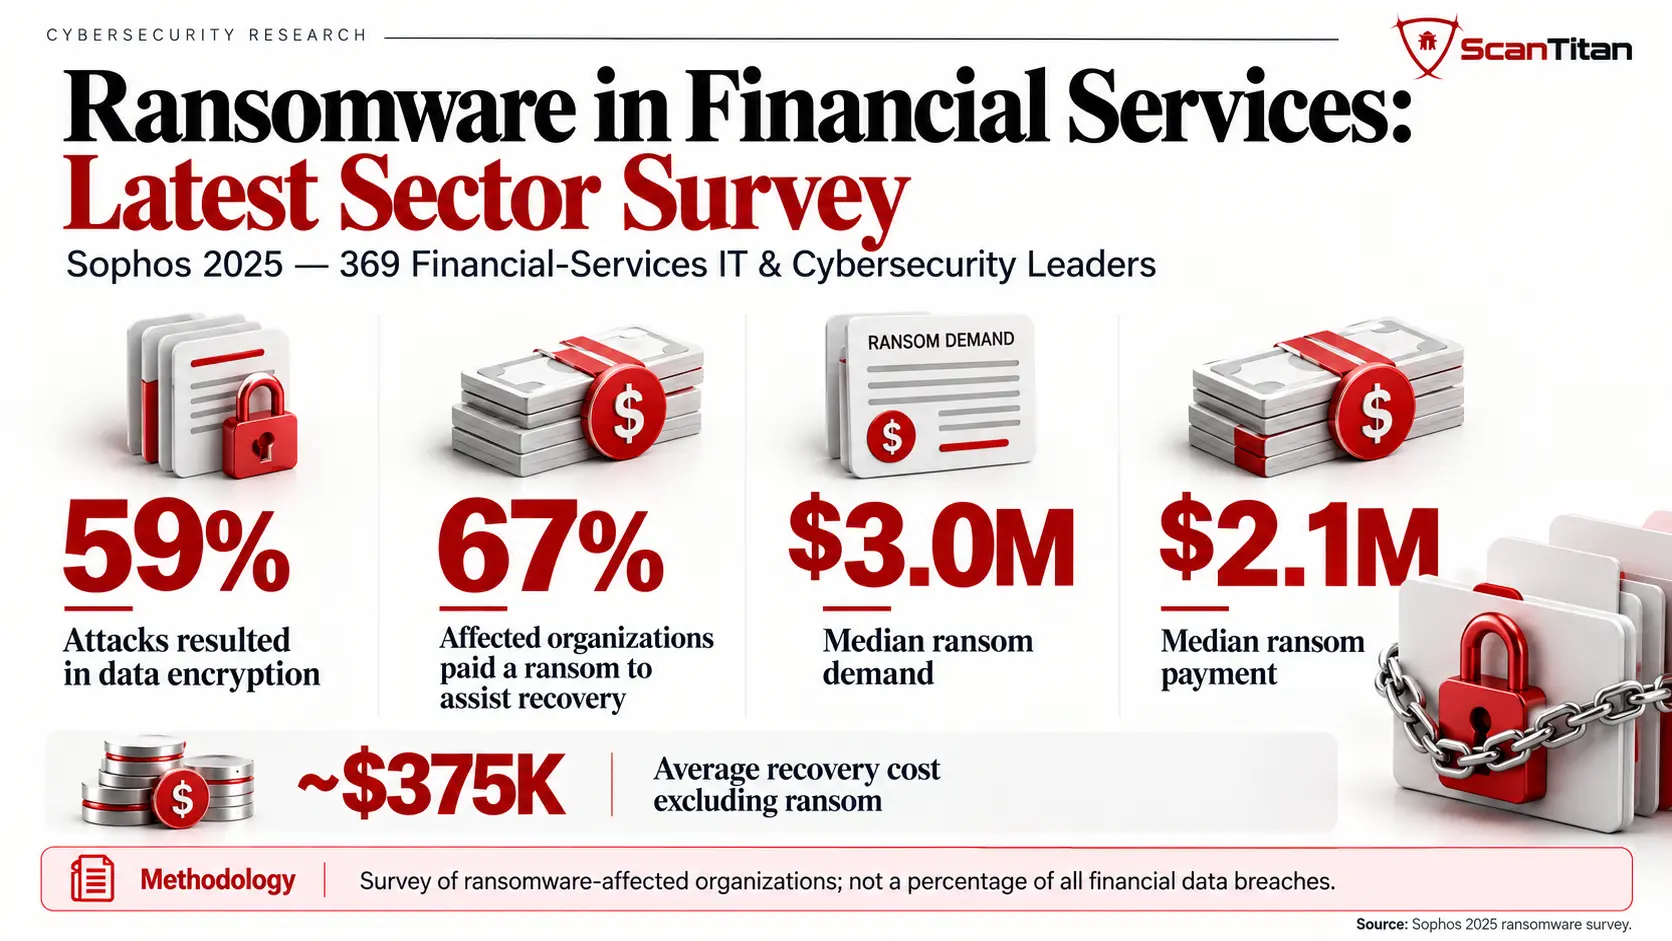
| Ransomware Metric | Financial-Services Finding | Measurement |
|---|---|---|
| Attacks resulting in encrypted data | 59% | Sophos 2025 survey of affected organizations |
| Victims paying ransom to help recover data | 67% | Sophos 2025 survey |
| Median ransom demand | $3 million | Sophos 2025 survey |
| Median ransom payment | $2.1 million | Sophos 2025 survey |
| Average recovery cost excluding ransom | ~$375,000 | Sophos 2025 survey |
These are ransomware survey statistics rather than percentages of all confirmed financial-services data breaches. Keeping the denominator visible prevents survey results from being mistaken for breach-corpus statistics.
For the broader cross-industry attack, encryption, payment and recovery-cost picture, see ScanTitan’s Ransomware Statistics 2026 research.
AI-Enabled Financial Data Breach Trends
IBM’s 2026 breach research found that one in four malicious breaches was AI-enabled, representing a 56% year-over-year increase. AI-enabled breaches averaged approximately $6 million in cost.
IBM also found that organizations making extensive use of AI and automation in security operations reduced breach costs by approximately $1.93 million compared with organizations using none.
Those are cross-industry findings rather than finance-specific cost savings. However, IBM identifies financial services as one of the sectors with a relatively high concentration of AI-driven breach activity.
Unauthorized AI Use Can Also Expose Financial Data
In May 2026, CB Financial Services disclosed a material cybersecurity incident involving customer information handled through an unauthorized AI-based application at its Community Bank subsidiary.
The information included customer names, Social Security numbers and dates of birth. The case demonstrates that AI-related breach risk is not limited to attackers using generative AI. Unsanctioned internal use of AI tools can also create data-governance and exposure risks.
Largest Financial Data Breaches by Measurement Type
Historical financial breach rankings are difficult to interpret because affected counts use different measurement units. A table containing people, documents, payment cards, households and accounts should not rank them as though every number measures the same thing.
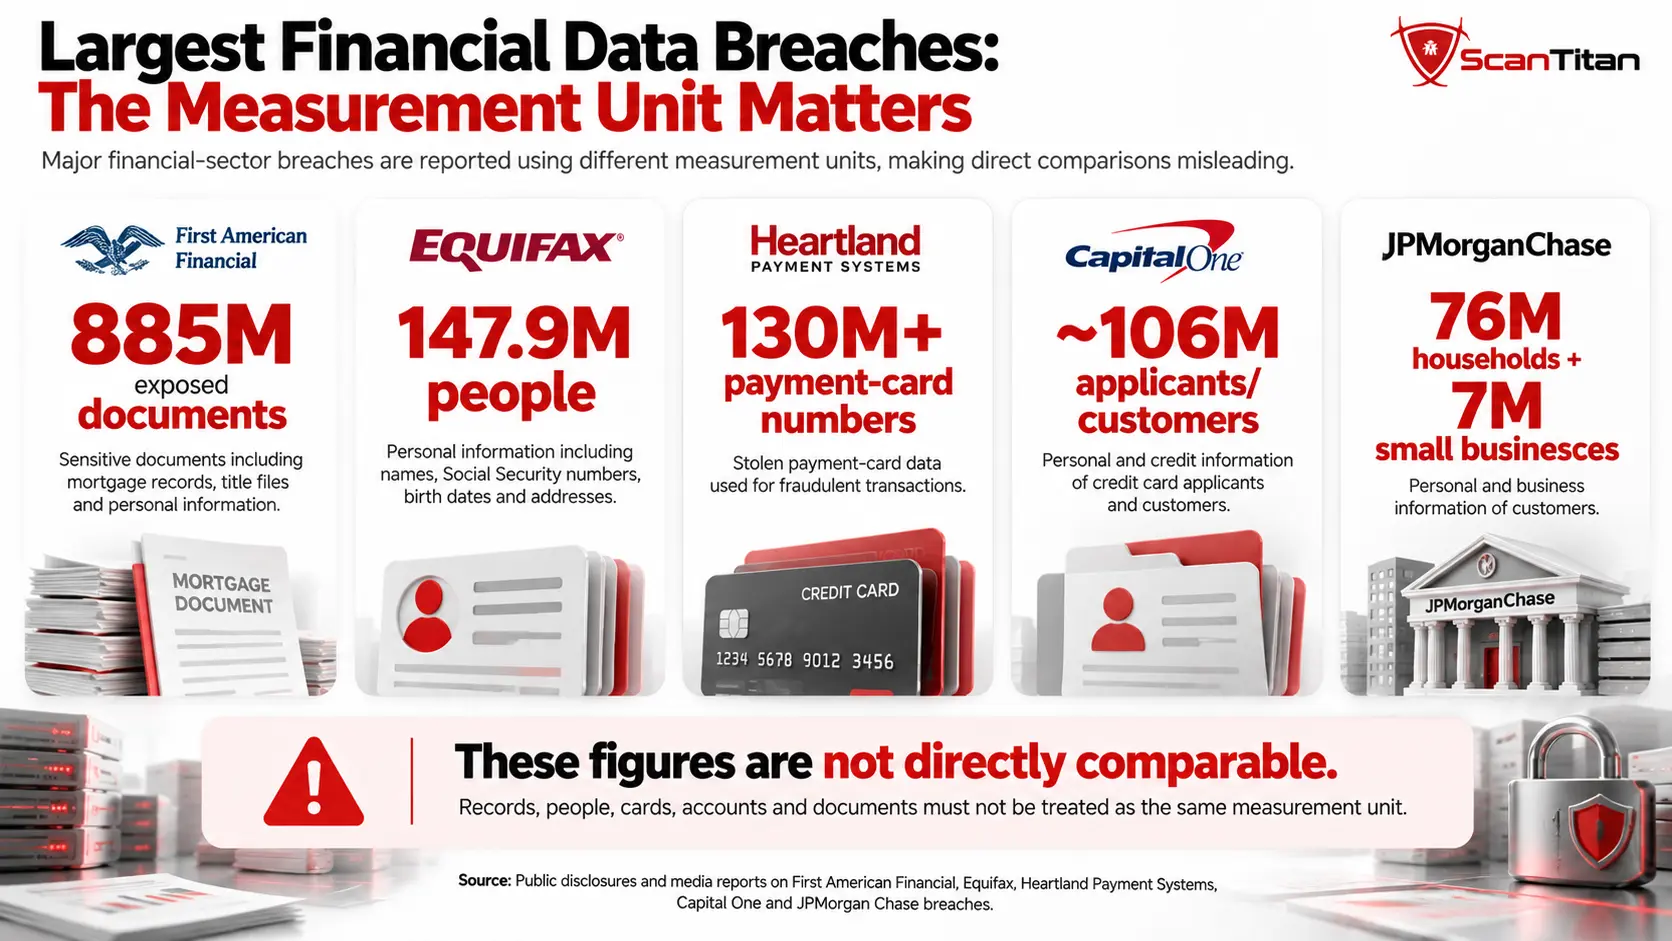
| Organization | Year | Subsector | Affected Count | Unit | Primary Vector / Mechanism |
|---|---|---|---|---|---|
| First American Financial | 2019 disclosure | Title insurance | ~885 million | Exposed documents | Web application access-control / IDOR-style exposure |
| Equifax | 2017 | Credit bureau | ~147.9 million | People | Unpatched Apache Struts vulnerability |
| Heartland Payment Systems | 2009 disclosure | Payment processing | 130+ million | Credit and debit card numbers | SQL injection followed by malware / packet sniffing |
| Capital One | 2019 | Banking / credit | ~106 million | Applicants and customers | Cloud access-control exploitation involving server-side request forgery (SSRF)-style access |
| JPMorgan Chase | 2014 | Banking | 76 million households + 7 million businesses | Households and businesses | Compromised access credentials |
| Santander | 2024 | Banking | ~30 million | Customers / records reported in breach datasets | Third-party cloud database compromise |
| LoanDepot | 2024 | Mortgage servicing | 16.9 million | Individuals | Network intrusion and ransomware |
| Mr. Cooper | 2023 | Mortgage servicing | ~14.7 million | Individuals | System intrusion |
| Desjardins Group | 2019 | Credit union / banking | ~9.7 million | Individuals | Malicious insider / employee exfiltration |
| Block / Cash App Investing | 2022 disclosure | Fintech / payments | ~8.2 million | Current and former customers | Former employee access and data exfiltration |
The table should therefore be read as a normalized comparison rather than a simple ranking. First American’s 885 million figure refers to documents, Equifax’s figure refers to people, Heartland’s to payment-card numbers, and JPMorgan’s to households and businesses.
Notable Financial Data Breaches Disclosed in 2026
| Organization | Disclosure | Direct or Third Party? | Data / Impact | Status |
|---|---|---|---|---|
| CB Financial Services / Community Bank | May 2026 | Direct internal AI-tool exposure | Names, Social Security numbers and dates of birth | Material incident disclosed to SEC |
| Navient | 2026 | Third-party law firm | Borrower names, addresses, dates of birth and Social Security numbers | Material third-party breach disclosed |
| River Financial Corporation | June 2026 | Direct network intrusion | Ransomware and confirmed data removal; final scope under investigation at disclosure | SEC disclosure subsequently updated |
CB Financial Services / Community Bank
Community Bank determined that non-public customer information had been handled through an unauthorized AI-based application. The company disclosed names, Social Security numbers and dates of birth among the information involved.
Navient
Navient disclosed a ransomware incident affecting a third-party law firm that held borrower information. Navient said its own systems were not accessed, illustrating how a financial institution can experience a material customer-data exposure without suffering the initial intrusion itself.
River Financial Corporation
River Financial reported unauthorized access to its network and ransomware deployment. A later SEC amendment confirmed that data had been removed from the environment, illustrating how breach scope can change as forensic investigations progress.
Financial Data Breach Reporting Requirements
Financial breach reporting is fragmented across securities regulators, state financial regulators, privacy authorities and international operational-resilience frameworks.
| Framework | Reporting Trigger | Deadline / Sequence | Important Qualification |
|---|---|---|---|
| SEC Form 8-K Item 1.05 | Material cybersecurity incident affecting a public registrant | 4 business days after the company determines the incident is material | The deadline runs from the materiality determination, not automatically from attack discovery. |
| NYDFS 23 NYCRR Part 500 | Qualifying cybersecurity event affecting a covered entity | 72 hours after determining the qualifying event occurred | The amended regulation also includes requirements related to extortion-payment notification. |
| EU DORA | Major ICT-related incident meeting applicable classification criteria | Initial notification, intermediate report and final report under the DORA reporting sequence | Major ICT incidents are not automatically data breaches. |
SEC Item 1.05
Public companies generally must disclose a material cybersecurity incident within four business days after determining that the incident is material. This does not mean every intrusion must be reported within four days of discovery.
NYDFS Part 500
Covered New York financial entities must notify the New York Department of Financial Services as promptly as possible and no later than 72 hours after determining that a qualifying cybersecurity event has occurred.
The framework is particularly relevant to financial breach research because NYDFS enforcement actions have also provided detailed records of cybersecurity-control failures at financial institutions.
DORA Incident Reporting
The EU Digital Operational Resilience Act creates a harmonized system for reporting major ICT-related incidents across regulated financial entities.
The European Supervisory Authorities’ first annual DORA report recorded 3,383 major ICT-related incidents, but only approximately 10% were cybersecurity-related.
Therefore:
3,383 DORA incidents does not mean 3,383 financial data breaches.
Operational outages, infrastructure failures and other ICT events can meet DORA reporting requirements without involving unauthorized disclosure of data.
Financial Data Breach Statistics Commonly Misquoted
Several statistics circulating in financial cybersecurity articles are technically real numbers but are frequently assigned to the wrong population, year or measurement unit.
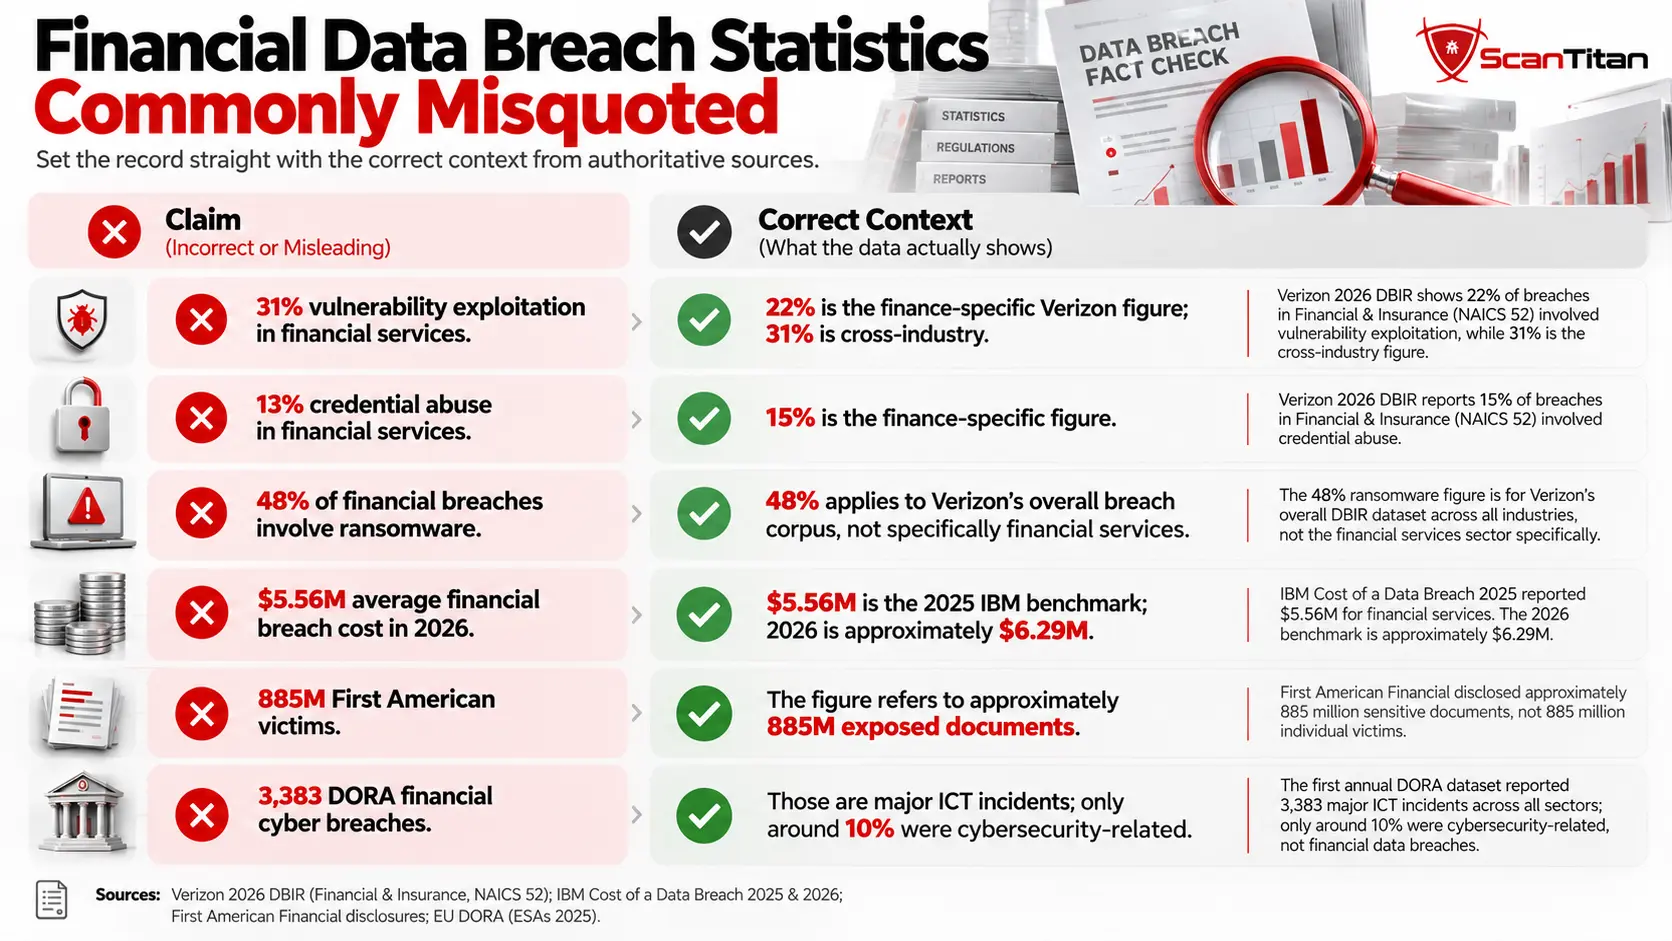
| Common Claim | What It Actually Measures | Correct Interpretation |
|---|---|---|
| “31% of financial breaches begin with vulnerability exploitation.” | 31% is Verizon’s broader cross-industry initial-access figure. | 22% is the finance-specific NAICS 52 figure. |
| “Credential abuse causes 13% of financial breaches.” | 13% applies to Verizon’s broader dataset. | 15% is the finance-specific initial-access figure. |
| “Ransomware is involved in 48% of financial breaches.” | 48% refers to Verizon’s overall breach corpus. | The 48% figure should not be labeled finance-specific. |
| “Financial-services breaches cost $5.56M in 2026.” | $5.56M is the IBM 2025 financial-sector benchmark. | The 2026 benchmark increased to approximately $6.29M. |
| “885 million people were affected by First American.” | The widely cited figure refers to exposed documents. | Approximately 885 million documents, not confirmed individual victims. |
| “Every downstream vendor notice represents another attack.” | A single upstream compromise can affect many client institutions. | Intrusions, affected organizations and notices should be counted separately. |
| “DORA reported 3,383 financial cyber breaches.” | DORA recorded major ICT-related incidents. | Only around 10% were cybersecurity-related, and even those are not automatically data breaches. |
| “BEC losses are financial data-breach costs.” | BEC statistics generally measure fraud losses. | Fraud-loss figures should not be treated as organizational breach-lifecycle costs. |
The distinction is important because using a valid number with the wrong denominator can produce a misleading conclusion even when the source itself is reputable. The same problem appears in many cybersecurity datasets, which is why ScanTitan’s Cybersecurity Statistics research separates incidents, breaches, phishing detections, vulnerabilities and reported crime losses rather than merging them into one attack total.
What the 2026 Financial Breach Data Shows
Several conclusions remain consistent after differences between datasets are accounted for.
First, financial data breaches remain unusually expensive. IBM’s 2026 benchmark places the sector approximately 26% above the global average.
Second, vulnerability exploitation has become a major financial-sector entry vector. Verizon places exploitation at 22% of known finance-specific initial access, slightly ahead of phishing at 20%.
Third, identity and human risk remain central. Credential abuse still accounts for 15% of known initial access, while the broader human element is involved in 65% of financial breaches.
Fourth, third-party exposure is part of the core financial attack surface. Verizon’s 34% third-party figure reinforces the importance of SaaS providers, processors, law firms, cloud platforms and other external service providers.
Finally, public breach data is still incomplete. ITRC’s finding that only 24% of H1 2026 notices identified an attack vector means analysts should be cautious when treating publicly disclosed causes as a complete representation of how financial breaches begin.
Research Methodology and Limitations
This analysis prioritizes regulatory records and original cybersecurity research rather than relying on secondary statistics roundups.
What Counts as a Financial Data Breach?
For this research, a financial data breach is an incident involving confirmed unauthorized access, disclosure, acquisition or exposure of information held by a financial organization or relevant processor.
Examples include confirmed exposure or exfiltration of customer PII, credentials, loan records, payment-related information, employee information or confidential internal data.
Not every cyberattack qualifies.
- A DDoS attack without data disclosure is not counted as a data breach.
- A phishing campaign without confirmed compromise is not counted as a breach. Broader phishing activity is covered separately in ScanTitan’s phishing research.
- BEC fraud losses are not automatically breach costs.
- A ransomware event without confirmed disclosure is treated as ransomware context rather than automatically classified as a data breach. See the broader ransomware statistics for attack-level measurements.
- DORA ICT incidents are not treated as breaches unless data compromise is actually involved.
How the Main Datasets Differ
| Dataset | What It Measures | Main Limitation |
|---|---|---|
| Verizon DBIR | Contributed security incidents and confirmed breaches | Large research corpus, but not a census of every global breach |
| IBM Cost of a Data Breach | Organizational breach economics | Cost study rather than incident-frequency database |
| ITRC | Publicly reported U.S. data compromises | Dependent on public disclosure and U.S. reporting environment |
| Sophos | Survey findings from organizations affected by ransomware | Survey population rather than confirmed breach corpus |
| SEC / NYDFS / regulators | Legally required or enforcement-related disclosures | Only captures entities and events meeting applicable reporting requirements |
Measurement Rules Used in This Research
- Security incidents are kept separate from confirmed breaches.
- Victim notices are not treated as unique breach incidents.
- Downstream vendor notifications are not automatically treated as separate upstream intrusions.
- Survey results are clearly separated from breach-corpus statistics.
- Records, people, accounts, cards, documents, businesses and households are treated as different units.
- Cross-industry figures are not relabeled as financial-sector figures.
- Statistics from incompatible datasets are not added together.
These limitations mean the figures in this report should be interpreted as benchmarks from defined datasets rather than a complete census of every financial data breach worldwide.
Financial Data Breach Statistics 2026: Full Reference Table
| Statistic | Value | Population / Scope | Reporting Period | Primary Source |
|---|---|---|---|---|
| Average financial-services breach cost | $6.29M | Financial-services organizations | 2026 report | IBM |
| Global average breach cost | $4.99M | All industries | 2026 report | IBM |
| Financial-sector cost premium | ~26.1% | Derived from IBM financial vs global averages | 2026 | ScanTitan calculation / IBM |
| Financial breach cost | $5.72M | Financial sector | 2021 report | IBM |
| Financial breach cost | $5.97M | Financial sector | 2022 report | IBM |
| Financial breach cost | $5.90M | Financial sector | 2023 report | IBM |
| Financial breach cost | $6.08M | Financial sector | 2024 report | IBM financial-industry analysis |
| Financial breach cost | $5.56M | Financial sector | 2025 report | IBM |
| Financial & insurance security incidents | 3,809 | NAICS 52 incident corpus | 2026 DBIR | Verizon |
| Confirmed financial & insurance breaches | 1,300 | Confirmed disclosure | 2026 DBIR | Verizon |
| Top-three breach patterns | 81% | Financial & Insurance breaches | 2026 DBIR | Verizon |
| Vulnerability exploitation | 22% | Finance-specific initial access | 2026 DBIR | Verizon |
| Phishing | 20% | Finance-specific initial access | 2026 DBIR | Verizon |
| Credential abuse | 15% | Finance-specific initial access | 2026 DBIR | Verizon |
| Human element involvement | 65% | Financial & Insurance breaches | 2026 DBIR | Verizon |
| Third-party involvement | 34% | Financial & Insurance breaches | 2026 DBIR | Verizon |
| External actors | 88% | Financial & Insurance breaches | 2026 DBIR | Verizon |
| Internal actors | 12% | Financial & Insurance breaches | 2026 DBIR | Verizon |
| Financial motive | 98% | Financial & Insurance breaches | 2026 DBIR | Verizon |
| Internal data compromised | 53% | Financial-sector breaches | 2026 DBIR | Verizon |
| Personal data compromised | 43% | Financial-sector breaches | 2026 DBIR | Verizon |
| Credentials compromised | 26% | Financial-sector breaches | 2026 DBIR | Verizon |
| U.S. financial-services compromises | 739 | Publicly reported U.S. compromises | 2025 | ITRC |
| U.S. financial-services compromises | 387 | Publicly reported U.S. compromises | H1 2026 | ITRC |
| H1 2026 attack-vector disclosure rate | 24% | Public breach notices | H1 2026 | ITRC |
| Supply-chain breach events | 38 | All industries | H1 2026 | ITRC |
| Entities affected by supply-chain events | 206 | All industries | H1 2026 | ITRC |
| Supply-chain victim notices | 280.6M | All industries | H1 2026 | ITRC |
| Ransomware attacks resulting in encryption | 59% | Financial organizations affected by ransomware | 2025 survey | Sophos |
| Financial ransomware victims paying | 67% | Financial organizations affected by ransomware | 2025 survey | Sophos |
| Median ransom demand | $3M | Financial ransomware survey | 2025 | Sophos |
| Median ransom payment | $2.1M | Financial ransomware survey | 2025 | Sophos |
| AI-enabled malicious breaches | 1 in 4 | Cross-industry breach study | 2026 | IBM |
| Increase in AI-enabled breaches | 56% YoY | Cross-industry breach study | 2026 | IBM |
| Security AI / automation savings | $1.93M | Extensive use vs no security AI/automation | 2026 | IBM |
| DORA major ICT-related incidents | 3,383 | Reported major ICT incidents | First annual DORA dataset | European Supervisory Authorities |
| DORA incidents classified as cybersecurity-related | 10% | Major ICT-related incidents | First annual DORA dataset | European Supervisory Authorities |
Primary Sources
- IBM — Cost of a Data Breach Report
- IBM — Cost of a Data Breach: Financial Industry
- Verizon — Data Breach Investigations Report
- Identity Theft Resource Center — 2025 Annual Data Breach Report
- Identity Theft Resource Center — H1 2026 Data Breach Report
- Sophos — State of Ransomware in Financial Services
- SEC — Cybersecurity Incident Disclosure Requirements
- NYDFS — 23 NYCRR Part 500 Cybersecurity Regulation
- European Banking Authority — DORA Major ICT Incident Report
- FTC — Equifax Data Breach Settlement
- U.S. Department of Justice — Heartland Payment Systems Case
- NYDFS — First American Financial Investigation
Frequently Asked Questions
How many financial-services data breaches occurred in 2026?
There is no single global census. Verizon’s 2026 DBIR recorded 3,809 Financial and Insurance security incidents, including 1,300 confirmed breaches, while ITRC separately recorded 387 publicly reported U.S. financial-services compromises during H1 2026. The figures should not be added because the two datasets use different methodologies.
What is the average cost of a financial-services data breach in 2026?
IBM’s 2026 research places the average financial-services breach cost at approximately $6.29 million, compared with a $4.99 million global cross-industry average.
What is the most common initial access vector in financial-services breaches?
In Verizon’s finance-specific 2026 dataset, exploitation of vulnerabilities ranks first among the listed initial access vectors at 22%, followed by phishing at 20% and credential abuse at 15%.
What percentage of financial breaches involve third parties?
Verizon reports third-party involvement in 34% of Financial and Insurance breaches in its 2026 industry dataset.
What percentage of financial breaches involve the human element?
The human element was involved in 65% of Financial and Insurance breaches in Verizon’s 2026 sector analysis.
What data is most commonly compromised in financial breaches?
Verizon reports internal data in 53% of financial-sector breaches, personal data in 43%, other data in 28%, and credentials in 26%. These categories can overlap within the same incident.
Is ransomware involved in 48% of financial-services breaches?
Not according to a finance-specific Verizon percentage. The 48% figure applies to Verizon’s overall 2026 breach corpus and should not be presented as though 48% of Financial and Insurance breaches involved ransomware.
Why do financial data breach statistics vary between reports?
Different sources measure different populations. Verizon analyzes contributed incidents and confirmed breaches, IBM studies breach economics, ITRC tracks publicly reported U.S. compromises, Sophos surveys ransomware-affected organizations, and regulators collect incidents according to legal reporting thresholds.
What was the largest financial data breach?
There is no single clean ranking because historical breach counts use different measurement units. First American involved approximately 885 million exposed documents, Equifax affected roughly 147.9 million people, Heartland involved more than 130 million payment-card numbers, and JPMorgan reported approximately 76 million households plus seven million small businesses.
Why should victim notices not be counted as breach incidents?
One intrusion can create many downstream notifications. A breach at a shared vendor may affect dozens of financial institutions and millions of individuals, producing many notices from a single upstream attack. Incident count, affected-organization count and victim-notice count should therefore be tracked separately.