Verizon’s 2026 retail dataset contains 997 security incidents and 806 confirmed data breaches. Exploitation of vulnerabilities accounted for 42% of known initial access, compared with 14% for credential abuse and 9% for phishing. Third parties were involved in 68% of retail breaches, while internal corporate information appeared in 84% of compromised-data cases.
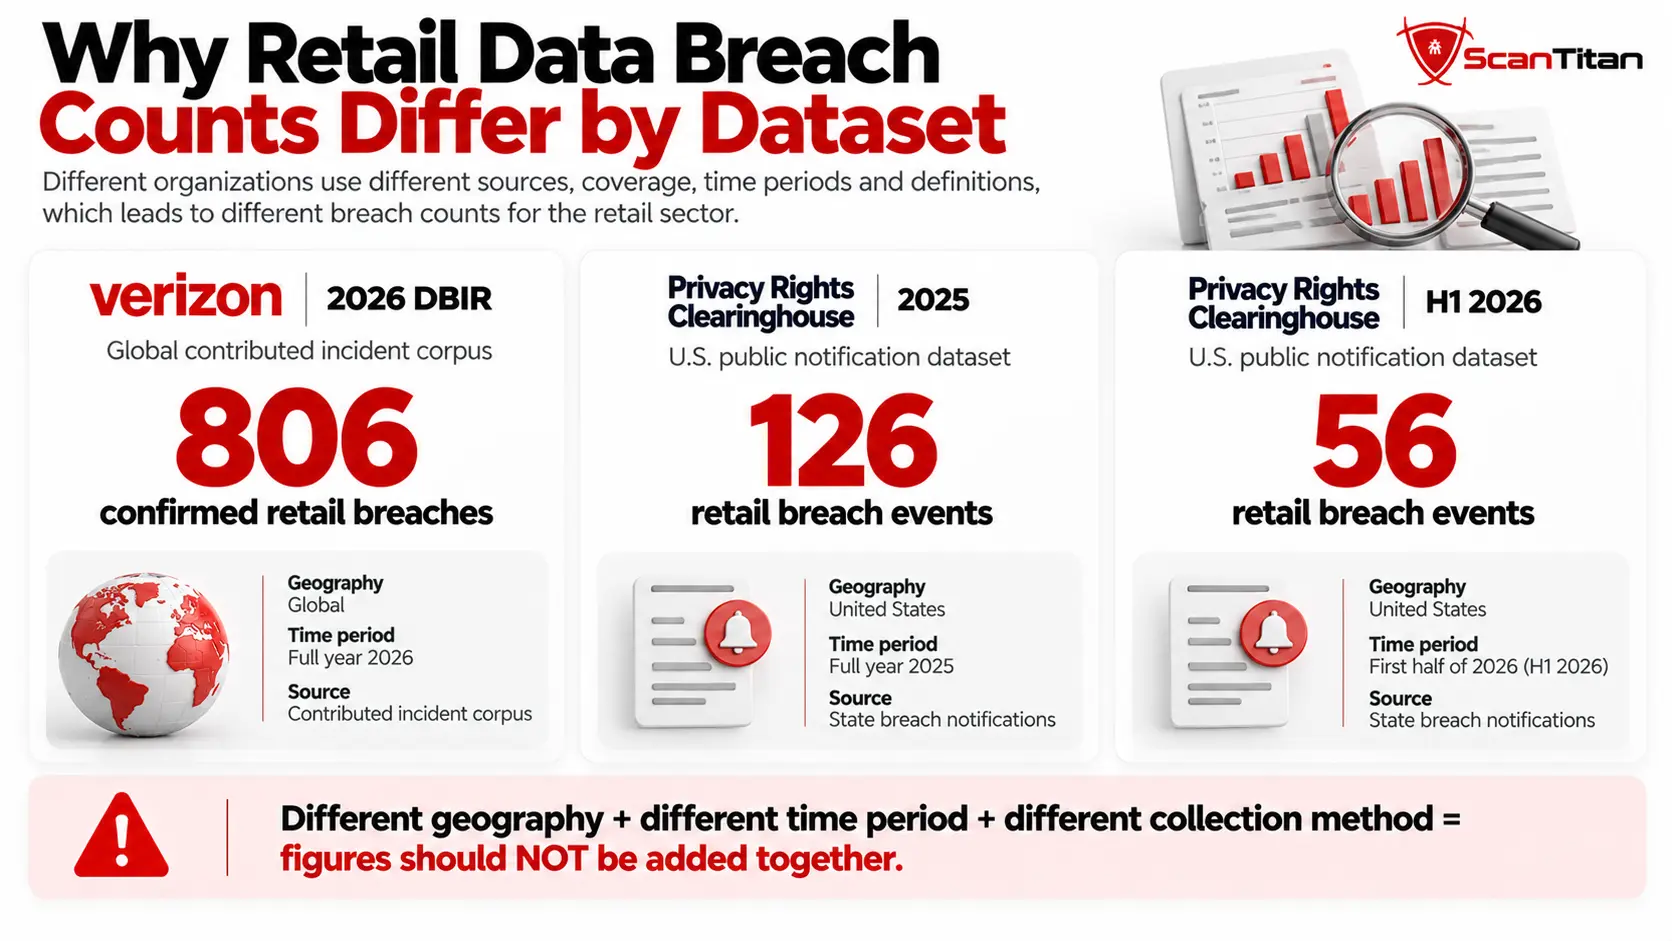
Public breach-notification data provides a different view. Privacy Rights Clearinghouse recorded 126 U.S. retail breach events in 2025 and another 56 retail events during the first half of 2026. These figures should not be added to Verizon’s totals because the datasets cover different populations, geographies and collection methods.
Key Retail Data Breach Statistics for 2026
The table below keeps the denominator attached to every statistic. That matters because a confirmed breach, regulatory notification, ransomware survey response and automated login attempt do not measure the same thing. For broader cross-industry context, see ScanTitan’s data breach statistics research.
| Retail Data Breach Metric | Latest Finding | Scope |
|---|---|---|
| Retail security incidents | 997 | Verizon 2026 Retail |
| Confirmed retail breaches | 806 | Verizon 2026 Retail |
| Top three breach patterns | 95% | Confirmed retail breaches |
| Vulnerability exploitation | 42% | Known retail initial access |
| Credential abuse | 14% | Known retail initial access |
| Phishing | 9% | Known retail initial access |
| Third-party involvement | 68% | Retail breaches |
| Human element involvement | 58% | Retail breaches |
| External threat actors | 99% | Retail breaches |
| Financial motive | 85% | Retail breaches |
| Internal data compromised | 84% | Retail breaches |
| Credentials compromised | 26% | Retail breaches |
| Secrets compromised | 20% | Retail breaches |
| U.S. retail breach events | 126 in 2025 | Privacy Rights Clearinghouse |
| U.S. retail breach events | 56 in H1 2026 | Privacy Rights Clearinghouse |
The strongest sector-specific figures come from Verizon’s 2026 DBIR Retail Snapshot. Broader cybersecurity metrics should not automatically be substituted for these retail-specific figures.
How Many Retail Data Breaches Occur?
There is no single global census of retail data breaches. Verizon recorded 997 retail security incidents, including 806 confirmed breaches, in its 2026 retail dataset.
Privacy Rights Clearinghouse provides a separate U.S. notification-based view. Its 2025 dataset recorded 126 retail breach events, while its H1 2026 report recorded:
- 56 retail breach events
- approximately 0.3 million affected people
The numbers are not contradictory. Verizon analyzes a contributed incident and breach corpus, while PRC aggregates public U.S. breach-notification data.
The same measurement problem appears across cybersecurity research. ScanTitan’s broader Cybersecurity Statistics 2026 research keeps breach counts, attack telemetry, survey data and financial-loss figures separate for the same reason.
What Causes Retail Data Breaches?
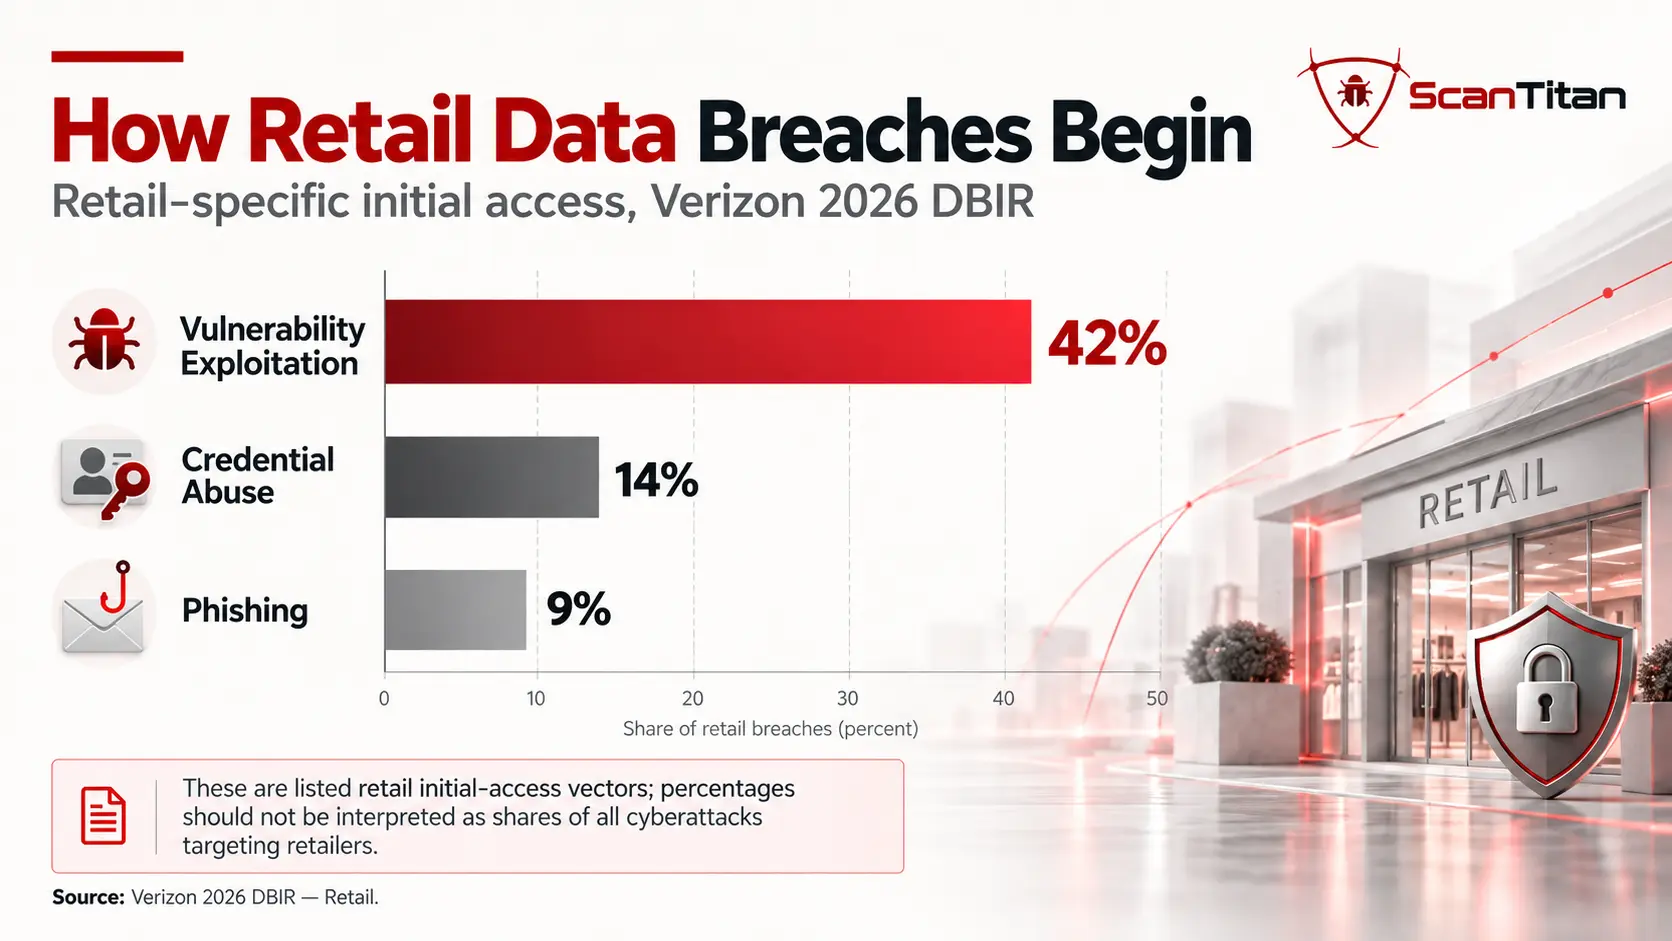
Retail’s current initial-access profile is dominated by exploitation of software vulnerabilities.
| Initial Access Vector | Retail Share |
|---|---|
| Vulnerability exploitation | 42% |
| Credential abuse | 14% |
| Phishing | 9% |
Vulnerability Exploitation Leads Retail Initial Access
At 42%, vulnerability exploitation is the leading listed initial-access vector in Verizon’s retail-specific dataset.
This is particularly relevant to retailers because their internet-facing attack surface can include ecommerce platforms, web applications, APIs, cloud services, customer portals, payment integrations and vendor-connected systems.
The statistic should not be interpreted as “42% of retail websites are vulnerable.” It describes the share of known initial access classified as vulnerability exploitation within the retail breach dataset. ScanTitan’s Vulnerability Statistics 2026 research explains the wider distinction between vulnerability disclosure, exploitation and confirmed breach entry.
Credential Abuse Accounts for 14%
Credential abuse accounts for 14% of retail initial access. Stolen employee credentials, administrator accounts, reused passwords, sessions and cloud identities can allow attackers to authenticate without exploiting a software flaw.
Phishing Accounts for 9%
Phishing represents 9% of the listed retail initial-access methods. That does not mean human involvement is limited to 9%. Verizon reports the broader human element in 58% of retail breaches, which can include social engineering, credential misuse and other user-involved actions.
For the distinction between reported phishing campaigns, detections, complaints and confirmed breaches, see ScanTitan’s Phishing Statistics 2026.
Three Patterns Account for 95% of Retail Breaches
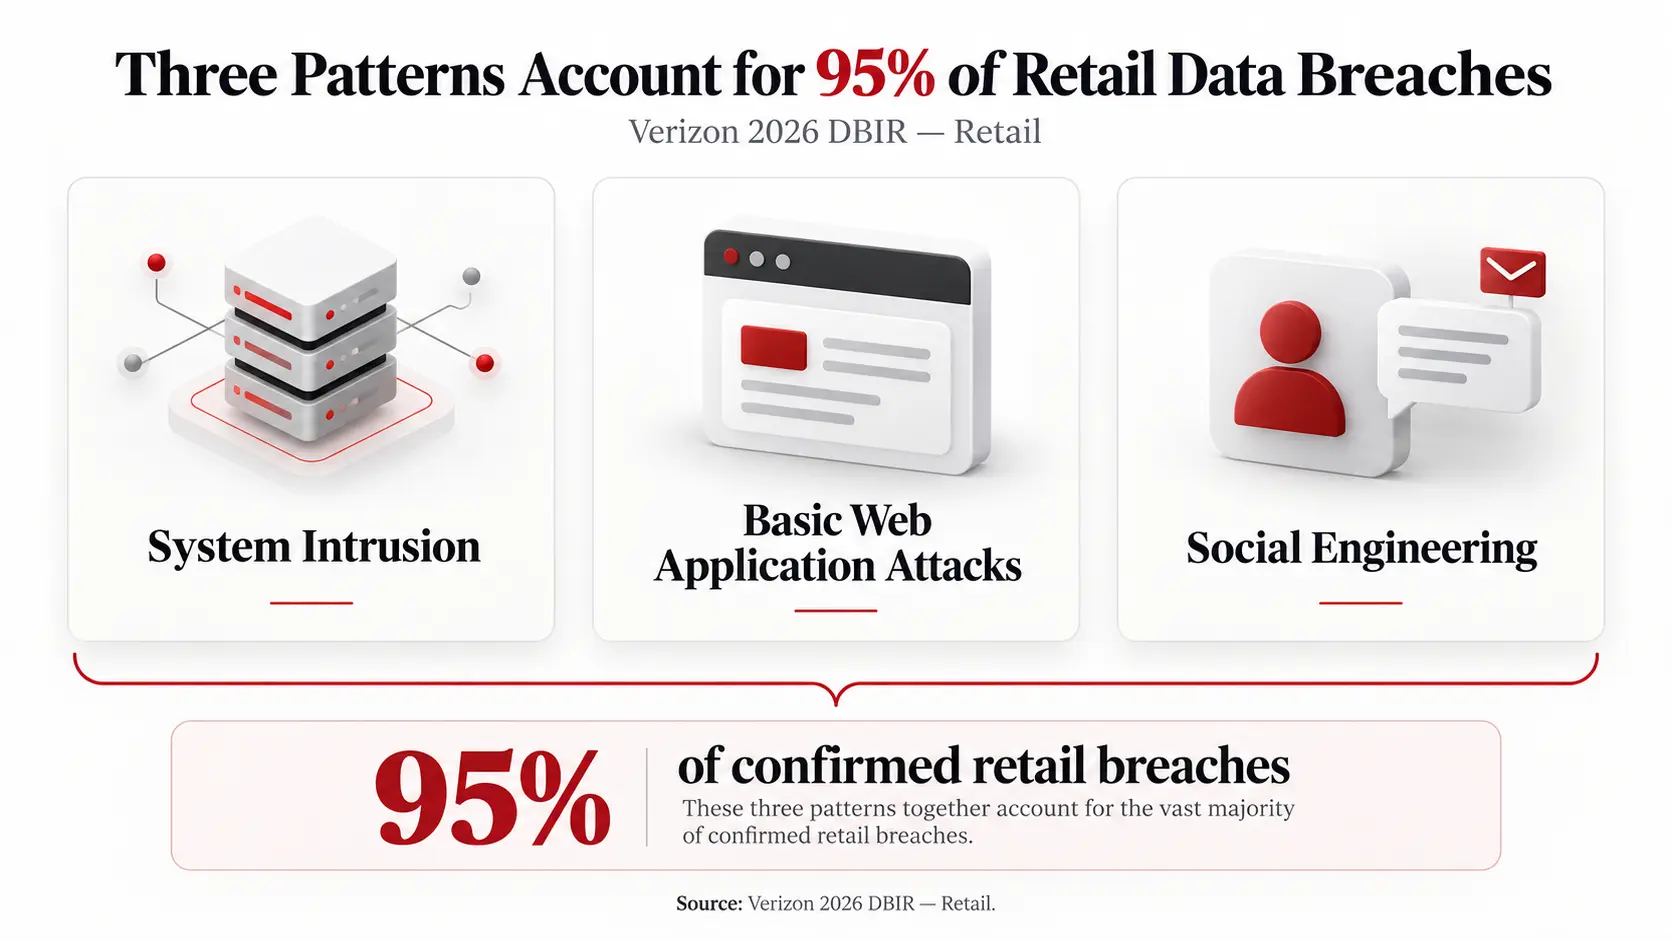
Verizon reports that System Intrusion, Basic Web Application Attacks and Social Engineering together account for 95% of confirmed retail breaches.
- System Intrusion covers multi-stage compromises that can involve malware, credentials, lateral movement, exfiltration or ransomware.
- Basic Web Application Attacks are especially relevant to public ecommerce sites, login systems, APIs and administrative portals.
- Social Engineering includes attacks that manipulate employees, support personnel or other trusted users.
ScanTitan’s website security statistics research provides broader context on vulnerability exploitation, web application attacks and automated web traffic without treating them as equivalent metrics.
What Data Gets Compromised in Retail Breaches?
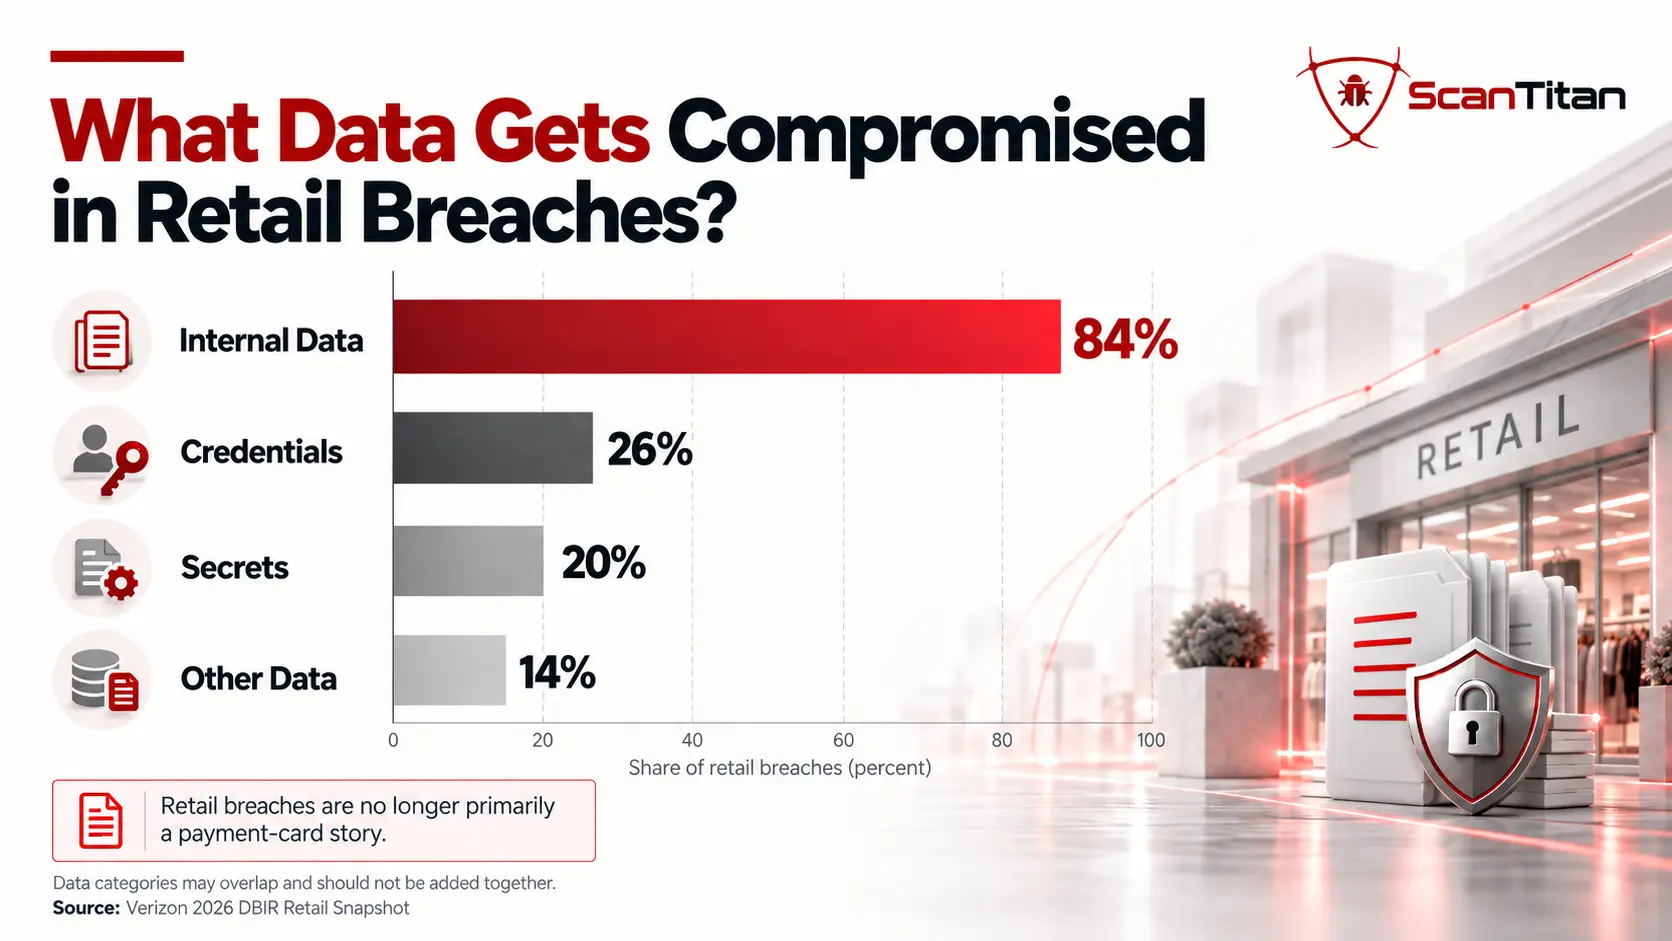
The data targeted in modern retail incidents is broader than payment-card information.
| Compromised Data Category | Share of Retail Breaches |
|---|---|
| Internal data | 84% |
| Credentials | 26% |
| Secrets | 20% |
| Other data | 14% |
Verizon reports internal corporate data in 84% of retail breaches. This is one of the strongest indicators that the sector has moved beyond the historical model in which retail compromise was treated primarily as payment-card theft.
Retail Breaches Are No Longer Only About Payment Cards
Modern retailers maintain valuable information across ecommerce applications, employee systems, cloud infrastructure, APIs, loyalty programs, customer-support tools, logistics platforms and internal databases.
An attacker can monetize internal documents, credentials or secrets through extortion or further intrusion even when no usable payment-card information is stolen.
Who Attacks Retailers and Why?
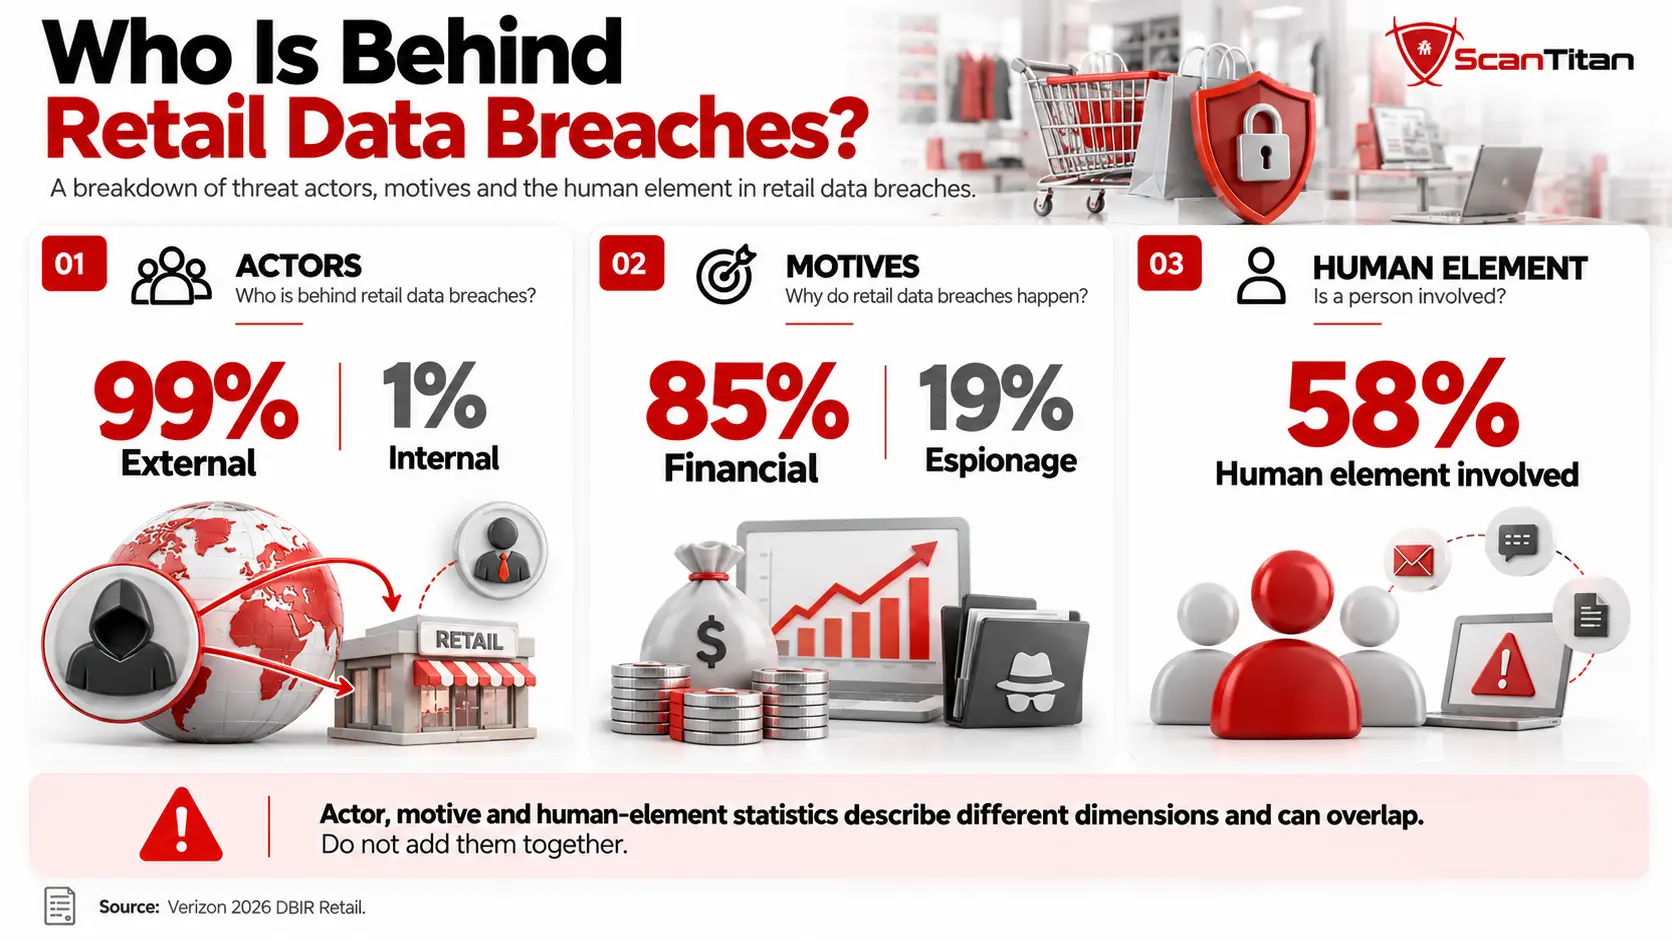
Verizon’s retail-specific actor data shows unusually strong concentration among external attackers.
| Retail Breach Dimension | Share |
|---|---|
| External actors | 99% |
| Internal actors | 1% |
| Financial motive | 85% |
| Espionage motive | 19% |
| Human element | 58% |
These percentages measure different dimensions and should not be added together. An externally driven breach can be financially motivated while also involving human interaction.
The 99% external figure shows that confirmed breaches in Verizon’s current retail dataset overwhelmingly involve actors outside the victim organization. The 58% human-element figure explains why this does not mean every incident is purely technical.
Third-Party and Supply-Chain Retail Breaches
Third parties were involved in 68% of retail breaches in Verizon’s 2026 retail dataset, making vendor and supply-chain exposure one of the defining features of the sector.
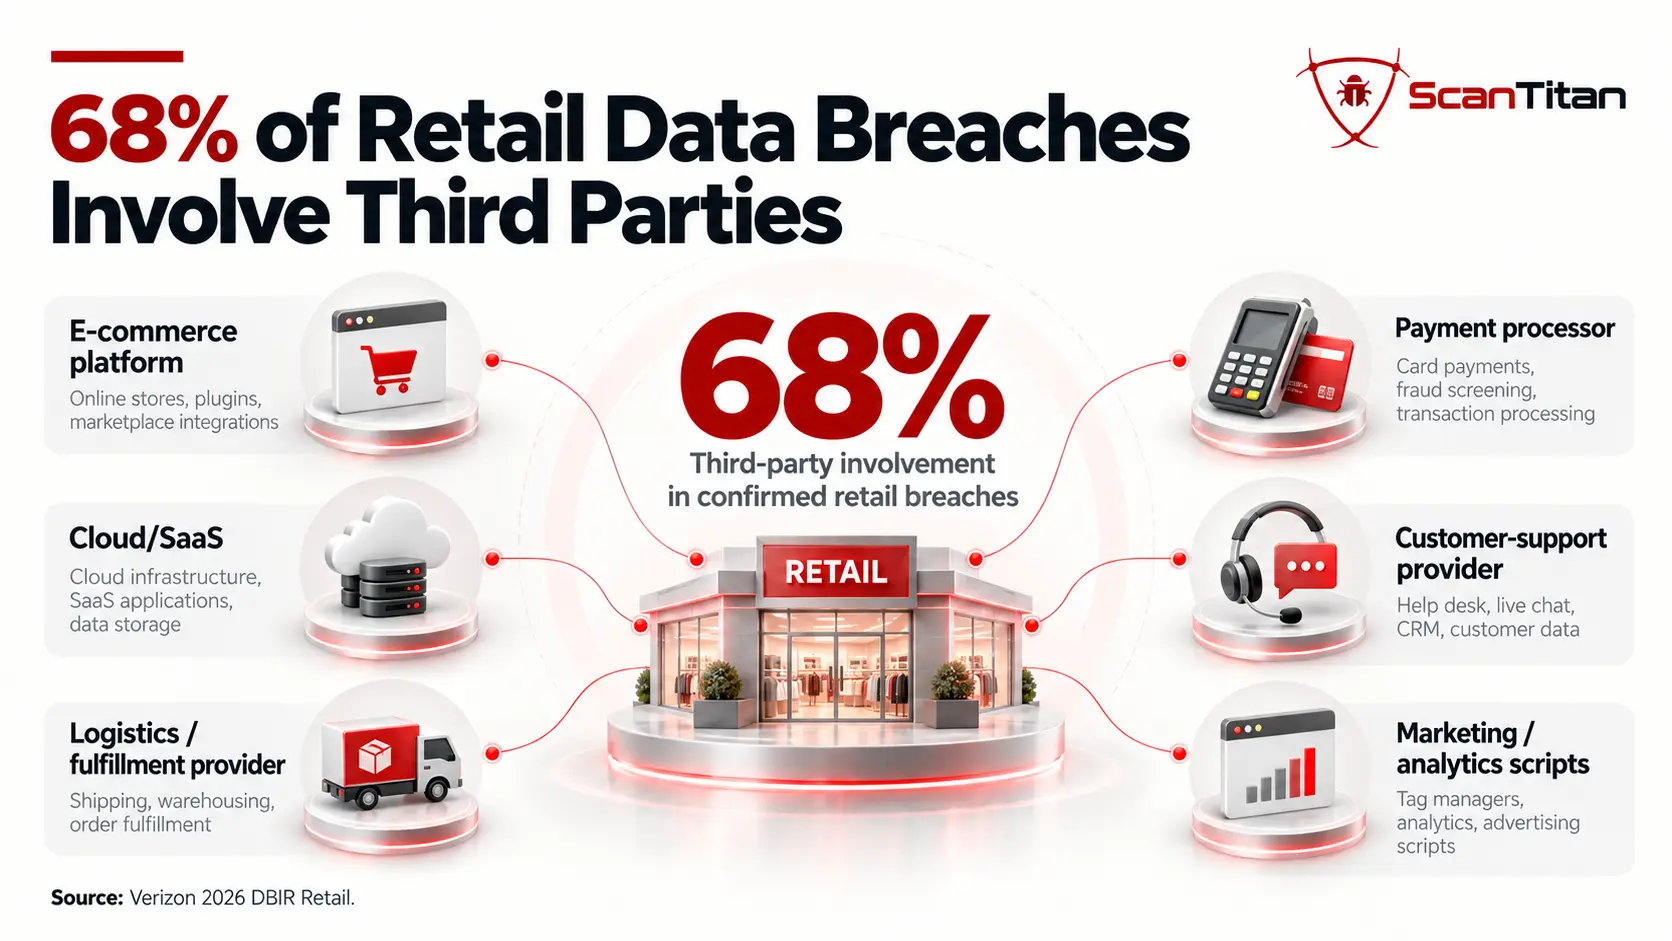
A modern retail environment can depend on payment processors, ecommerce platforms, SaaS applications, customer-service systems, logistics providers, identity services, analytics, marketing tools, cloud infrastructure and third-party JavaScript.
For broader cross-industry context on vendor and supply-chain exposure, see our third-party data breach statistics research.
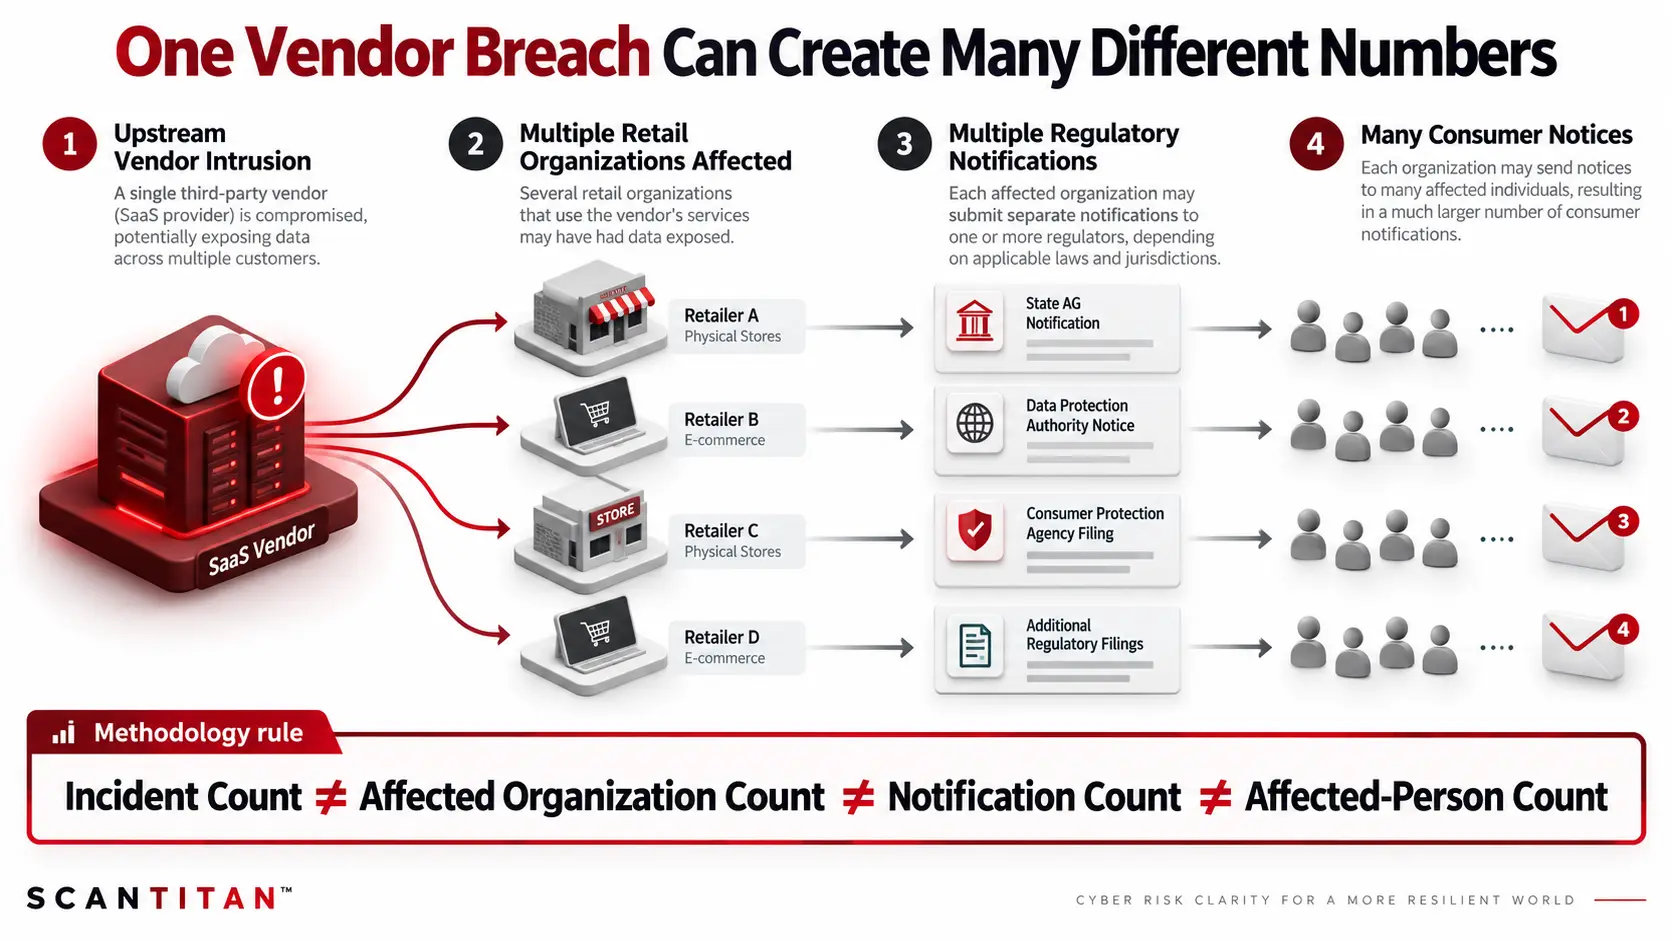
One Vendor Breach Can Create Many Different Numbers
Suppose one external service provider suffers an intrusion and the same compromised environment contains data belonging to 40 retailers.
The event could generate:
- 1 upstream intrusion
- 40 affected organizations
- multiple state or national breach filings
- potentially hundreds of thousands of consumer notices
Those figures should not be treated as interchangeable.
How Much Does a Retail Data Breach Cost?
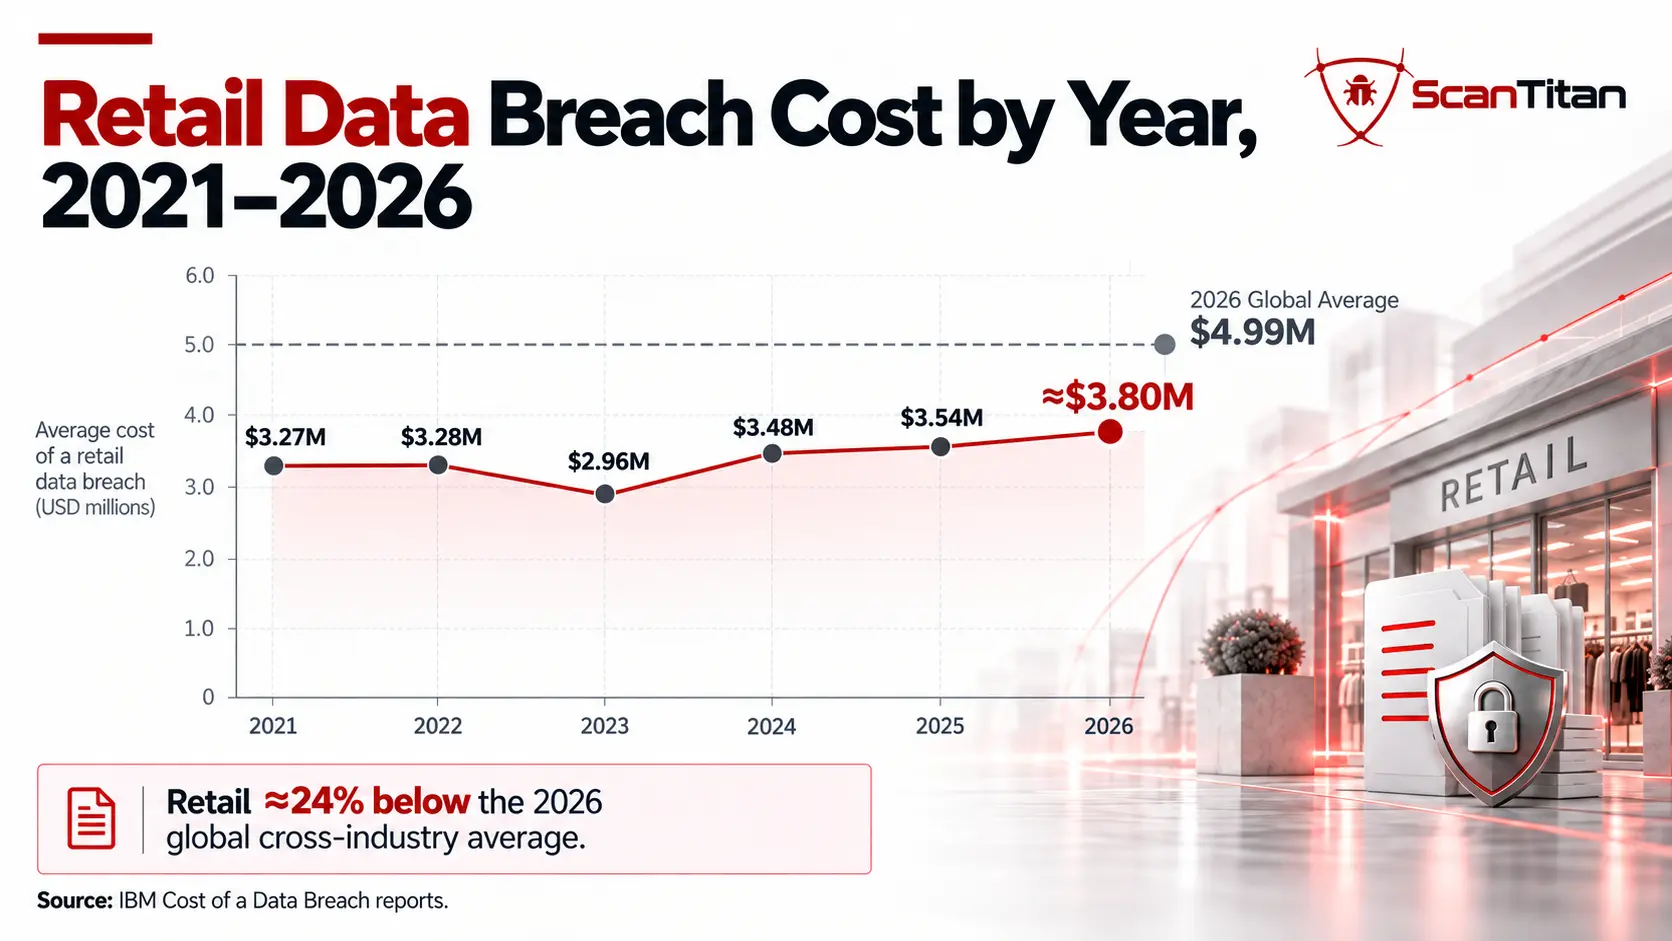
IBM’s 2026 Cost of a Data Breach research places the global cross-industry average at $4.99 million.
IBM-derived 2026 industry tables place the retail-sector average at approximately $3.80 million, compared with $3.54 million in 2025. Because breach-cost averages describe organizational lifecycle costs rather than fraud losses, ransom demands or customer losses, those other financial measures should be kept separate.
Using the $3.80 million retail figure and IBM’s $4.99 million global figure:
($4.99M − $3.80M) ÷ $4.99M ≈ 23.8%
That means the retail-sector benchmark is approximately 24% below the global cross-industry average. This is a ScanTitan calculation based on the underlying IBM figures.
Sector differences matter. For example, ScanTitan’s Financial Data Breach Statistics research shows that financial-services breach costs sit above the global benchmark, illustrating why a cross-industry average should not be substituted for a sector-specific figure.
Retail Data Breach Cost by Year
| IBM Report Year | Retail Average Breach Cost |
|---|---|
| 2021 | $3.27M |
| 2022 | $3.28M |
| 2023 | $2.96M |
| 2024 | $3.48M |
| 2025 | $3.54M |
| 2026 | ~$3.80M |
Ransomware Statistics for Retail
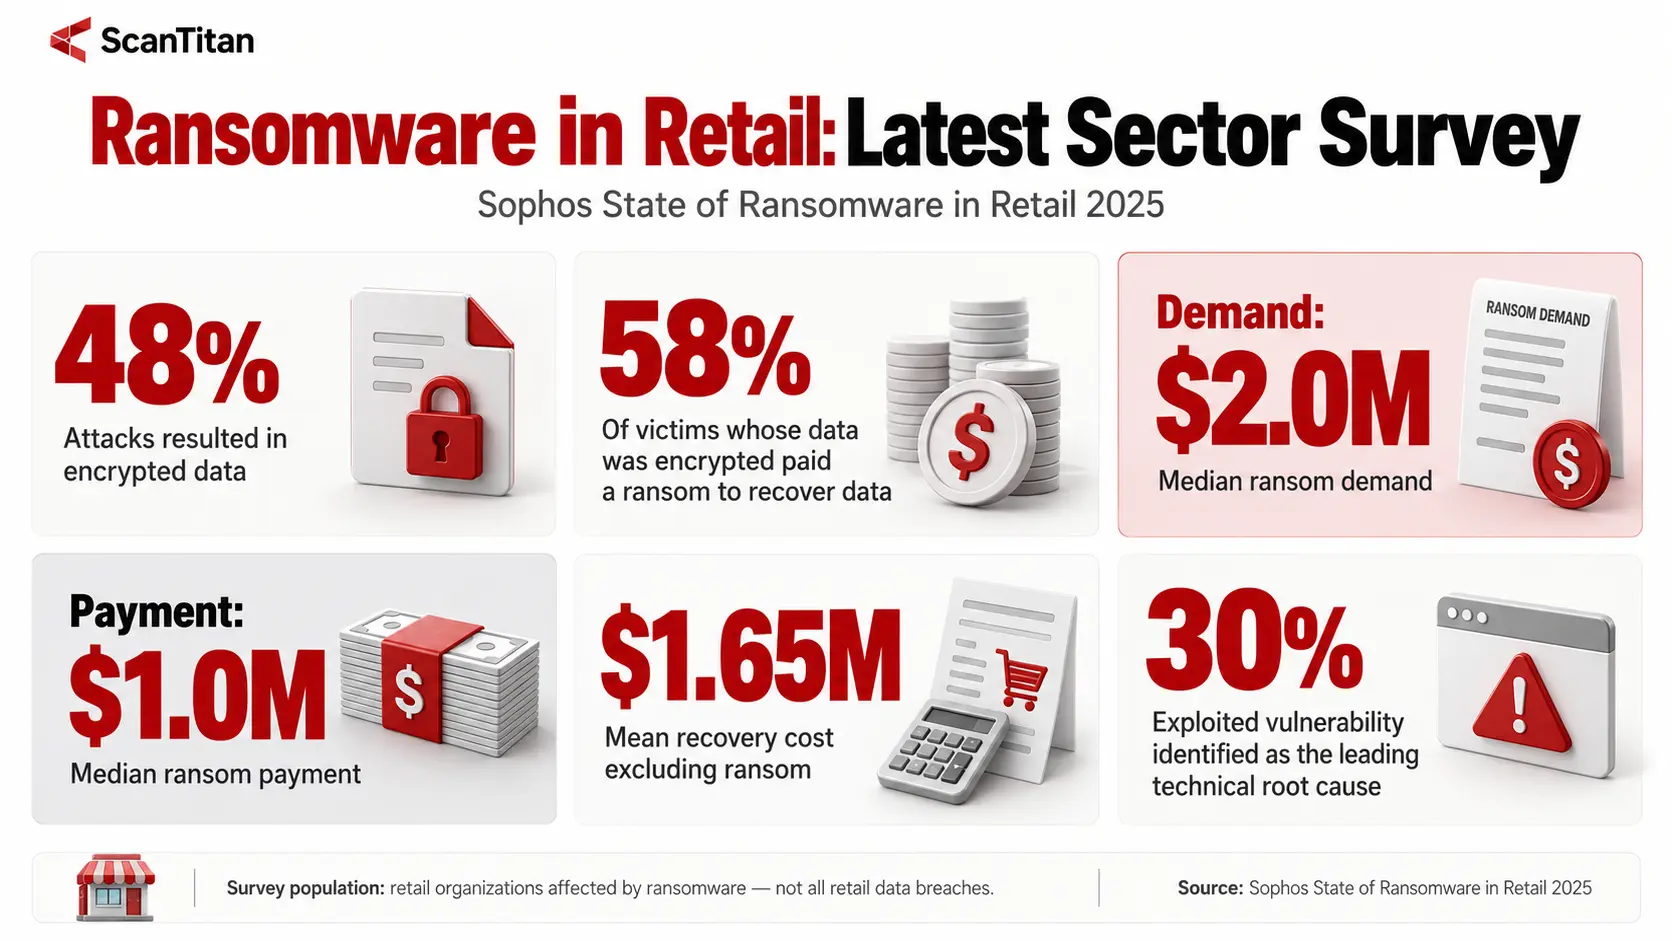
Ransomware data needs a different denominator from Verizon’s confirmed-breach statistics. Sophos’s State of Ransomware in Retail 2025 focuses on retailers that experienced ransomware.
| Retail Ransomware Metric | Latest Finding |
|---|---|
| Attacks resulting in encryption | 48% |
| Encrypted victims paying ransom | 58% |
| Median ransom demand | $2.0M |
| Median ransom payment | $1.0M |
| Mean recovery cost excluding ransom | $1.65M |
| Exploited vulnerability as technical root cause | 30% |
The denominator is critical. The 58% payment rate applies to surveyed retail organizations whose data was encrypted. It does not mean 58% of all retailers or 58% of all retail breaches resulted in a ransom payment.
The same distinction applies to cost: $2 million is the median demand, while the median actual payment was $1 million.
ScanTitan’s Ransomware Statistics 2026 research provides broader cross-industry context on prevalence, encryption, payments and recovery costs.
Where Retail Data Breaches Happen
Retail does not have one attack surface. A customer account, checkout page, API, cloud database, point-of-sale system and third-party SaaS platform expose different trust boundaries and different types of information.
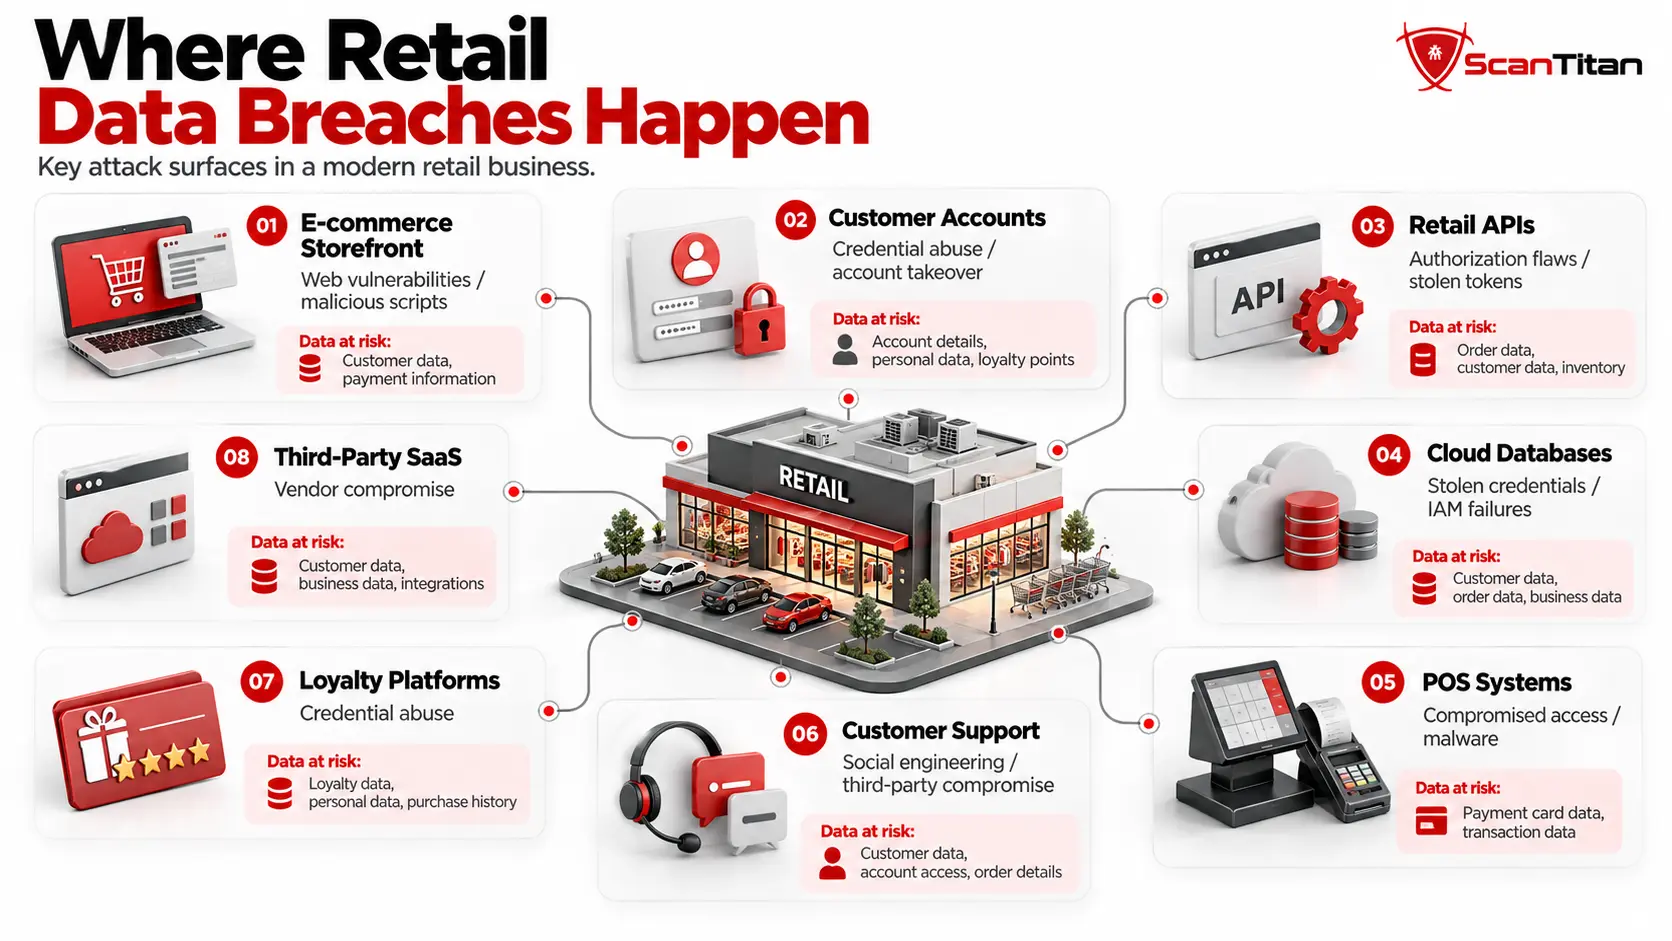
| Retail Asset | Common Attack Path | Data at Risk |
|---|---|---|
| Ecommerce storefront | Vulnerability exploitation or malicious scripts | Customer and checkout data |
| Customer accounts | Credential abuse or account takeover | Profiles, loyalty balances and account information |
| Retail APIs | Authorization flaws or stolen tokens | Orders, accounts and customer records |
| Cloud databases | Stolen credentials, IAM failures or exposed services | Internal and customer data |
| POS systems | Compromised access or malware | Payment environment |
| Customer-support systems | Social engineering or vendor compromise | Customer PII and account information |
| Loyalty platforms | Credential abuse | Accounts, points and customer profiles |
| Third-party SaaS | Vendor compromise | Internal or customer data |
Authorization weaknesses in customer-facing APIs can expose records even when the user is properly authenticated. ScanTitan’s IDOR vulnerability guide explains how missing object-level authorization can expose orders, accounts and other API resources.
Server-side integrations create a different risk. Applications that fetch remote resources can sometimes expose internal infrastructure through server-side request forgery (SSRF) when destination controls are insufficient.
E-Commerce, Web Skimming and Payment-Page Breaches
Client-side web skimming (Magecart) remains an important ecommerce risk because code running in a customer’s browser can interact directly with checkout fields.
A typical e-skimming path can look like:
Compromised merchant or third-party script → malicious JavaScript loads on checkout → payment information is captured → data is sent to attacker-controlled infrastructure.
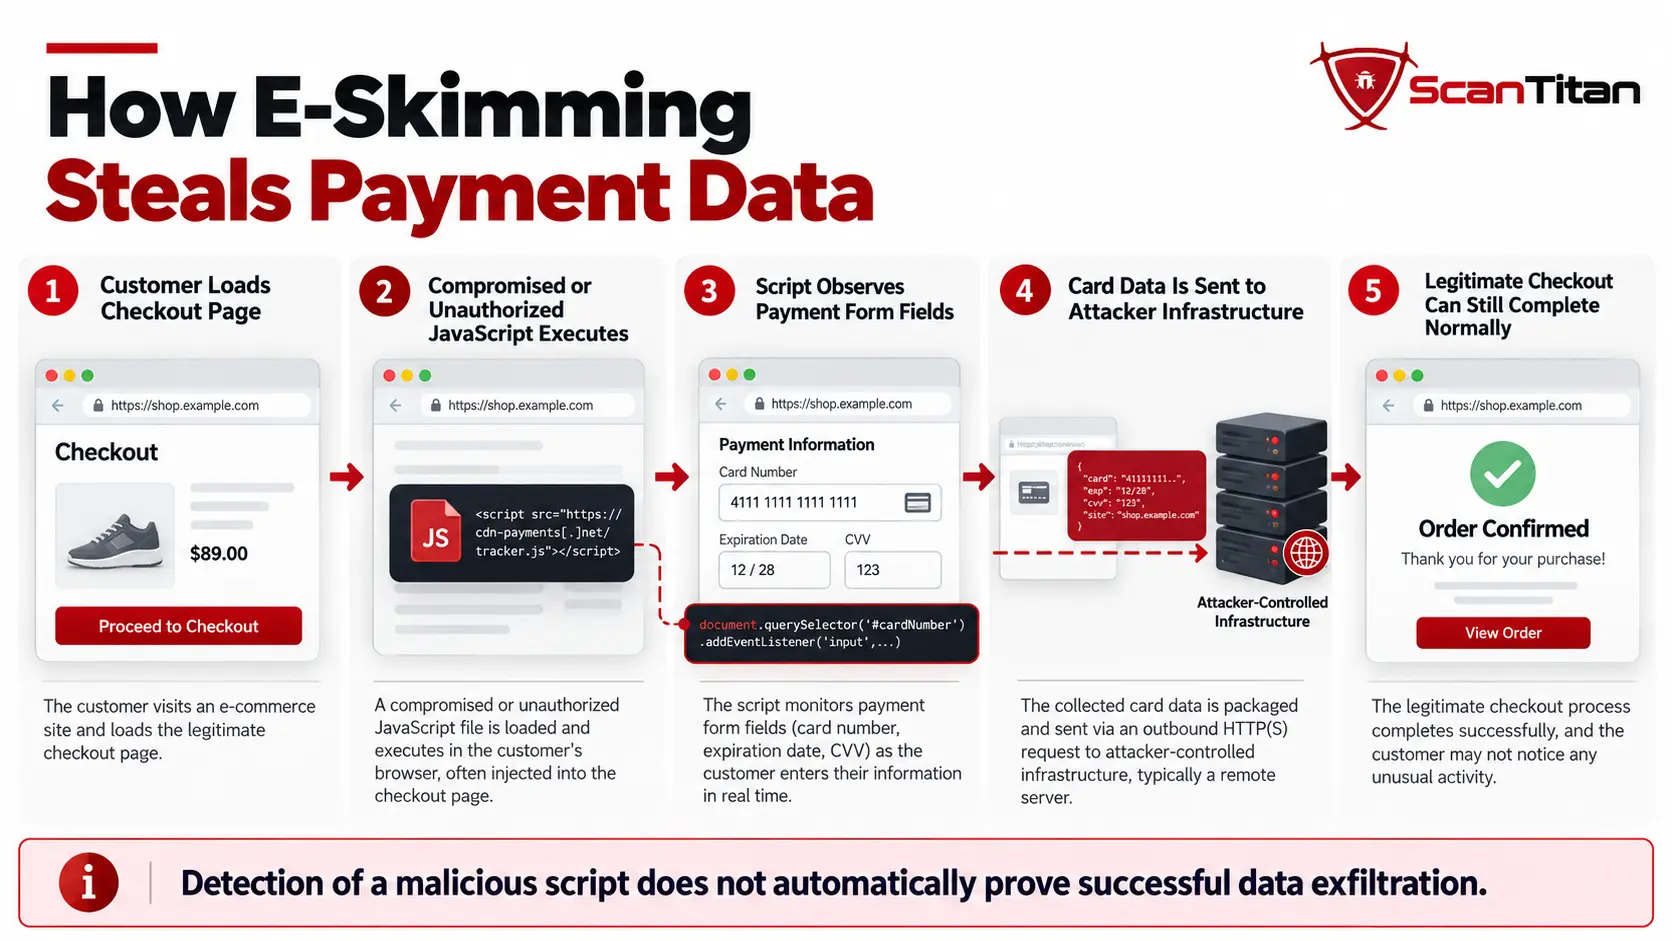
A checkout page can appear to function normally while malicious JavaScript observes or copies form data. This is why browser-side security and third-party script governance matter even when payment processing itself is outsourced.
Web skimming should also be distinguished from ordinary cross-site scripting (XSS). Both can involve attacker-controlled JavaScript, but the vulnerability, injection path and objective can differ.
Detection of a suspicious script is not automatically proof that customer payment data was successfully exfiltrated. Attempt telemetry and confirmed breaches must remain separate.
PCI DSS v4.0.1 and Payment-Page Security
PCI Security Standards Council guidance directly addresses ecommerce script-related risks through Requirements 6.4.3 and 11.6.1.
- Requirement 6.4.3: payment-page scripts must be authorized, justified and protected so their integrity can be assured.
- Requirement 11.6.1: organizations must use change- and tamper-detection mechanisms to identify unauthorized modifications affecting payment pages and relevant HTTP headers.
PCI SSC’s payment-page security and e-skimming guidance explains how these requirements reduce the risk created by malicious or unauthorized browser-side scripts.
The SAQ A Nuance
PCI SSC removed Requirements 6.4.3 and 11.6.1 from the SAQ A questionnaire itself and introduced an eligibility criterion requiring relevant merchants to confirm that their sites are not susceptible to script attacks that could affect ecommerce systems.
The Council explicitly states that this change does not remove or diminish the underlying PCI DSS requirements. The distinction concerns validation through SAQ A, not whether payment-page script security still matters.
See PCI SSC’s SAQ A update for the current wording.
Account Takeover and Credential Stuffing Are Not Data Breach Counts
Retailers face large volumes of credential stuffing, automated login attempts, card testing, scraping and account-takeover activity. These metrics are useful indicators of attack pressure, but they should not be presented as retail data breach totals.
A login attempt becomes a different security measurement from unauthorized access, and unauthorized account access is still not automatically equivalent to a reportable organizational breach.
This article therefore treats bot and account-takeover figures as supporting ecommerce telemetry rather than adding them to the headline retail breach statistics.
Why Detection Speed Matters in Retail Incidents
Initial access and final impact are not the same stage of an intrusion. After access, attackers may steal credentials, move laterally, collect data or prepare extortion before defenders detect them.
Cross-industry Huntress threat telemetry reported median time-to-ransom increasing from 17 to 20 hours as attackers spent more time staging activity and stealing data. That figure is useful operational context, but it is not a retail-specific statistic.
For retailers, the practical point is simpler: reducing the time between unauthorized access and detection can limit whether an intrusion progresses into exfiltration, ransomware or disruption.
Largest Retail Data Breaches by Measurement Type
“Largest retail breach” rankings are easy to distort because different incidents use different measurement units.
A payment card is not a user account, an account is not necessarily a unique person, and scraped information should not automatically be treated as equivalent to private records exfiltrated from a protected database.
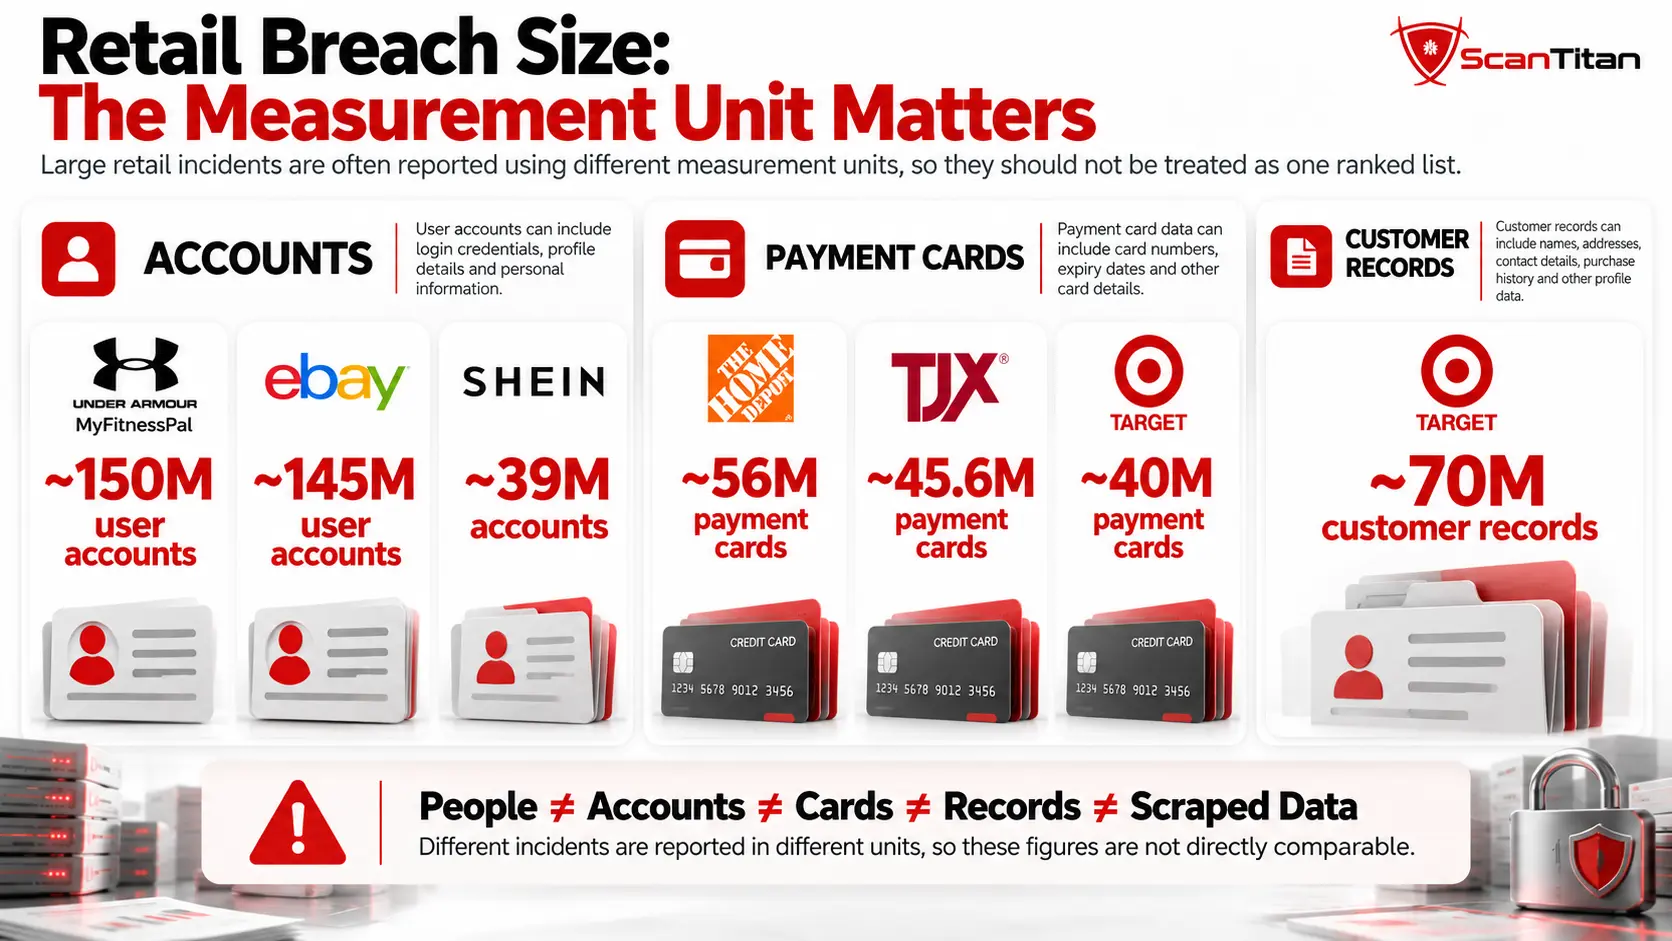
| Organization | Year | Approx. Impact | Measurement Unit | Primary Breach Mechanism |
|---|---|---|---|---|
| Under Armour / MyFitnessPal | 2018 | ~150M | User accounts | Application/database compromise |
| eBay | 2014 | ~145M | User accounts | Compromised employee credentials |
| Target | 2013 | ~110M across different disclosures | Payment cards and customer records | Third-party credentials and POS malware |
| TJX Companies | 2005–2007 | ~45.6M disclosed payment cards | Payment cards | Wireless/network compromise |
| Home Depot | 2014 | ~56M | Payment cards | Compromised vendor access and POS malware |
| Shein | 2018 | ~39M | User/customer accounts | Web/application compromise |
| JD Sports | 2023 disclosure | ~10M | Customers | Unauthorized system access |
| Saks / Hudson’s Bay | 2018 | ~5M | Payment cards | POS compromise |
| Macy’s | 2019 | Not publicly quantified | Checkout/customer data | Web-skimming script |
| Volusion merchants | 2019 | Multiple merchants | Payment data | Upstream ecommerce platform compromise / web skimming |
The table is therefore a normalized comparison rather than a single biggest-to-smallest league table.
Notable Retail Data Breaches Disclosed in 2025–2026
Recent incidents illustrate how different modern retail breaches can look even within the same industry.
Marks & Spencer
Marks & Spencer confirmed that some personal customer information was taken during its 2025 cyber incident. Potentially affected information included contact details, date of birth and online order history.
The company specifically said the affected data did not include usable card or payment details or account passwords. Its official cyber update also describes masked payment-card details and other customer information that could have been involved.
Co-op
Co-op confirmed that attackers copied personal data belonging to members, including names, residential addresses, email addresses, phone numbers and dates of birth.
Co-op’s official incident FAQ states that member passwords, bank details and credit-card information were not extracted from the affected system.
Adidas
Adidas disclosed a data-security incident involving a third-party customer-service provider. The company said potentially affected customer information did not contain passwords, credit-card information or other payment-related data.
This case is useful because it illustrates how a retailer can inherit exposure from a service provider rather than suffering the original compromise entirely inside its own infrastructure.
Five Below
Five Below disclosed a different type of retail incident in July 2026.
According to the company’s SEC filing, a threat actor used social-engineering techniques to gain unauthorized access to an employee’s company-issued computer and exfiltrated files.
Five Below said its investigation found no personally identifiable information was accessed or exfiltrated and that the unauthorized access was limited to the affected employee environment.
The case reinforces an important point: data theft from a retailer does not automatically mean payment-card data or customer PII was stolen.
ASOS US
California’s Attorney General breach-notification database lists ASOS US Sales LLC with a breach date of July 28, 2026.
The California breach-notification database provides a useful example of the regulatory-disclosure datasets that complement technical incident corpora such as Verizon DBIR.
Retail Cyber Risk During Peak Shopping Periods
Black Friday, Cyber Monday and holiday shopping periods create operational conditions that can increase cyberattack pressure:
- higher transaction and login volumes;
- temporary or seasonal staff;
- rapid checkout and promotional changes;
- new marketing and analytics scripts;
- increased API activity;
- credential stuffing and account takeover attempts;
- card testing and other fraud activity.
Increased malicious traffic should not, however, be presented as proof that confirmed retail data breaches increase by the same percentage during peak shopping periods.
Retail Data Breach Reporting and Compliance
Retail breach obligations vary by data type, jurisdiction, corporate structure and the nature of the incident.
PCI DSS
PCI DSS establishes security requirements for environments handling payment-card data. Compliance should not be presented as proof that a retailer cannot suffer a breach.
U.S. State Breach-Notification Laws
Retailers may need to notify individuals and regulators when personal information covered by applicable state law is compromised. Because a single event can trigger filings in multiple states, filing volume is not equivalent to unique intrusion volume.
GDPR and UK GDPR
Retailers processing personal data within applicable European jurisdictions can face supervisory-authority and individual notification obligations when an incident qualifies as a reportable personal-data breach.
SEC Item 1.05
Publicly traded U.S. retailers may also face securities disclosure requirements when a cybersecurity incident is determined to be material. The SEC timing framework is based on the materiality determination rather than simply the technical discovery date.
These frameworks answer different legal questions and should not be collapsed into one universal “retail data breach reporting deadline.”
Retail Data Breach Statistics Commonly Misquoted
Retail cybersecurity numbers often become misleading when a valid statistic is attached to the wrong year, industry, denominator or measurement unit.
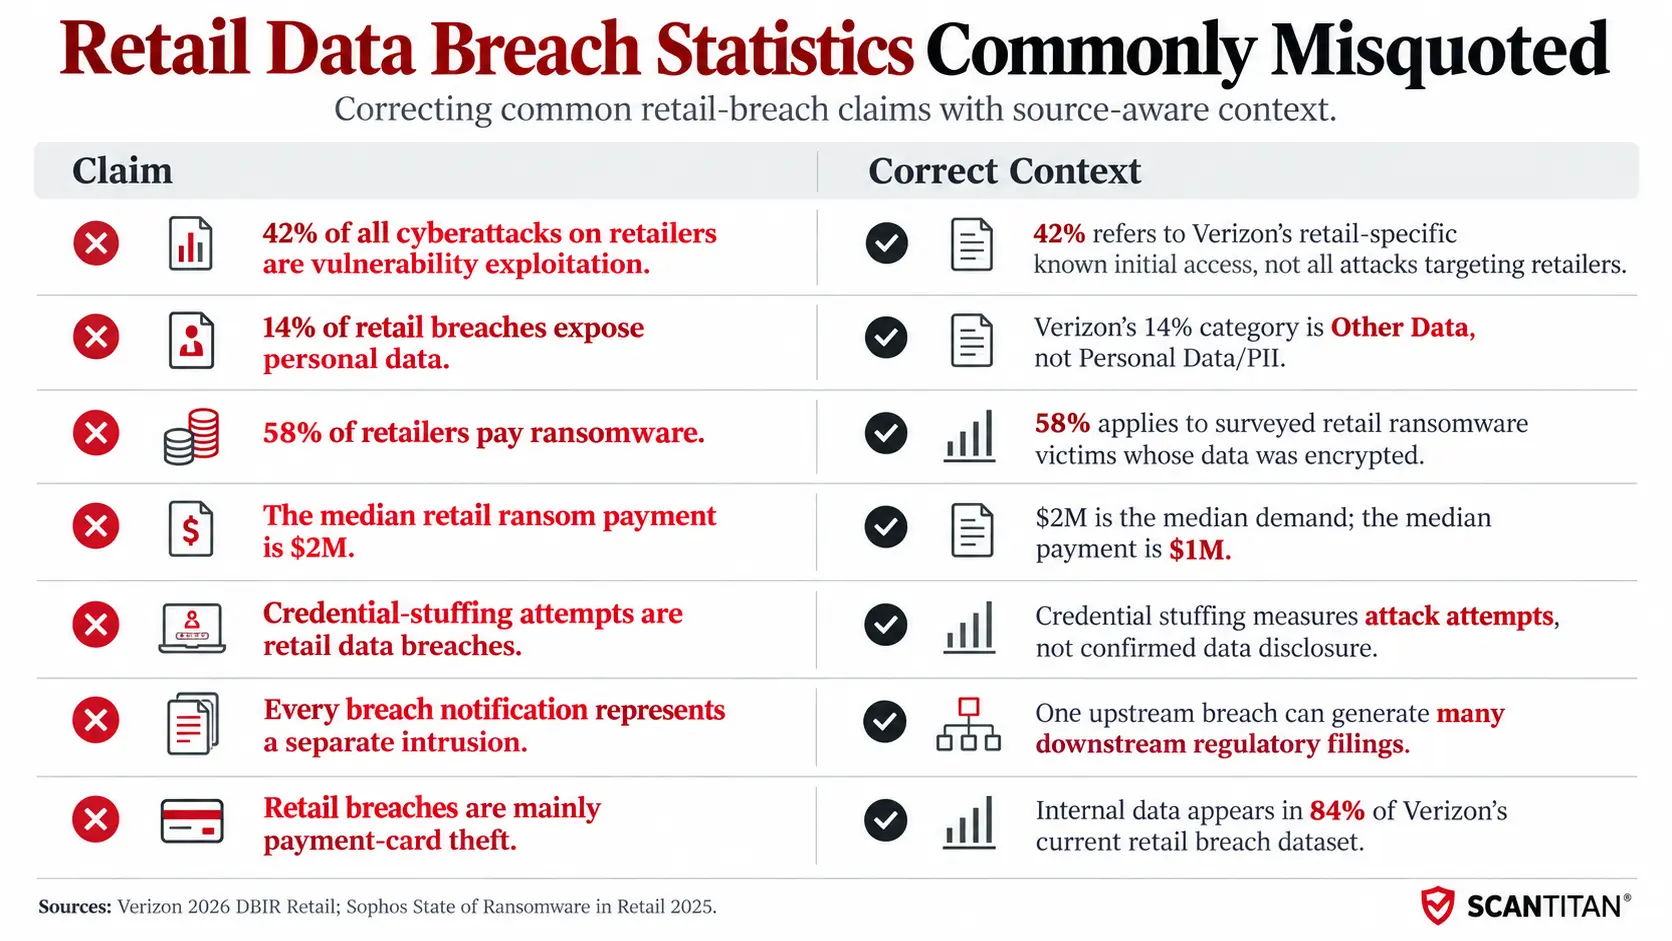
| Common Claim | Correct Context |
|---|---|
| “24% of all cyberattacks target retailers.” | This is a legacy or weakly scoped claim and should not replace current retail-specific breach evidence. |
| Retail vulnerability exploitation equals the global DBIR rate. | Verizon’s retail-specific figure is 42% of known initial access. |
| 14% of retail breaches expose personal data. | Incorrect. Verizon’s 14% category is Other data. |
| 58% of retailers pay ransomware. | The 58% Sophos figure applies to surveyed retail ransomware victims whose data was encrypted. |
| The median retail ransom payment is $2 million. | $2M is the median demand; $1M is the median payment. |
| Credential-stuffing attempts are data breaches. | They measure automated attack activity, not confirmed data disclosure. |
| Every state breach notice represents a separate intrusion. | One upstream incident can generate multiple regulatory filings. |
| Retail breaches are mainly payment-card theft. | Verizon reports Internal data in 84% of current retail breaches. |
What the 2026 Retail Data Shows
Five findings stand out from the current evidence.
- Vulnerability exploitation has become central to retail breach entry. Verizon places exploitation at 42% of known initial access in its retail dataset.
- The retailer itself is only part of the attack surface. Third-party involvement reaches 68%.
- The data attackers want has changed. Internal corporate data appears in 84% of retail breaches.
- Identity and human risk remain important. The human element appears in 58% of retail breaches even though vulnerability exploitation leads the initial-access statistics.
- Retail breach statistics require strict denominator control. Confirmed breaches, public notifications, ransomware surveys, bot traffic and consumer notices describe different populations.
Retail organizations with public web applications and APIs can use website vulnerability scanning as one part of identifying internet-facing security weaknesses, but automated scanning should complement—not replace—secure development, configuration review, monitoring and manual security testing.
Research Methodology and Limitations
This research prioritizes original research reports, regulators, standards bodies, company disclosures and sector surveys with explicit denominators.
Counting Rules
- Security incidents are not automatically counted as confirmed data breaches.
- Notification filings are not automatically treated as unique intrusions.
- Victim counts are not added to incident counts.
- Ransomware survey responses are not treated as a breach census.
- Bot activity and credential-stuffing attempts are not counted as data breaches.
- Payment cards, accounts, people and records are treated as different measurement units.
- Scraped information is not automatically described as private database exfiltration.
- Attacker-claimed breach sizes require independent qualification.
Dataset Limitations
Verizon DBIR is a contributed incident corpus, not a census of every retail breach worldwide.
Privacy Rights Clearinghouse depends on publicly available U.S. breach-notification records.
Sophos ransomware metrics describe surveyed organizations that experienced ransomware and should not be generalized to every retailer.
Historical breach estimates may change as investigations, company disclosures and regulatory records are updated.
For more detail on why major breach datasets can produce apparently conflicting numbers, see ScanTitan’s Data Breach Statistics 2026 methodology.
Retail Data Breach Statistics 2026: Full Reference Table
| Statistic | Value | Dataset / Scope |
|---|---|---|
| Retail security incidents | 997 | Verizon 2026 |
| Confirmed retail breaches | 806 | Verizon 2026 |
| Top-three breach patterns | 95% | Verizon retail breaches |
| Vulnerability exploitation | 42% | Retail initial access |
| Credential abuse | 14% | Retail initial access |
| Phishing | 9% | Retail initial access |
| Third-party involvement | 68% | Retail breaches |
| Human element | 58% | Retail breaches |
| External actors | 99% | Retail breaches |
| Internal actors | 1% | Retail breaches |
| Financial motive | 85% | Retail breaches |
| Espionage motive | 19% | Retail breaches |
| Internal data compromised | 84% | Retail breaches |
| Credentials compromised | 26% | Retail breaches |
| Secrets compromised | 20% | Retail breaches |
| Other data | 14% | Retail breaches |
| U.S. retail breach events | 126 | PRC 2025 |
| U.S. retail breach events | 56 | PRC H1 2026 |
| H1 2026 retail affected count | ~0.3M | PRC |
| Global average breach cost | $4.99M | IBM 2026 |
| Retail breach cost | ~$3.80M | IBM-derived 2026 industry data |
| Retail ransomware encryption rate | 48% | Sophos 2025 retail ransomware survey |
| Encrypted retail victims paying | 58% | Sophos 2025 |
| Median retail ransom demand | $2M | Sophos 2025 |
| Median retail ransom payment | $1M | Sophos 2025 |
| Mean ransomware recovery cost | $1.65M | Sophos 2025, excluding ransom |
| Exploited vulnerability as ransomware root cause | 30% | Sophos 2025 retail ransomware survey |
Primary Sources
Frequently Asked Questions
How many retail data breaches occurred in 2026?
There is no single worldwide census. Verizon’s 2026 retail dataset contains 806 confirmed retail breaches, while Privacy Rights Clearinghouse separately recorded 56 publicly reported U.S. retail breach events during H1 2026. The figures should not be added because they use different populations and methodologies.
What is the most common initial access vector in retail data breaches?
In Verizon’s retail-specific 2026 dataset, vulnerability exploitation leads at 42%, followed by credential abuse at 14% and phishing at 9%.
What percentage of retail data breaches involve third parties?
Verizon reports 68% third-party involvement in its 2026 retail breach dataset.
What data is most commonly compromised in retail breaches?
Internal corporate data is the leading category at 84%, followed by credentials at 26% and secrets at 20%. Verizon’s 14% category is “Other,” not personal data.
How much does a retail data breach cost?
IBM-derived 2026 industry data places the retail-sector average at approximately $3.80 million, compared with IBM’s $4.99 million global cross-industry average.
What percentage of retail ransomware victims pay?
Sophos reports that 58% of surveyed retail organizations whose data was encrypted paid a ransom to recover data. That percentage does not apply to all retailers or all retail breaches.
Are retail data breaches mainly payment-card breaches?
Not in Verizon’s current dataset. Internal corporate data appeared in 84% of retail breaches, showing that modern retail attacks increasingly target broader business data, credentials and secrets.
Why do retail data breach statistics differ between reports?
Different sources measure different populations. Verizon analyzes contributed incidents and confirmed breaches, Privacy Rights Clearinghouse tracks public U.S. breach notifications, IBM studies breach economics, Sophos surveys ransomware victims, and bot-security vendors measure attack telemetry.
Are credential-stuffing attempts counted as retail data breaches?
No. Credential stuffing measures automated attempts to gain unauthorized account access. Those attempts should not be counted as confirmed organizational data breaches.
Which PCI DSS requirements address ecommerce payment-page scripts?
PCI DSS v4.0.1 Requirements 6.4.3 and 11.6.1 address payment-page script authorization and integrity, along with detection of unauthorized changes or tampering affecting payment pages.