investigations or telemetry.The latest 2025–2026 evidence therefore does not support one universal number for “how many cyberattacks happen worldwide.” Instead, the strongest current data shows several changes happening at the same time: vulnerability exploitation has become a leading breach entry point, ransomware remains present in a large share of confirmed breaches, identity and third-party compromise continue to matter, vulnerability disclosure is accelerating, and attackers are operating faster across cloud, application and network environments.
phishing reports, insurance claims and vendor detections are different measurements.
They should not be added together or treated as competing estimates of one worldwide
cyberattack total. Every statistic below is kept with its source, population and
measurement period.
Last updated: September 17, 2026. Live databases, quarterly reports and partial-year
figures are date-stamped because 2026 totals can continue to change.
Executive Benchmark: Cybersecurity Statistics 2025–2026
The table below summarizes the strongest current cybersecurity benchmarks from primary and first-party datasets. Figures are prioritized by recency, source quality and measurement clarity rather than by how dramatic the number appears.
| Metric | Latest verified figure | Trend | Data timeframe | Source |
|---|---|---|---|---|
| Global average data-breach cost | $4.99 million | ▲ 12% YoY | 2026 study | IBM Cost of a Data Breach 2026 |
| Breaches beginning with vulnerability exploitation | 31% | ▲ Leading entry point | Nov 2024–Oct 2025 | Verizon 2026 DBIR |
| Confirmed breaches involving ransomware | 48% | ▲ Highest share in DBIR series | Nov 2024–Oct 2025 | Verizon 2026 DBIR |
| Breaches involving third parties | 48% | ▲ 60% increase | Nov 2024–Oct 2025 | Verizon 2026 DBIR |
| CVE Records published | 48,244 | ▲ 20.4% YoY | Calendar 2025 | CVE Program Metrics |
| CVE Records published in H1 2026 | 35,872 | n/a — partial year | Jan–Jun 2026 | CVE Program Metrics |
| Zero-days exploited in the wild | 90 | ▲ From 78 in 2024 | Calendar 2025 | Google Threat Intelligence Group |
| Reported phishing attacks | 1,069,681 | ▲ 10.1% QoQ | Apr–Jun 2026 | APWG Q2 2026 |
| FBI internet-crime complaints | 1,008,597 | — | Calendar 2025 | FBI IC3 2025 Annual Report |
| FBI reported internet-crime losses | $20.877 billion | ▲ 26% YoY | Calendar 2025 | FBI IC3 2025 Annual Report |
| Identity attacks that were password attacks | 97% | ▲ Identity attacks +32% | H1 2025 | Microsoft Digital Defense Report 2025 |
| Malware-free detections | 82% | ▲ | Calendar 2025 | CrowdStrike 2026 Global Threat Report |
| Average eCrime breakout time | 29 minutes | ▼ Faster attacker movement | Calendar 2025 | CrowdStrike 2026 Global Threat Report |
| DDoS attacks above 1 Tbps | 935 | ▲ Q2 surge | Jan–Jun 2026 | Cloudflare H1 2026 |
| Malicious open-source packages detected | 21,764 | ▲ | Q1 2026 | Sonatype Q1 2026 |
| New hardcoded secrets in public GitHub commits | 28.65 million | ▲ 34% YoY | Calendar 2025 | GitGuardian 2026 |
| AI-driven attack activity | +56% | ▲ | 2026 breach study | IBM Cost of a Data Breach 2026 |
Trend key:
▲ increase ·
▼ decrease ·
→ broadly unchanged ·
n/a = no directly comparable previous-period figure verified.
The important finding is not simply that “cyberattacks are increasing.” Different datasets show different parts of the threat landscape moving at different speeds, Verizon found vulnerability exploitation leading breach entry, while Microsoft and CrowdStrike show the continuing importance of passwords, valid accounts and malware-free intrusion activity, CVE publication volume is rising, but only a fraction of disclosed vulnerabilities become actively exploited. At the same time, ransomware remains heavily represented in confirmed breaches, third-party involvement has increased, and DDoS attacks are reaching larger network volumes. These findings are not contradictory because each source measures a different part of
the cybersecurity ecosystem.
Cybersecurity statistics are easy to misuse because a breach, incident, victim notice, phishing report, CVE, known exploited vulnerability, insurance claim and vendor detection are not equivalent measures. The strongest 2026 data shows vulnerability exploitation has become the leading breach entry point in Verizon’s DBIR, ransomware appears in nearly half of confirmed breaches, third-party involvement has risen sharply, public CVE disclosure continues to accelerate, and identity and AI-related activity are reshaping attack paths.
This research keeps each denominator, timeframe and source separate so breach data, attack telemetry, vulnerability records, claims and government reports remain useful rather than being blended into one misleading global total.
Key 2026 findingThere is no single authoritative count of “cyberattacks in 2026.” Verizon reports breach patterns, IBM measures breach costs, APWG counts reported phishing attacks, Cloudflare measures DDoS traffic on its network, the FBI counts complaints and reported losses, and the CVE Program tracks published vulnerability records. Those datasets answer different questions.
Last updated: September 17, 2026. Counts from live databases and midyear reports are date-stamped because they can change as 2026 progresses.
Key Cybersecurity Statistics for 2026
The strongest cybersecurity statistics for 2026 point to a common pattern: attackers are exploiting exposed software and identities faster, third-party dependencies are appearing in more breaches, and the cost of a confirmed breach remains high. The benchmark below prioritizes threat and breach measures rather than mixing in every workforce, spending or market-size statistic.
How We Selected and Compared the 2026 Cybersecurity Statistics
This research uses the number, denominator, timeframe and source together. A percentage from breach investigations cannot be compared directly with a percentage from vendor telemetry, a survey, a vulnerability database, an insurance portfolio or a government notification archive. Primary and first-party datasets are preferred wherever possible.
| Source | Latest dataset used | What it actually measures | Useful headline figure |
|---|---|---|---|
| Verizon DBIR | 2026 | Confirmed incidents and breaches in the DBIR corpus | Vulnerability exploitation 31%; ransomware 48%; third-party involvement 48% |
| IBM / Ponemon | Cost of a Data Breach 2026 | Costs from organizations that experienced analyzed breaches | $4.99M global average breach cost |
| Privacy Rights Clearinghouse | H1 2026 | Public notification filings normalized into distinct events | 5,429 filings → 1,969 events → 343.1M reported exposures |
| ITRC | H1 2026 | Publicly reported U.S. data compromises and victim notices | 1,803 compromises; 471.2M victim notices |
| APWG | Q2 2026 | Reported phishing attacks | 425,808 attacks in June; Q2 volume +10.1% |
| Cloudflare | H1 2026 | DDoS traffic observed and mitigated on Cloudflare’s network | 935 attacks above 1 Tbps |
| CVE Program / NIST | 2025–H1 2026 | Published CVE Records and NVD enrichment activity | 48,244 CVEs in 2025; 35,872 in H1 2026 |
| Google Threat Intelligence Group | 2025 zero-day review, published 2026 | Detected and disclosed zero-days exploited before a public patch | 90 zero-days tracked in 2025 |
| Rapid7 | 2026 Global Threat Landscape | High/critical disclosures and confirmed exploitation in Rapid7’s research dataset | 146 newly disclosed high/critical vulnerabilities confirmed exploited in 2025 |
| Sonatype / GitGuardian | 2026 reports | Malicious packages and exposed source-code secrets | 21,764 malicious packages in Q1; 28.65M new public secrets in 2025 |
| Microsoft / CrowdStrike / Mandiant | 2025–2026 reports | Threat telemetry and incident-response data | 97% of Microsoft identity attacks were password attacks; 82% of CrowdStrike detections were malware-free |
| ENISA | Threat Landscape 2025 | 4,875 analyzed EU cybersecurity incidents | DDoS 77% of analyzed incidents; ransomware remained the most impactful threat |
| FBI IC3 | 2025 Annual Report | Victim-submitted U.S. internet-crime complaints and reported losses | 1,008,597 complaints; $20.877B reported losses |
| Coalition | 2026 Cyber Claims Report | Cyber insurance claims across 100,000+ global policyholders during 2025 | BEC and funds-transfer fraud represented 58% of claims |
| UK DSIT / Home Office | Cyber Security Breaches Survey 2025/2026 | Survey of UK businesses, charities and education institutions | 43% of businesses reported a breach or attack in the previous 12 months |
| ASD / ACSC | Annual Cyber Threat Report 2024–25 | Australian cybercrime reports, hotline activity and incident response | 84,700+ cybercrime reports; 1,200+ incidents responded to |
Why 2026 Data Breach Counts Disagree
Two reputable breach trackers can report different totals without either being wrong. Privacy Rights Clearinghouse counts public notification filings and then deduplicates them into breach events, while ITRC maintains a separate compromise database with its own sources and inclusion rules. IBM and Verizon measure something else again: one is a cost study and the other is a breach-pattern corpus.
| 2026 measure | Figure | Unit being counted | Why it differs |
|---|---|---|---|
| PRC notification filings, H1 | 5,429 | Government notification filings | One breach can generate multiple filings across states |
| PRC distinct breach events, H1 | 1,969 | Deduplicated events | PRC groups related filings into a single event |
| PRC affected total, H1 | 343.1M | Reported exposures, not unique people | Includes the unverified 275M Canvas figure and can count one person more than once |
| ITRC data compromises, H1 | 1,803 | Compromises in ITRC’s database | Different sources, inclusion rules and entry-date methodology |
| ITRC victim notices, H1 | 471.2M | Victim notices / affected identities | Not equivalent to unique individuals or PRC event counts |
| IBM breach-cost sample | 602 organizations | Organizations suffering analyzed breaches | A cost study, not a census of breaches worldwide |
| Verizon DBIR | 22,000+ confirmed breaches | Contributed confirmed-breach corpus | Used to analyze patterns, not to estimate every breach globally |
Privacy Rights Clearinghouse reported 5,429 filings describing 1,969 distinct breach events in H1 2026, while ITRC tracked 1,803 data compromises over the same half-year period. The totals differ because the organizations measure and deduplicate events differently. Sources: Privacy Rights Clearinghouse and ITRC.
Do not combine unlike unitsThere is no single authoritative count of “cyberattacks in 2026.” Different sources measure attack attempts, incidents, confirmed breaches, notification filings, victim notices, vulnerabilities, exploitation, claims and financial loss. Those units should be compared only when their methodology matches.
Cyberattack, Data Breach and Threat Statistics for 2026
Cybersecurity data is strongest when it is broken down by attack type and measurement system. Breach databases describe confirmed or reported outcomes, while phishing, DDoS, identity and insurance datasets describe other layers of the threat landscape.
Data Breach Statistics
Privacy Rights Clearinghouse recorded 1,969 distinct breach events from 5,429 notification filings in H1 2026, affecting a reported 343.1 million exposures. The event count was 10% lower than H1 2025, but the reported exposure total more than doubled because a 275-million-person figure associated with the Instructure/Canvas breach dominated the dataset.
PRC explicitly notes that the 275 million Canvas figure originated with the attackers and has not been independently verified. Without it, H1 reported exposures fall to roughly 68 million. A single mega-breach can therefore distort exposure trends even when the number of underlying events falls.
ITRC separately recorded 1,803 compromises in H1 2026, including 1,029 in Q2, and estimated 471.2 million victim notices. Only 24% of H1 notices identified the attack vector. For website-specific attack and compromise measurements, see ScanTitan’s website hacking statistics.
Cybercrime Complaints and Financial Losses
The FBI Internet Crime Complaint Center’s 2025 Annual Report, published in 2026, recorded 1,008,597 complaints and $20.877 billion in reported losses. Reported losses increased 26% from 2024, and the average reported loss was $20,699 per complaint.
IC3 figures should not be treated as the total economic cost of cybercrime. They measure complaints submitted to the FBI and the losses reported in those complaints, not every cybercrime event or unreported loss.
Phishing and Social Engineering Statistics
APWG reported a 10.1% quarter-over-quarter rise in phishing attacks in Q2 2026. June reached 425,808 attacks, the highest monthly total since April 2023. Smishing increased 40% from Q1 to Q2, wire-transfer BEC attacks rose 88%, and the attempted amount per BEC attack increased 45% to $61,732.
For the full source-by-source analysis, including APWG attack volume, Microsoft email detections, FBI complaints and BEC losses, mobile phishing, AI-assisted attacks, regional data and methodology differences, see our Phishing Statistics 2026 research.
The human attack surface is increasingly multi-channel. Verizon’s 2026 DBIR found mobile social-engineering success rates were 40% higher than email, while Microsoft’s 2025 Digital Defense Report says identity-based attacks rose 32% in H1 2025 and 97% of identity attacks were password attacks.
Mobile Security Statistics
Verizon’s 2026 DBIR found that mobile-centric social engineering using fake texts and voice calls achieved a 40% higher success rate than traditional email phishing. The report also found that 41% of Social Engineering breaches involved vectors beyond email, including phones and social media.
Zimperium’s 2026 Global Mobile Threat Report adds vendor-specific telemetry: phishing events detected on employee mobile devices increased 380% since January 2025, while devices on which employees clicked a malicious link increased 110% during 2025. These are Zimperium telemetry figures, not estimates of every mobile device worldwide.
Ransomware Statistics
Verizon’s 2026 DBIR found ransomware involved in 48% of confirmed breaches, its highest reported share in the series. ScanTitan’s dedicated ransomware statistics research covers prevalence, payment and recovery data in more detail.
Sophos’s State of Ransomware 2026 surveyed 2,158 organizations affected by ransomware. It found 79% of attacks began with an identity-based approach, 56% succeeded in encrypting data, and 48% of organizations whose data was encrypted paid a ransom. Average recovery cost, excluding the ransom itself, reached $1.7 million.
In Sophos’s dataset, malicious email accounted for 26% of reported root causes, phishing 24%, compromised credentials 23%, and exploited vulnerabilities 18%. These percentages describe the surveyed ransomware population rather than all cyberattacks.
Reported Ransomware Root Causes
Share of reported root causes in Sophos’s 2026 ransomware survey of affected organizations.
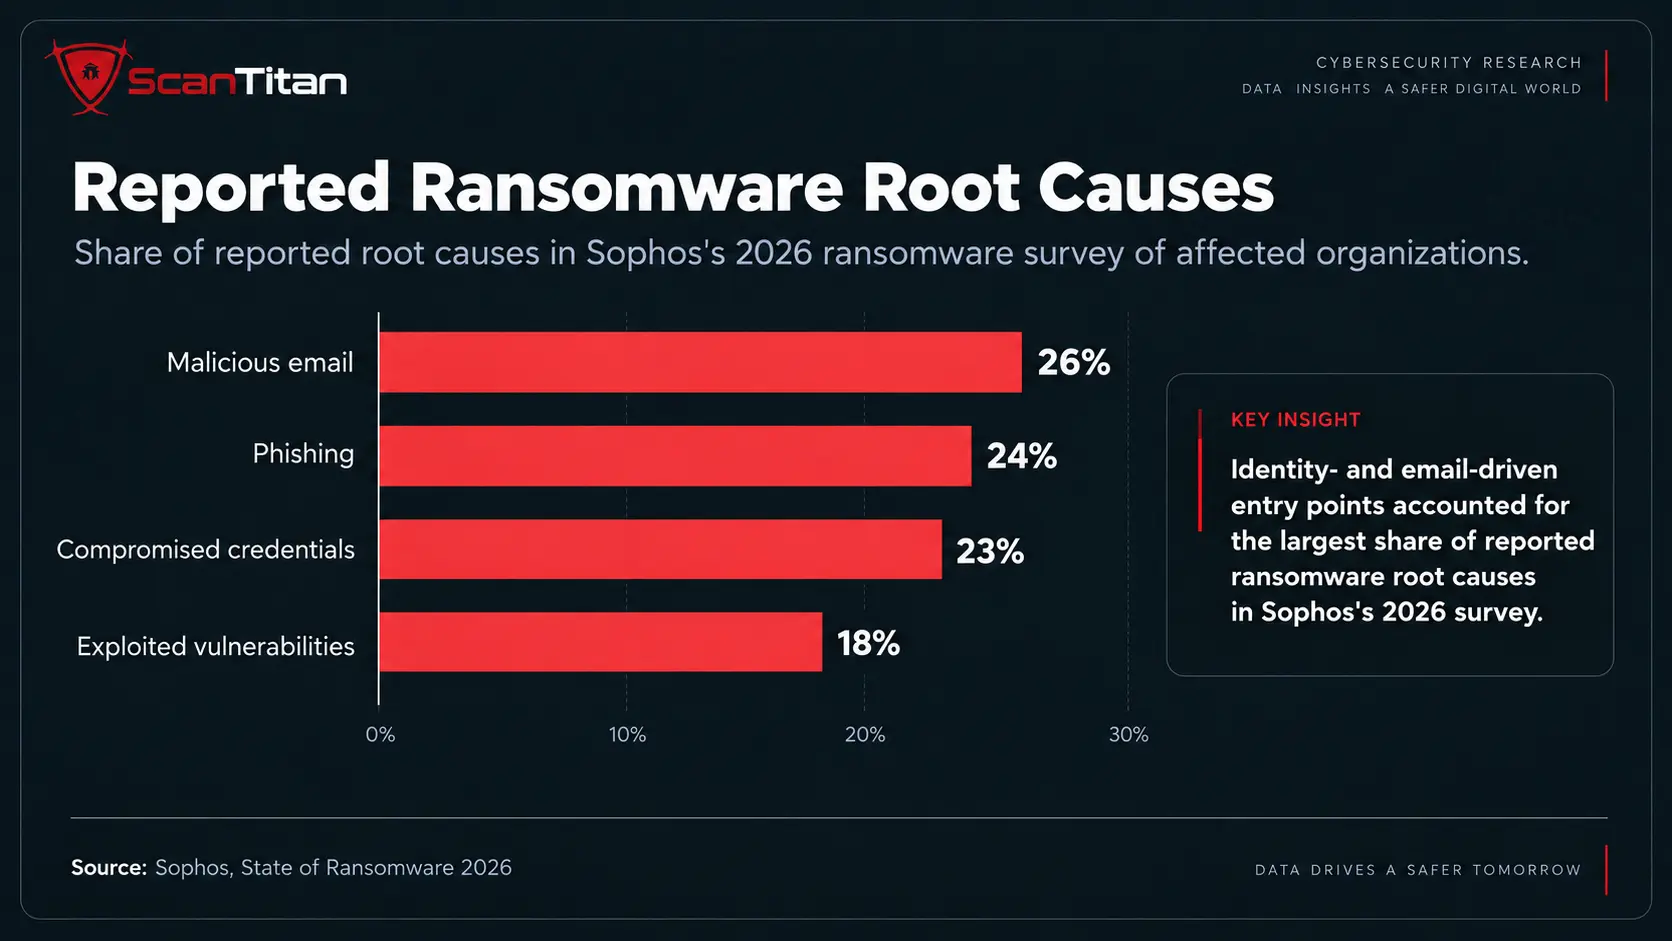
Source: Sophos, State of Ransomware 2026.
These shares describe Sophos’s surveyed ransomware population; they should not be generalized to all cyberattacks.
Chainalysis estimates ransomware operators received $820 million in on-chain payments in 2025, about 8% below its updated 2024 figure. The median payment still increased 368% to nearly $60,000, showing why aggregate payment totals and per-victim payment size can move in different directions.
Identity, Password and Credential Theft Statistics
Microsoft’s 2025 Digital Defense Report says 97% of identity attacks were password attacks, while identity-based attacks increased 32% in H1 2025. That telemetry reflects Microsoft’s ecosystem rather than every identity attack worldwide, but it shows why passwords and valid accounts remain a central attack path.
Credential theft also intersects with phishing and infostealers. Microsoft’s report identified Lumma Stealer as its most prevalent observed infostealer during the October 2024–October 2025 reporting period. Verizon’s broader breach research likewise shows credential abuse remains a major action even as vulnerability exploitation has moved into the leading initial-access position.
Malware and Malware-Free Intrusions
CrowdStrike reported that 82% of its 2025 detections were malware-free. In its telemetry, attackers increasingly relied on valid credentials, legitimate administration tools and hands-on-keyboard activity rather than conventional malware. Average eCrime breakout time fell to 29 minutes, while the fastest observed breakout took 27 seconds.
This does not mean malware is disappearing. It means “malware detections” alone are an incomplete measure of modern intrusion activity.
DDoS Attack Statistics
Cloudflare mitigated 935 network-layer DDoS attacks exceeding 1 Tbps during H1 2026. The number of attacks above that threshold increased 519% from Q1 to Q2. DNS-based attacks represented 34.3% of network-layer activity across the half.
Media, production and publishing received 14.2% of mitigated HTTP DDoS requests in Cloudflare’s H1 dataset, its largest industry share. These figures measure traffic on Cloudflare’s network, not every DDoS attack worldwide. For the broader web layer, ScanTitan’s website security statistics research covers DDoS, bots, web controls and CMS exposure in more detail.
The European picture looks different because ENISA analyzes an incident corpus rather than network telemetry. DDoS accounted for 77% of 4,875 incidents in its 2025 Threat Landscape, while ransomware remained the most impactful threat.
AI-Enabled Cyberattack, Defense and Shadow AI Statistics
IBM’s 2026 Cost of a Data Breach research found AI-driven attacks increased 56%, while one in four malicious breaches in the study were AI-enabled. AI-enabled breaches averaged about $6 million, roughly $1 million above the study’s global breach average. More than 20% of organizations reported a breach targeting AI models or applications.
The surrounding systems were often the weak point. IBM found 27% of AI-targeting breaches involved compromised APIs, applications or plugins, while another 27% involved cloud misconfigurations affecting AI workloads. At the same time, extensive AI and automation use in security reduced breach costs by an average $1.93 million compared with organizations using none.
Verizon’s 2026 DBIR adds a governance dimension: 45% of employees were regular users of AI services on corporate devices, up from 15% in the previous year, while 67% of users accessing AI services did so through non-corporate accounts. Verizon describes this unauthorized or unmanaged use as “Shadow AI.”
CrowdStrike separately reported an 89% year-over-year increase in AI-enabled adversary activity in its 2026 Global Threat Report. IBM, Verizon and CrowdStrike use different definitions and datasets, so these figures should remain attributed to their own methodologies.
Vulnerability, Exploitation, Supply-Chain and Infrastructure Statistics
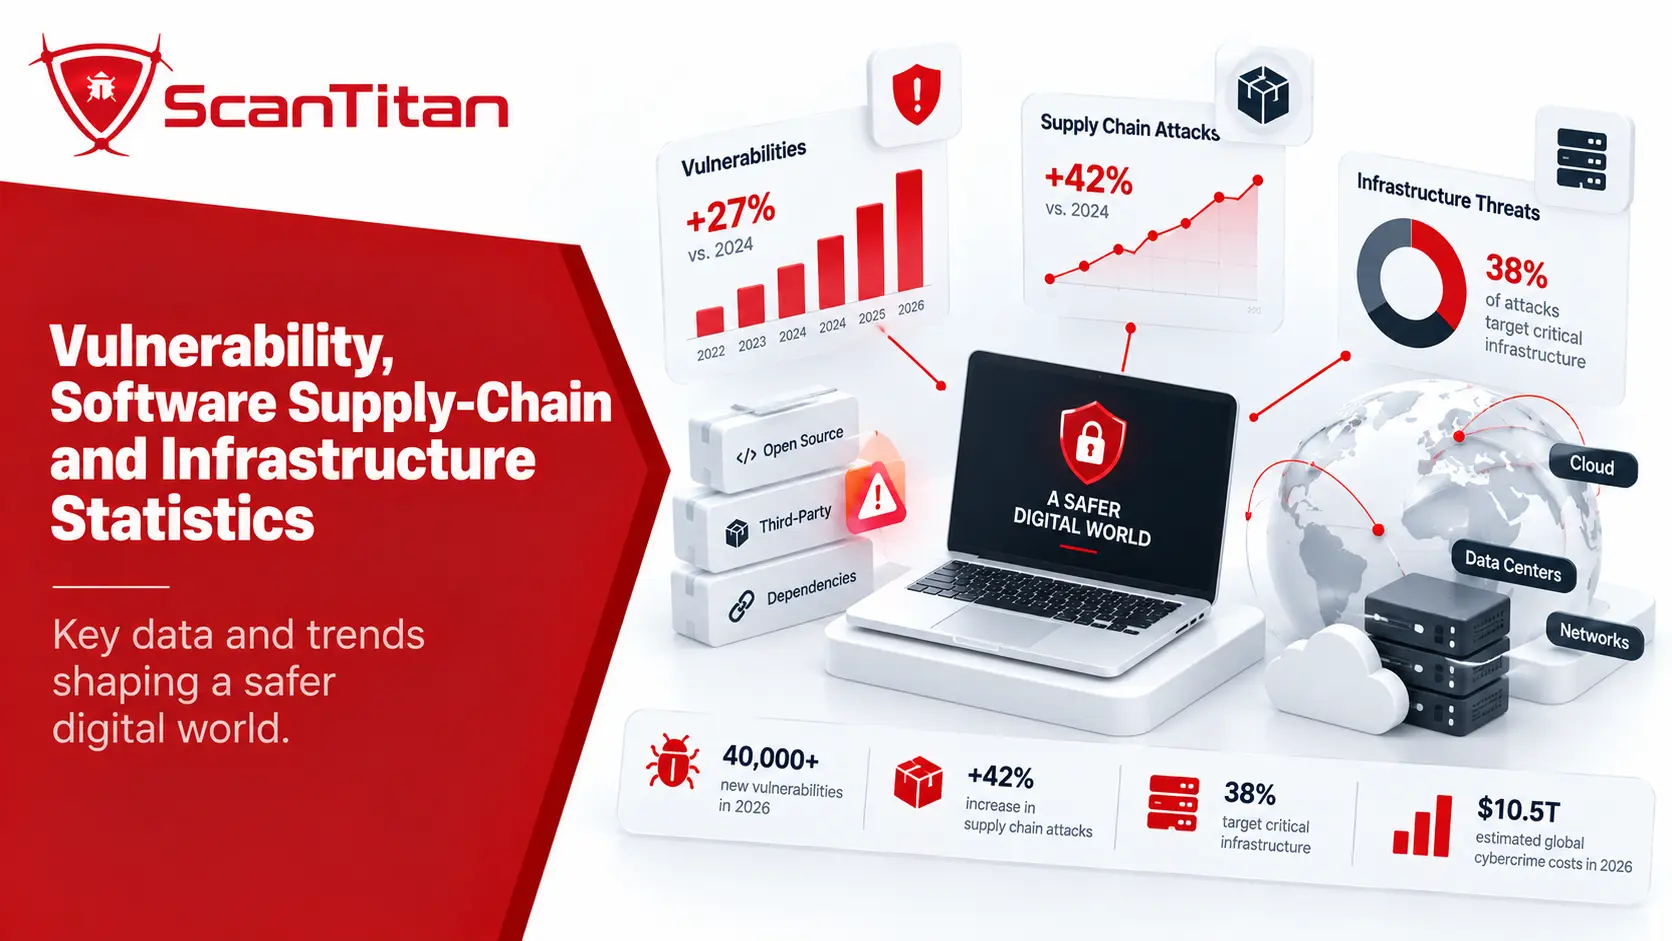
Vulnerability Disclosure and Exploitation
The official CVE Program published 48,244 CVE Records in 2025, up from 40,077 in 2024, an increase of about 20.4%. Its current metrics snapshot shows another 35,872 records across Q1 and Q2 2026: 15,163 in Q1 and 20,709 in Q2. Because the year is unfinished, 35,872 is an H1 snapshot rather than a full-year total.
NIST reported that CVE submissions increased 263% from 2020 to 2025. NIST enriched nearly 42,000 CVEs in 2025, 45% more than any previous year, but still could not keep pace with submission growth.
Published CVE Records
2026 is H1 only, so the 35,872 figure is a partial-year snapshot rather than a full-year comparison.
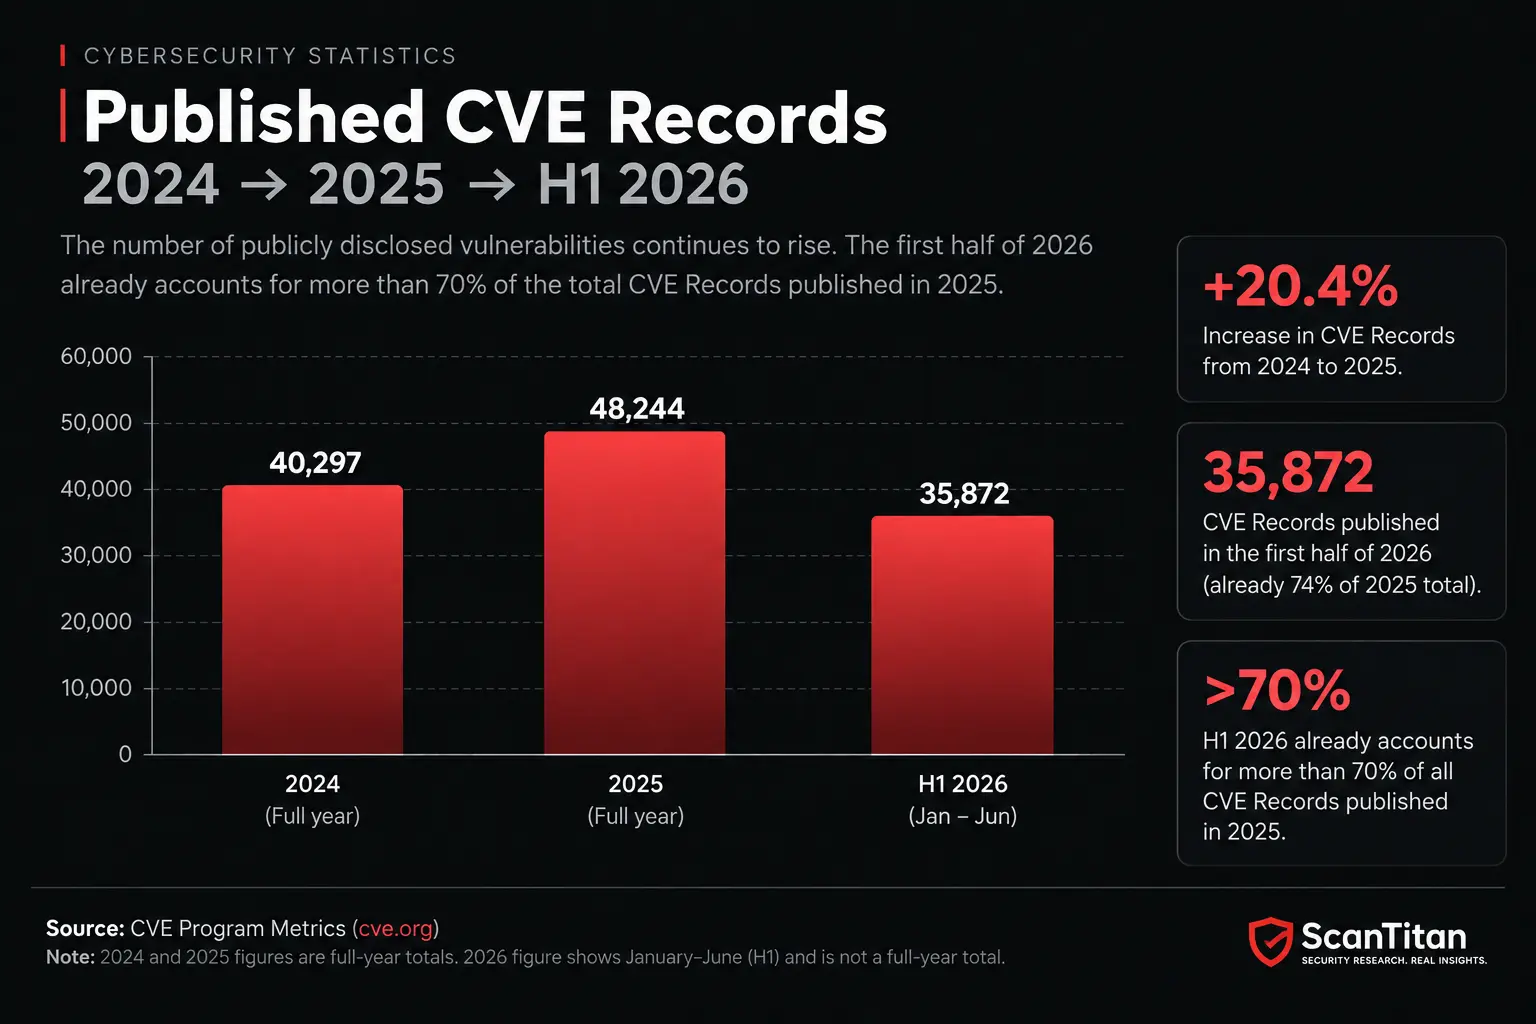
Source: CVE Program metrics.
H1 2026 must not be interpreted as a complete calendar-year total.
The exploitation picture is more important than the raw record count. Verizon’s 2026 DBIR found vulnerability exploitation initiated 31% of breaches, making it the leading breach entry point for the first time. ScanTitan’s deeper vulnerability statistics research tracks disclosure, exploitation and remediation trends separately.
Zero-Day, KEV and EPSS Statistics
Google Threat Intelligence Group tracked 90 zero-day vulnerabilities exploited in the wild during 2025, up from 78 in 2024 but below the 2023 high of 100. Enterprise technologies accounted for 43 of the 90 zero-days, or 48%, the highest share Google had recorded.
Zero-Days Exploited in the Wild
Google Threat Intelligence Group’s tracked zero-day exploitation totals.
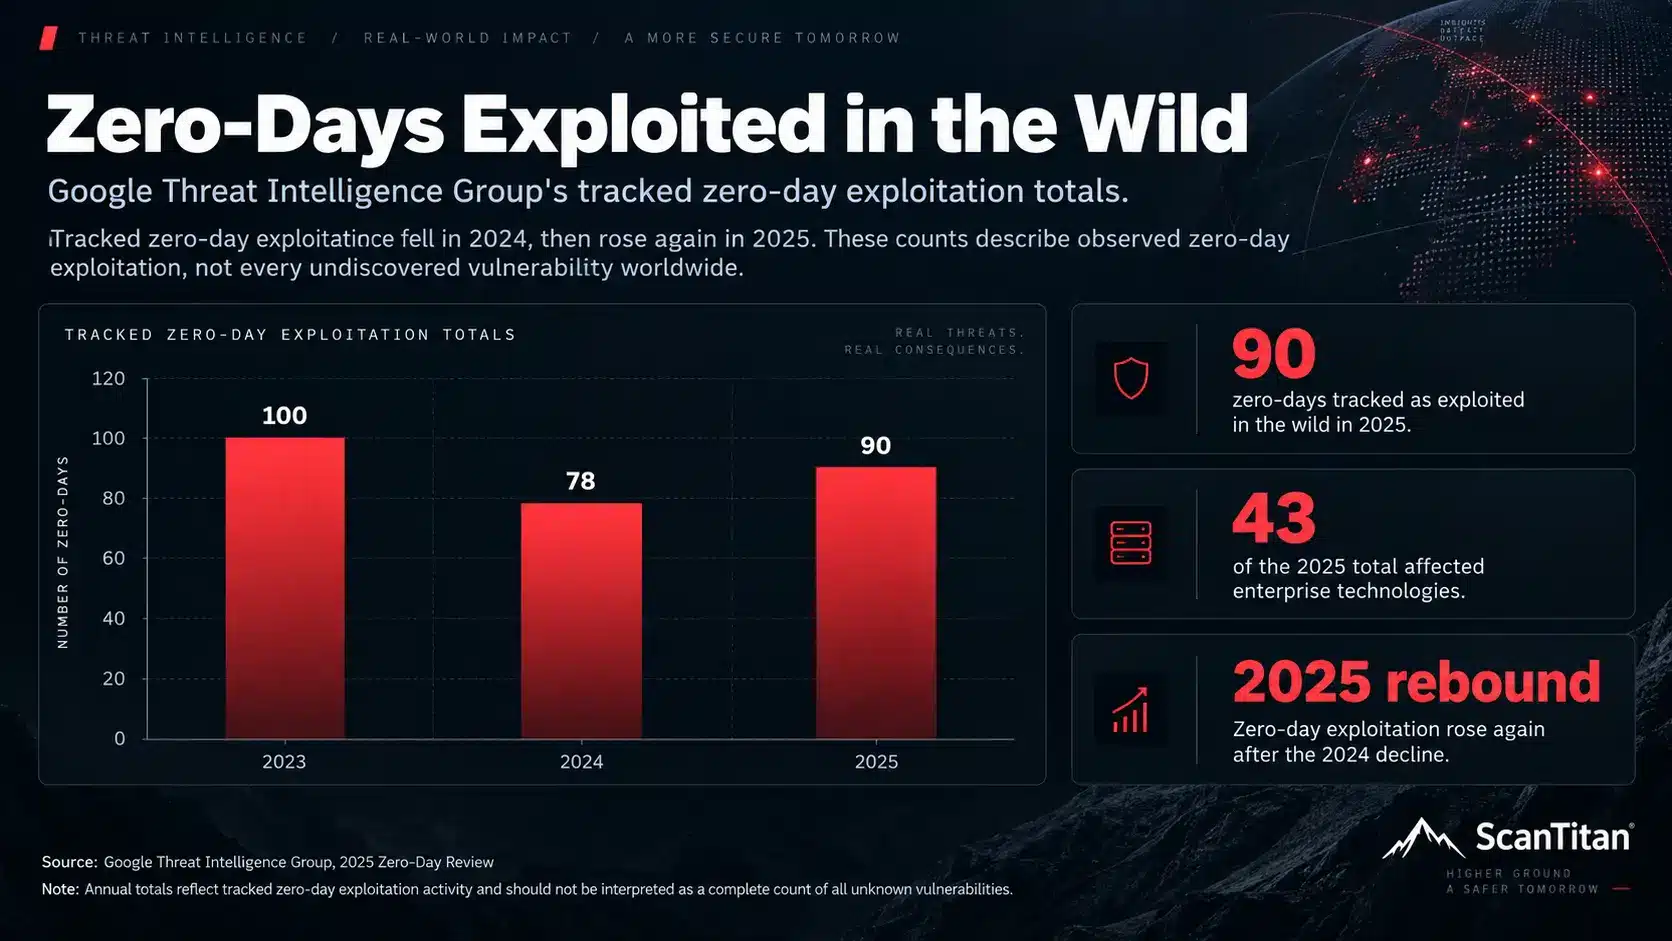
Source: Google Threat Intelligence Group, 2025 Zero-Day Review.
Zero-day totals depend on the vulnerabilities Google tracked and disclosed; they are not a count of every undiscovered or unreported zero-day worldwide.
CISA’s Known Exploited Vulnerabilities (KEV) Catalog is different from a zero-day list: KEV records vulnerabilities for which CISA has evidence of active exploitation, whether exploitation began before or after public disclosure.
Rapid7 found confirmed exploitation of newly disclosed high- and critical-severity vulnerabilities increased 105% year over year, from 71 in 2024 to 146 in 2025. Its analysis also found the median time from publication to CISA KEV inclusion fell from 8.5 days in 2024 to 5.0 days in 2025.
FIRST’s Exploit Prediction Scoring System (EPSS) measures something else again: it estimates the probability that a published CVE will be exploited in the wild in the next 30 days. EPSS should therefore be used as a prioritization signal, not counted as another vulnerability or attack total.
Patching and Vulnerability Remediation Statistics
Verizon’s 2026 DBIR found only 26% of critical vulnerabilities in the CISA KEV catalog were fully remediated by organizations in 2025, down from 38% in the prior dataset. Median time to full resolution increased from 32 days to 43 days, while organizations had 50% more critical vulnerabilities to patch in the median case.
Third-party cloud exposures showed another remediation gap. Verizon found only 23% of third-party organizations fully remediated missing or improperly secured MFA on cloud accounts in the measurement window. Half of those findings were resolved within one month, while weak passwords and permission misconfigurations took almost eight months to reach 50% resolution.
These findings explain why a raw CVSS-only workflow misses important context. Prioritization should consider severity alongside known exploitation, exploit likelihood, asset exposure and business importance. Organizations assessing exposed web assets can also use a website vulnerability scanner to identify reachable application weaknesses before prioritizing remediation.
Third-Party and Software Supply-Chain Statistics
Sonatype identified 21,764 malicious open-source packages in Q1 2026, taking its cumulative total since 2017 to 1,346,867 malicious packages. npm represented 75% of newly detected malicious-package activity during the quarter.
GitGuardian found 28.65 million new hardcoded secrets in public GitHub commits in 2025, a 34% year-over-year increase. Public commit volume itself rose 43%, so part of the increase reflects a larger denominator. GitGuardian also counted approximately 1.28 million AI-service secrets, up 81% year over year.
Verizon’s breach data adds the downstream impact: third-party involvement reached 48% of breaches in the 2026 DBIR, up from 30% in the previous dataset. This broad metric can include third-party connections, hosted data and software supply-chain paths, so it should not be interpreted as a count of software-package compromises alone.
Cloud Security Statistics
Thales’s 2025 Global Cloud Security Study found four of the five most-targeted assets in reported attacks were cloud-based. Sixty-eight percent of respondents reported increases in access-based attacks, 85% said at least 40% of their cloud data was sensitive, yet only 66% had implemented MFA.
IBM’s 2026 AI-breach findings reinforce the configuration problem: cloud misconfiguration was responsible for 27% of breaches targeting AI models or applications, tied with compromised APIs, applications and plugins as the most common surrounding-system cause.
Application and API Security Statistics
OWASP Top 10:2025 keeps Broken Access Control at number one. Across contributed testing data, an average 3.73% of applications had at least one weakness in its 40-CWE Broken Access Control category. Security Misconfiguration moved from fifth in 2021 to second in 2025, with an average 3.00% of applications containing at least one weakness in its 16-CWE category.
Software Supply Chain Failures entered at number three, expanding the previous Vulnerable and Outdated Components category to include dependencies, build systems and distribution infrastructure. OWASP’s Top 10 is an application-security awareness framework, not a global breach-prevalence ranking.
For APIs, ScanTitan’s dedicated API security statistics research remains the better place for the full dataset. The umbrella page keeps API findings concise rather than duplicating a specialized child article.
IoT and Operational Technology Statistics
IBM X-Force reported that 15% of organizations in its 2025 breach research experienced a security incident affecting their OT environment. Among that group, 23% reported damage to OT systems or equipment, and OT-impacting incidents averaged $4.56 million.
IBM X-Force also identified 670 vulnerabilities disclosed in H1 2025 that could affect OT. Forty-nine percent were rated High or Critical, and 21% of the Critical vulnerabilities had publicly available exploit code.
Human, Insider, Industry, Insurance and Cost Statistics

Insider Risk Statistics
Ponemon Institute’s 2026 Cost of Insider Risks research covered 354 organizations and 7,490 analyzed incidents. Sixty-eight percent of participating organizations experienced between 21 and more than 40 insider incidents, up from 57% in the prior study.
Average containment time improved from 81 days in 2024 to 67 days in 2025, but only 13% of incidents were contained within 30 days. Credential-theft incidents were the most expensive category in the study at $842,462 per incident.
Cybersecurity Workforce and Skills Statistics
The 2025 ISC2 Cybersecurity Workforce Study surveyed 16,029 cybersecurity practitioners and decision-makers. 95% reported at least one cybersecurity skills need, while 59% described their skills needs as critical or significant, up from 44% in 2024. ISC2 did not publish a new global workforce-gap estimate for 2025, so the older 4.7 million figure should not be presented as a current 2026 measurement.
Which Industries Recorded the Most H1 2026 Breach Events?
Frequency and impact produce different rankings. Privacy Rights Clearinghouse recorded the highest event volume in the broad business/other category, while education’s reported exposure total was dominated by the unverified 275 million Canvas figure.
| Sector | PRC H1 2026 breach events | Reported affected / exposures | Interpretation |
|---|---|---|---|
| Business / other | 763 | 25.1M | Highest event frequency |
| Healthcare | 509 | 20.2M | High event frequency plus sensitive data |
| Financial | 350 | 12.2M | ITRC separately ranked finance first with 387 H1 compromises |
| Government | 90 | 4.7M | Lower event count than business and healthcare |
| Education | 90 | 279.5M | Distorted by the unverified 275M Canvas figure |
| Nonprofit | 89 | 1.2M | Lower recorded exposure |
| Retail | 56 | 0.3M | Lowest among these listed sectors |
H1 2026 Breach Events by Sector
Distinct breach events recorded by Privacy Rights Clearinghouse.
Source: Privacy Rights Clearinghouse, 2026 Midyear Data Breach Report.
Event frequency and exposure totals are different measures. Education’s reported exposure total is dominated by one unverified mega-breach figure, so this chart uses event counts only.
Healthcare Cybersecurity Statistics
Privacy Rights Clearinghouse recorded 509 healthcare breach events in H1 2026, affecting a reported 20.2 million exposures. IBM’s 2026 breach-cost research put the global healthcare average at $6.64 million per breach, the highest industry average in its study for a fifteenth consecutive year, For the regulatory breach layer behind these broader sector figures, ScanTitan’s Healthcare Data Breach Statistics 2026 research analyzes HHS OCR filings, affected individuals, reporting entity types, breach causes, third-party involvement, costs, and the largest healthcare incidents.
Financial Services Cybersecurity Statistics
PRC recorded 350 financial-sector breach events in H1 2026, while ITRC’s separate methodology counted 387 financial-services compromises. IBM’s 2026 research put the average financial-services breach cost at approximately $6.3 million. The differing event counts reflect different collection systems, not necessarily a contradiction.
For finance-specific confirmed-breach data, including Verizon’s Financial & Insurance attack vectors, breach costs, compromised data types and third-party involvement, see our Financial Data Breach Statistics research.
Manufacturing Cybersecurity Statistics
Verizon’s 2026 manufacturing snapshot analyzed 3,627 incidents and 2,713 confirmed breaches. Exploitation of vulnerabilities was the leading initial-access vector at 38%, followed by phishing at 13% and credential abuse at 11%. Third-party involvement appeared in 61% of manufacturing breaches.
Ransomware remained a major driver of system intrusion: malware appeared in 75% of manufacturing breaches, with ransomware accounting for 61% of those breach actions. Verizon also found 95% of manufacturing breach actors were external and 87% were financially motivated. Source: Verizon 2026 DBIR Manufacturing Snapshot.
Retail and E-Commerce Cybersecurity Statistics
Verizon’s 2026 retail snapshot recorded 997 incidents and 806 confirmed breaches. System Intrusion, Basic Web Application Attacks and Social Engineering represented 95% of retail breaches Statistics. Exploitation of vulnerabilities led known initial access at 42%, while credential abuse accounted for 14% and phishing 9%.
Retail breaches also showed unusually high third-party involvement at 68%. Internal corporate data appeared in 84% of breaches, credentials in 26% and secrets in 20%. Source: Verizon 2026 DBIR Retail Snapshot.
Government Cybersecurity Statistics
Verizon’s 2026 Public Administration dataset included 3,634 incidents and 2,410 confirmed breaches. Vulnerability exploitation was the leading initial-access vector at 40%, followed by phishing at 20% and credential abuse at 8%. External actors accounted for 56% of breaches and internal actors 44%.
Government data should be interpreted carefully because Verizon notes that its public-sector dataset has fewer contributors and stricter reporting requirements than many private-sector verticals. Source: Verizon 2026 DBIR Public Sector Snapshot.
Education Cybersecurity Statistics
Verizon’s 2026 Educational Services dataset included 1,302 incidents and 1,252 confirmed breaches. Vulnerability exploitation led initial access at 34%, phishing accounted for 22% and credential abuse 8%. System Intrusion, Social Engineering and Miscellaneous Errors represented 83% of breaches.
Within malware-related education breaches, ransomware appeared in 65%. Third-party involvement reached 40% and the human element appeared in 68% of breaches. Source: Verizon 2026 DBIR Public Sector Snapshot.
Cyber Insurance Claims Statistics
Coalition’s 2026 Cyber Claims Report, based on claims across more than 100,000 global policyholders during 2025, found BEC and funds-transfer fraud accounted for 58% of all claims. Fifty-two percent of funds-transfer fraud claims originated as BEC, with an average loss of $112,000.
Initial ransomware demands increased 47% to an average above $1 million, yet 86% of businesses hit by ransomware refused to pay. Coalition also reported that 70% of ransomware events involved both encryption and data exfiltration.
These are insurance-portfolio claims, not a global census of cyber incidents. Munich Re separately reports that first-party losses represented 62% of actively managed claims in its portfolio, reinforcing that insurer datasets measure insured losses rather than all cyber events.
How Much Does a Data Breach Cost in 2026?
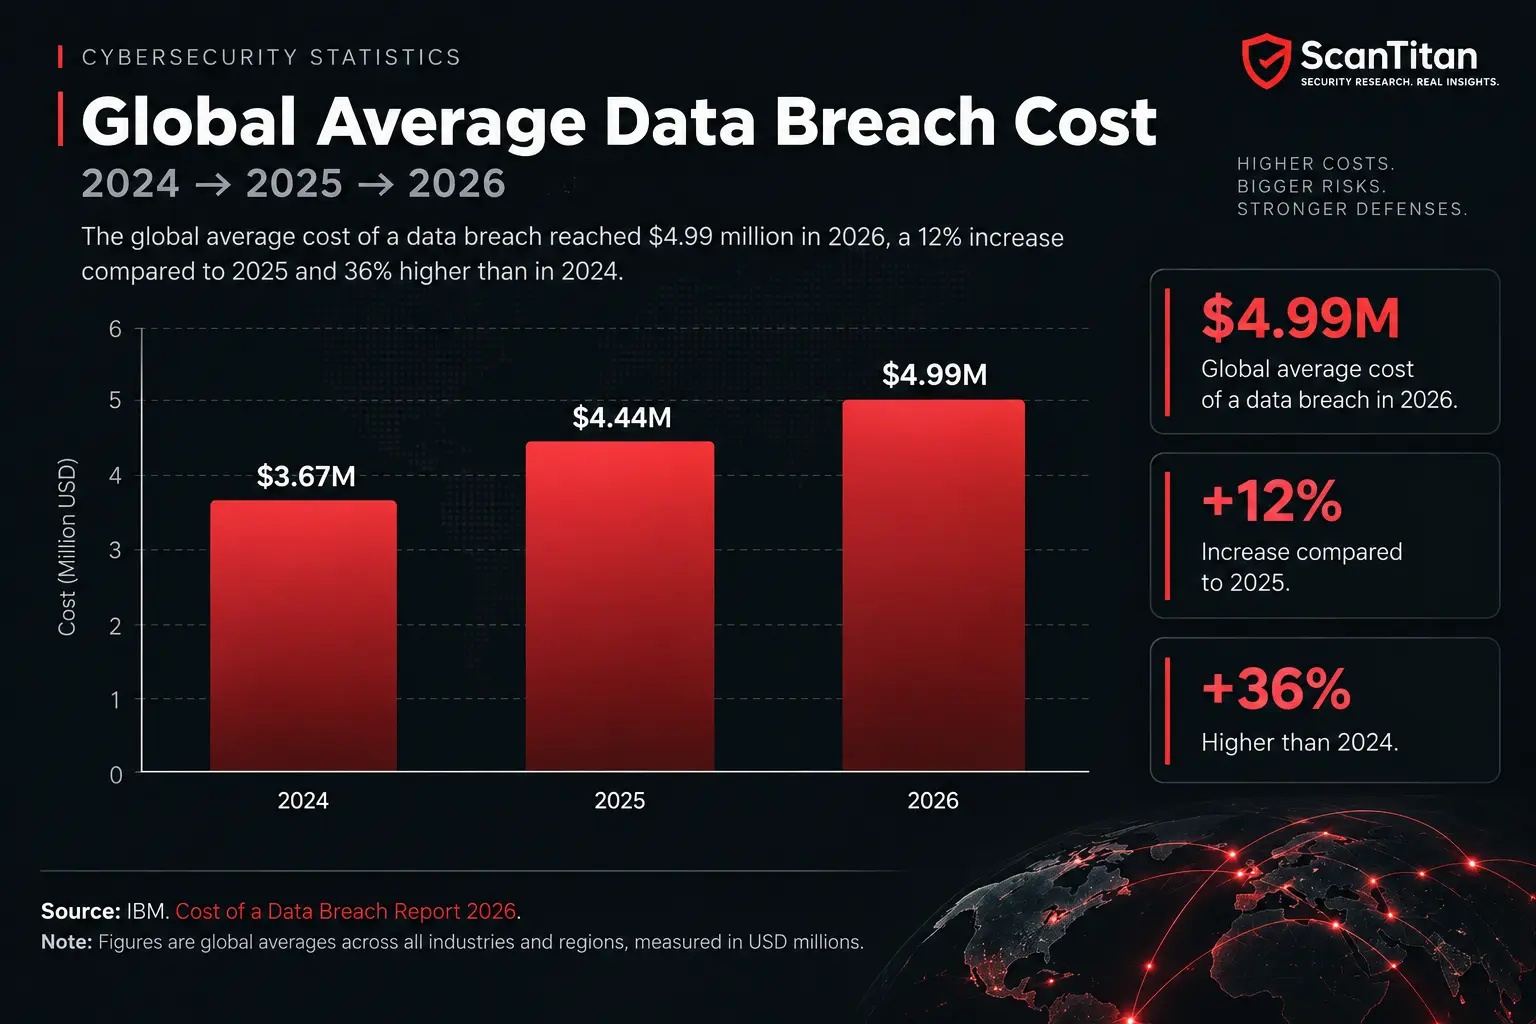
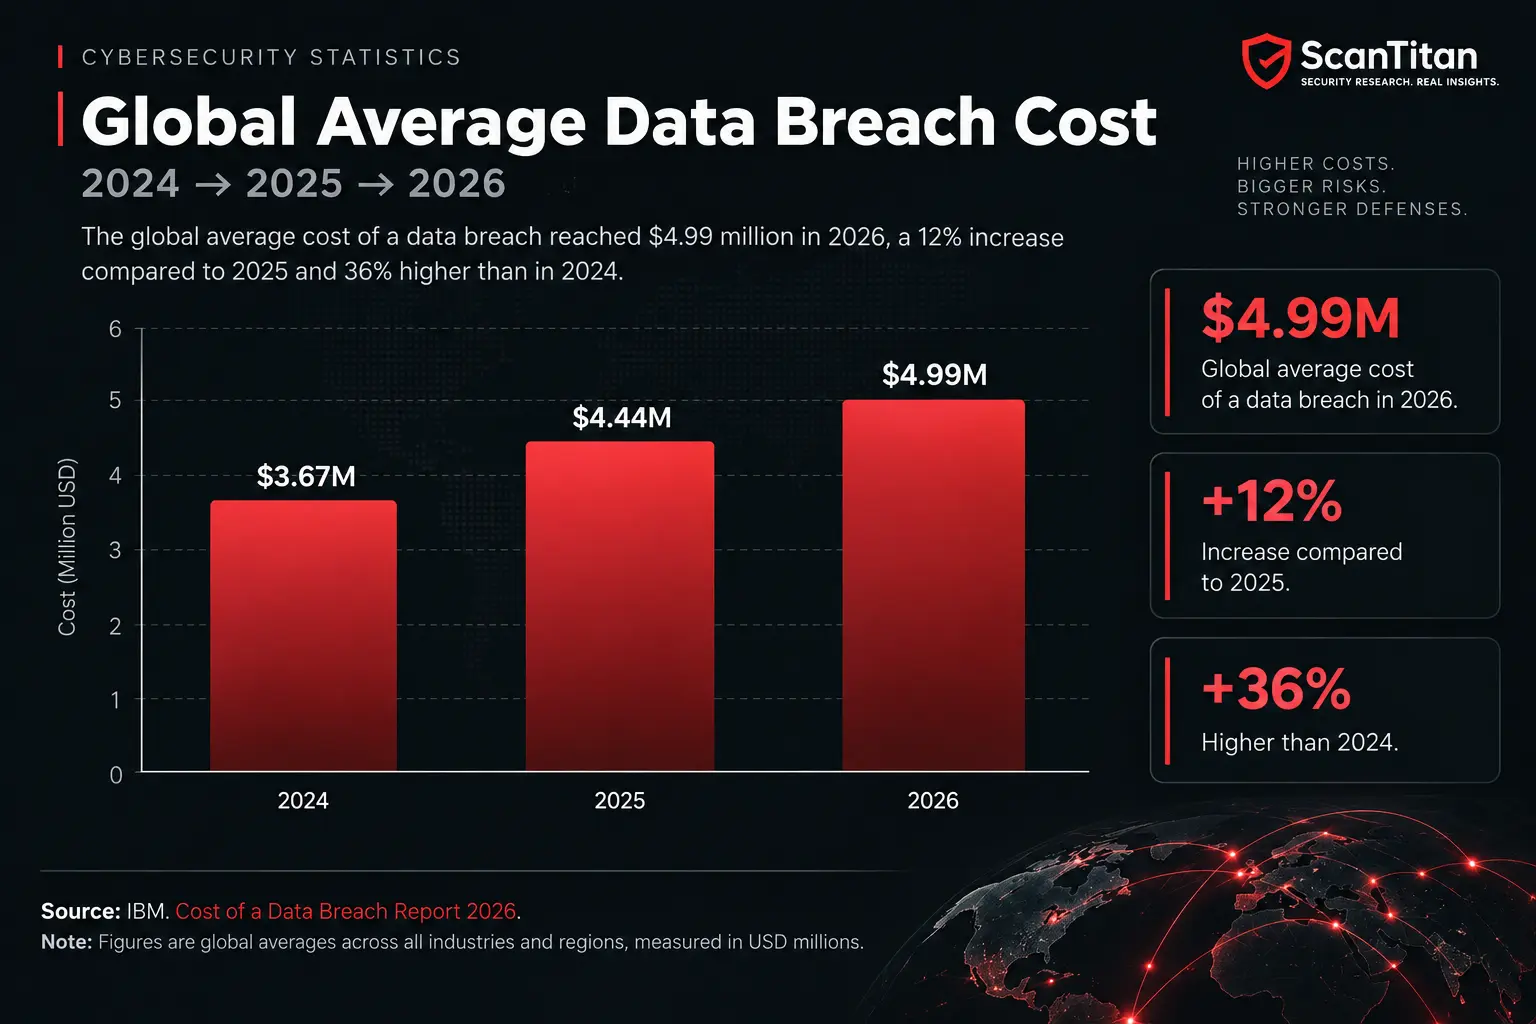
IBM’s global average moved from $4.88 million in 2024 to $4.44 million in 2025, then rebounded to $4.99 million in 2026. The United States reached an average $11.5 million in IBM’s 2026 study, while healthcare averaged $6.64 million globally.
Global Average Data Breach Cost
IBM Cost of a Data Breach reports, USD millions.
Source: IBM Cost of a Data Breach reports.
The global average fell in 2025 before rebounding to $4.99 million in IBM’s 2026 study. IBM’s sample is a breach-cost study, not a census of every breach worldwide.
IBM attributes the 2026 increase to higher detection, escalation and lost-business costs, while finding that extensive security AI and automation still produced an average $1.93 million in savings compared with organizations using none.
Cybersecurity Spending Statistics
Gartner’s February 2026 forecast expects worldwide information-security spending to reach approximately $244 billion in 2026, with 11.6% constant-currency growth. Spending is an economic measure, not proof that organizations are becoming more secure.
How Fast Do Cyberattacks Move?
CrowdStrike’s 29-minute average eCrime breakout time measures the time from initial compromise to lateral movement. Mandiant’s 14-day global median dwell time measures how long an attacker remains in an environment before detection. Rapid7’s 5-day median from publication to KEV inclusion measures another stage again: the speed at which newly disclosed high-impact vulnerabilities enter known-exploitation workflows.
What the speed data meansBreakout time, dwell time and time-to-exploitation are different clocks. Together they show why cybersecurity risk is increasingly defined by the gap between attacker speed and defender visibility, not simply by the number of threats that exist.
Cybersecurity Statistics by Country and Region
National cyber statistics should not be ranked as if they measure the same thing. The United States emphasizes victim complaints, the UK publishes a representative business survey, Australia reports cybercrime submissions and incident response, Canada publishes police-reported cybercrime, and ENISA analyzes an EU incident corpus.
| Country / region | Current metric | Figure | Period | Source | Important caveat |
|---|---|---|---|---|---|
| United States | IC3 complaints / reported losses | 1,008,597 / $20.877B | 2025 | FBI IC3 | Victim-submitted complaints, not every U.S. cyber incident |
| United Kingdom | Businesses reporting a breach or attack in the prior 12 months | 43% (~612,000 businesses) | Fieldwork Aug–Dec 2025; published 2026 | DSIT / Home Office | Representative survey estimate, not incident-response telemetry |
| Australia | Cybercrime reports / incidents responded to | 84,700+ / 1,200+ | FY2024–25 | ASD / ACSC | Reports and incidents are separate units |
| Canada | Police-reported cybercrime incidents | 40,437 | H1 2025 | Statistics Canada | Police-reported incidents, not all attempted attacks |
| European Union | Analyzed cybersecurity incidents | 4,875; DDoS 77% | ENISA Threat Landscape 2025 | ENISA | Incident corpus; not a census of every EU cyber event |
The purpose of this table is comparison of reporting systems, not a ranking of which country is “most attacked.” Different legal, survey and reporting frameworks can produce very different totals even when the underlying threat environment is similar.
Cybersecurity Statistics You Should Stop Quoting Without Context
Some familiar cybersecurity statistics are repeated long after their original methodology became outdated, unclear or detached from the population they originally described. Reusing them as current 2026 measurements weakens otherwise strong research.
| Statistic | Problem | Better 2026 approach |
|---|---|---|
| “3.4 billion phishing emails are sent every day” | The figure traces back to an older estimate and is not a current 2026 measurement of phishing activity. | Use APWG’s reported phishing-attack counts or Microsoft detections and state the measurement scope. |
| “Cybercrime costs the world $10.5 trillion” | This is a modeled industry estimate rather than audited loss telemetry. | Label it explicitly as a forecast if used, or prioritize observed breach, loss and attack datasets. |
| “60% of small businesses close within six months of a cyberattack” | The figure is widely circulated but has been publicly challenged as unverifiable. | Use current small-business breach, ransomware and preparedness datasets instead. |
| “43% of cyberattacks target small businesses” | The commonly quoted figure has often been detached from an older Verizon finding about breach share and reworded as current attack share. | Keep breach and attack denominators separate and use a current dataset. |
| “A cyberattack happens every 39 seconds” | There is no universal global attack counter, and current vendors publish incompatible daily attack rates. | Use defined datasets such as DDoS attacks, breach counts, phishing attacks or complaints rather than one synthetic worldwide frequency. |
| “90% of cyberattacks start with phishing” | Current major datasets do not support this as a universal statistic. Verizon now places vulnerability exploitation at the leading breach-entry position. | Report phishing, credential abuse and vulnerability exploitation within the specific dataset being cited. |
| “95% of breaches are caused by human error” | The claim is frequently repeated without a current primary source or a stable definition of “human error.” | Use current human-element, social-engineering, error and credential metrics from a named dataset. |
For business-size-specific data, see ScanTitan’s small business cybersecurity statistics.
What the 2026 Cybersecurity Data Actually Means
The 2026 data does not support one universal claim that every type of cyberattack is simply rising at the same rate. A better interpretation is that attack surfaces are expanding, exploitation is shifting toward exposed software and identities, third-party dependencies are appearing in more breaches, and some attack paths are moving faster than traditional detection and remediation cycles.
For most organisations the practical translation of this data is narrow: patch faster, and run a recurring website security scan so you know what needs patching.
- Prioritize known exposure, not raw vulnerability volume. CVE publication is rising quickly, but Verizon, Google and Rapid7 show why active exploitation, exploit likelihood and asset exposure matter more than counting every disclosure equally.
- Treat identity as part of the attack surface. Microsoft’s password-attack telemetry, CrowdStrike’s malware-free detections and Sophos’s ransomware findings all point toward credentials and legitimate access as major attack paths.
- Treat third-party risk as breach risk. Verizon’s 48% third-party involvement figure, malicious-package activity and public-secret leakage show how suppliers, dependencies and hosted services can become direct paths into production environments.
- Patch by exploitation risk, not severity alone. KEV, EPSS and observed time-to-exploitation provide different signals that can help prioritize remediation when patch backlogs are larger than security teams can clear immediately.
- Measure response time against attacker speed. Breakout time, dwell time and vulnerability weaponization describe different stages, but all point toward shrinking defensive windows.
- Use AI statistics with explicit definitions. IBM, Verizon and CrowdStrike all report AI-related change, but offensive use, defensive automation and Shadow AI are different phenomena and should not be merged into one rate.
- Do not rank countries from incompatible reporting systems. Complaint data, surveys, incident-response reports and police statistics measure different populations.
Primary Sources Used in This Research
This page prioritizes current primary and first-party sources. The table below summarizes the major datasets used most heavily in the analysis.
| Organization | Dataset / report | Primary use in this research |
|---|---|---|
| Verizon | 2026 DBIR | Breach entry vectors, ransomware, third-party involvement, industry snapshots and remediation |
| IBM | Cost of a Data Breach 2026 | Breach cost, AI-related breach findings and industry costs |
| CVE Program / NIST | CVE metrics / NVD update | Vulnerability disclosure volume and enrichment |
| CISA | KEV Catalog | Known exploitation and remediation prioritization context |
| FIRST | EPSS | 30-day exploitation-probability prioritization |
| Google Threat Intelligence Group | 2025 Zero-Day Review | Zero-day exploitation |
| Rapid7 | 2026 Global Threat Landscape | Exploited high/critical vulnerabilities and exploitation timing |
| FBI IC3 | 2025 Annual Report | U.S. complaints and reported financial losses |
| APWG | Q2 2026 Phishing Activity Trends | Phishing, smishing and BEC activity |
| Cloudflare | H1 2026 DDoS report | DDoS volume and scale |
| CrowdStrike | 2026 Global Threat Report | Malware-free activity and breakout time |
| Coalition | 2026 Cyber Claims Report | Cyber insurance claims, BEC/FTF and ransomware demands |
| UK DSIT / Home Office | Cyber Security Breaches Survey 2025/2026 | UK business and charity breach prevalence |
| ASD / ACSC | Annual Cyber Threat Report 2024–25 | Australian cybercrime reports and incident response |
| Statistics Canada | Police-reported cybercrime summary | Canadian police-reported cybercrime |
| ENISA | Threat Landscape 2025 | EU incident corpus and threat impact |
Cybersecurity Statistics 2026 FAQ
How many cyberattacks happen each day in 2026?
There is no authoritative global count of cyberattacks per day. Security vendors observe different networks and use different definitions for attacks. Defined measures such as phishing attacks, DDoS attacks, confirmed breaches, complaints and identity attacks are more reliable than one combined worldwide daily total.
How many data breaches have happened in 2026?
For H1 2026, Privacy Rights Clearinghouse recorded 1,969 distinct breach events from 5,429 notification filings, while ITRC tracked 1,803 data compromises. The figures differ because the organizations use different sources, counting rules and deduplication methods.
What is the average cost of a data breach in 2026?
IBM’s 2026 Cost of a Data Breach Report puts the global average at $4.99 million, 12% higher than the previous year and the highest average in its report series.
What percentage of breaches involve ransomware?
Ransomware was involved in 48% of confirmed breaches in Verizon’s 2026 DBIR. This measures ransomware involvement in confirmed breaches, not the percentage of all cyberattacks worldwide that are ransomware.
What is the most common way attackers get into organizations in 2026?
In Verizon’s 2026 DBIR, exploitation of software vulnerabilities became the leading breach entry point at 31%. Other incident-response datasets can rank initial access differently because their populations and methodologies differ.
How many vulnerabilities were published in 2025 and 2026?
The CVE Program published 48,244 CVE Records in 2025, compared with 40,077 in 2024. Its current metrics snapshot shows another 35,872 records across Q1 and Q2 2026, which is an H1 total rather than a complete 2026 count.
How many zero-days were exploited in 2025?
Google Threat Intelligence Group tracked 90 zero-day vulnerabilities exploited in the wild in 2025. Google defines these as vulnerabilities maliciously exploited before a public patch was available.
What is the difference between CISA KEV and EPSS?
CISA’s KEV Catalog lists vulnerabilities with evidence of active exploitation. EPSS is a probability model that estimates the chance a published CVE will be exploited in the wild within the next 30 days. One is evidence of known exploitation; the other is a predictive prioritization signal.
How common are phishing attacks in 2026?
APWG reported phishing attacks increased 10.1% in Q2 2026 and recorded 425,808 attacks in June 2026, the highest monthly total since April 2023. APWG’s unit is reported phishing attacks, not every phishing email sent worldwide.
Are AI-powered cyberattacks increasing?
Multiple current datasets show growth, but they measure different things. IBM reported a 56% increase in AI-driven attacks in its 2026 breach research, while CrowdStrike reported an 89% increase in AI-enabled adversary activity. Verizon also found 45% of employees were regular AI users on corporate devices, highlighting a separate Shadow AI governance issue.
How large are DDoS attacks in 2026?
Cloudflare mitigated 935 network-layer DDoS attacks above 1 Tbps in H1 2026, with the number of attacks above that threshold rising 519% from Q1 to Q2.
Is cybersecurity spending increasing in 2026?
Yes. Gartner’s February 2026 forecast projects worldwide information-security spending of approximately $244 billion in 2026, with 11.6% constant-currency growth. Spending is an economic measure and should not be interpreted as a direct measure of security effectiveness.
How much money was lost to internet crime in 2025?
The FBI IC3 received 1,008,597 complaints reporting $20.877 billion in losses during 2025, a 26% increase in reported losses from 2024. IC3 complaint losses are not the same as the total global economic cost of cybercrime.
Is there still a cybersecurity workforce shortage?
The latest ISC2 research emphasizes skills rather than one global headcount-gap figure. In its 2025 study of 16,029 cybersecurity professionals, 95% reported at least one skills need and 59% reported critical or significant skills needs. ISC2 did not publish a new global workforce-gap estimate for 2025.