How to read this researchAPWG phishing attacks, Microsoft email detections, FBI complaints, Verizon breaches, Mandiant investigations, and KnowBe4 simulations are different measurements. They should not be added together or treated as competing estimates of one worldwide phishing total.
Executive Benchmark: Phishing Statistics 2025–2026
The table below summarizes the strongest current phishing benchmarks from primary and first-party research. Figures are prioritized by recency and source quality, with the measurement period shown separately from the report publication year.
| Metric | Latest verified figure | Trend | Data timeframe | Source |
|---|---|---|---|---|
| Reported phishing attacks/sites | 1,069,681 | ▲ 10.1% QoQ | Apr–Jun 2026 | APWG, Q2 2026 Phishing Activity Trends Report |
| Q1 2026 phishing attacks | 971,181 | — | Jan–Mar 2026 | APWG |
| Highest month in Q2 | 425,808 attacks in June | ▲ Highest monthly total since April 2023 | June 2026 | APWG |
| Email-based phishing detections | ~8.3 billion | n/a | Jan–Mar 2026 | Microsoft Threat Intelligence, Q1 2026 Email Threat Landscape |
| FBI phishing/spoofing complaints | 191,561 | ▼ 0.95% YoY | Calendar 2025 | FBI IC3, 2025 Annual Report |
| FBI BEC complaints | 24,768 | ▲ 15.5% YoY | Calendar 2025 | FBI IC3, 2025 Annual Report |
| FBI BEC losses | $3.0466 billion | ▲ | Calendar 2025 | FBI IC3, 2025 Annual Report |
| Average BEC loss per FBI complaint | ~$123,005 | Derived | Calendar 2025 | Calculated from FBI IC3 complaint and loss totals |
| Breaches involving phishing | About 15% | — | Nov 2023–Oct 2024 | Verizon, 2025 Data Breach Investigations Report |
| Phishing as Mandiant initial infection vector | 14% | — | 2024 investigations | Google Cloud / Mandiant, M-Trends 2025 |
| Stolen credentials as Mandiant initial infection vector | 16% | ▲ Second-most-common vector | 2024 investigations | Google Cloud / Mandiant, M-Trends 2025 |
| AI-related IC3 complaints | 22,364 | n/a | Calendar 2025 | FBI IC3, 2025 Annual Report |
| AI-related IC3 losses | $893.35 million | n/a | Calendar 2025 | FBI IC3, 2025 Annual Report |
| Baseline simulated-phishing susceptibility | 33.2% | → 33.1% in 2025 | 2026 benchmark | KnowBe4, 2026 Phishing by Industry Benchmarking Report |
| Simulated susceptibility after one year of training | 4.2% | ▼ 87% from baseline | 12 months after training | KnowBe4, 2026 Phishing by Industry Benchmarking Report |
| Vishing | +20% QoQ | ▲ | Q2 vs Q1 2026 | APWG / Crane Authentication, Q2 2026 |
| Smishing | +40% QoQ | ▲ | Q2 vs Q1 2026 | APWG / Crane Authentication, Q2 2026 |
| Encrypted-channel phishing | 95.2% | — | 2026 report dataset | Zscaler ThreatLabz, 2026 Phishing and Initial Access Report |
| Mobile phishing susceptibility | 40% higher click rate on mobile | ▲ Mobile risk | Nov 2024–Oct 2025 | Verizon, 2026 Data Breach Investigations Report |
| Most impersonated brand | Microsoft, 23% | ▲ From 22% in Q1 | Q2 2026 | Check Point Research, Q2 2026 Brand Phishing Report |
Trend key: ▲ increase · ▼ decrease · → broadly unchanged · n/a = no directly comparable previous-period figure verified.
The important finding is not simply that phishing is “going up.” APWG recorded a 10.1% quarter-over-quarter increase in reported phishing attacks in Q2 2026, while Zscaler reported an approximately 20% year-over-year decline in phishing volume within its own telemetry. Cofense, meanwhile, observed malicious emails arriving more frequently in its environment, averaging one every 19 seconds during 2025 compared with one every 42 seconds in 2024. These results are not necessarily contradictory because the organizations measure different parts of the phishing ecosystem: reported phishing sites, cloud traffic, and malicious emails reaching monitored inboxes.
For the wider breach, ransomware, vulnerability, cost, AI, and attack-volume context, see ScanTitan’s Cybersecurity Statistics 2026 research.
Methodology: What Counts as a Phishing Statistic?
This report prioritizes primary 2025 and 2026 data from APWG, FBI IC3, Microsoft, Verizon, Google/Mandiant, IBM, KnowBe4, Cofense, Zscaler, Check Point, national cyber agencies, and official fraud-reporting bodies.
Older statistics are included only when they answer a question that newer primary data does not, and they are labeled with the actual period measured rather than the publication year.
| Source type | What it measures | What it does not measure |
|---|---|---|
| APWG | Reported phishing sites, campaigns, brands, BEC and related threat observations | All phishing emails sent worldwide |
| Microsoft | Phishing threats visible in Microsoft’s email-security telemetry | A census of every email sent globally |
| FBI IC3 | Complaints voluntarily reported to the FBI | Every phishing victim or every attempted attack |
| Verizon DBIR | Security incidents and confirmed breaches from participating datasets | Global phishing email volume |
| Mandiant | Initial access observed in Mandiant incident-response investigations | All organizations or all attempted attacks |
| KnowBe4 | Simulated-phishing behavior and vendor threat telemetry | A universal real-world phishing success rate |
| Zscaler / Cofense / Check Point | Threats visible inside each vendor’s customer and sensor ecosystem | A universal global attack rate |
| National reporting agencies | Complaints, reports, takedowns, surveyed incidents, or financial losses within a jurisdiction | A directly comparable global dataset |
Why methodology mattersAPWG’s 1.07 million Q2 attacks are not comparable with Microsoft’s 8.3 billion Q1 phishing detections. APWG is primarily counting unique reported phishing sites, while Microsoft is counting email-based threat detections across a massive telemetry environment.
Phishing Statistics Worldwide: How Large Is the Problem?
There is no authoritative worldwide counter of every phishing message, site, text, call, and social-media lure. The best global view comes from combining several measurements without pretending that they represent the same denominator.
APWG Recorded 1.07 Million Phishing Attacks in Q2 2026
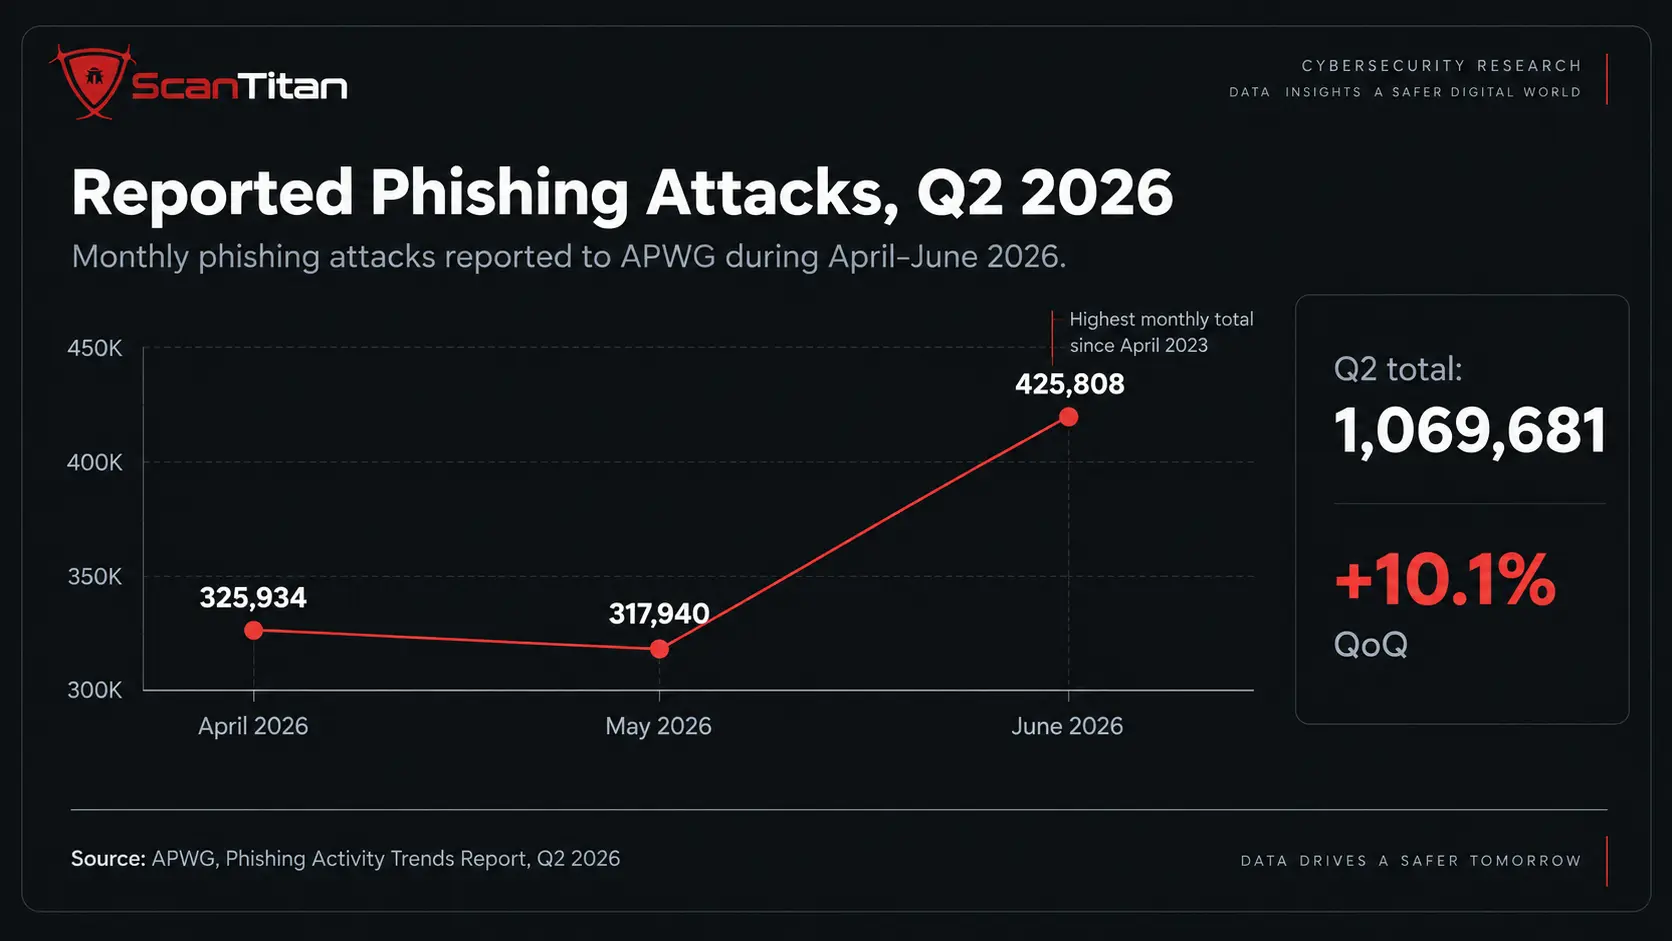
The Anti-Phishing Working Group recorded 1,069,681 phishing attacks in Q2 2026, a 10.1% increase from Q1.
| Period | APWG phishing attacks | Change |
|---|---|---|
| Q1 2025 | 1,003,924 | — |
| Q2 2025 | 1,130,393 | +13% QoQ |
| Q1 2026 | 971,181 | About 3.3% below Q1 2025 |
| Q2 2026 | 1,069,681 | +10.1% QoQ; about 5.4% below Q2 2025 |
June was the sharpest month of the latest quarter. APWG recorded 425,808 attacks in June 2026, compared with 317,940 in May and 325,934 in April. June was APWG’s highest monthly total since April 2023.
APWG also observed 83,951 unique phishing email campaigns in Q2 2026, compared with 35,583 in Q1. The number of brands observed increased from 467 in April to 512 in May and 552 in June, with 941 unique brands seen across the quarter.
APWG defines its main attack count around unique phishing sites derived from reported phishing URLs. A single phishing site can be promoted through many emails and URLs, so these values should not be described as email counts.
Microsoft Detected About 8.3 Billion Email-Based Phishing Threats in Q1 2026
Microsoft Threat Intelligence detected approximately 8.3 billion email-based phishing threats between January and March 2026.
Monthly volume declined slightly during the quarter, from approximately 2.9 billion in January to 2.6 billion in March. Microsoft also found that 78% of email threats were link-based, while QR-code phishing became the fastest-growing attack vector during the quarter and more than doubled.
This number is much larger than APWG’s because Microsoft is measuring email detections, not unique phishing websites.
Cofense Saw One Malicious Email Every 19 Seconds in 2025
Cofense’s Phishing Defense Center reported an average of one malicious email every 19 seconds throughout 2025. In 2024, its reported rate had been one every 42 seconds.
This is a useful operational trend inside the Cofense ecosystem, but it should not be converted into an estimate of all malicious email worldwide.
Not Every Dataset Shows Phishing Volume Increasing
Zscaler ThreatLabz reported that phishing activity in its telemetry declined by roughly 20% year over year, even as campaigns became more targeted and sophisticated.
The apparent disagreement with APWG and Cofense is useful rather than problematic. It indicates why “phishing increased X% globally” is usually too broad a claim. Different sensors see different parts of the ecosystem.
Phishing Statistics 2025: What Changed Going Into 2026?
The 2025 data provides the baseline needed to understand 2026. The clearest pattern is not uniform growth in every phishing metric, but a shift toward identity theft, BEC, multi-channel social engineering, legitimate-platform abuse, and AI-assisted personalization.
| 2025 indicator | Figure | What it means |
|---|---|---|
| FBI phishing/spoofing complaints | 191,561 | Victim complaints submitted to IC3 |
| BEC complaints | 24,768 | 15.5% above 2024 |
| BEC losses | $3.0466B | Reported FBI losses |
| KnowBe4 phishing email change | +17.3% | Vendor telemetry over the measured six-month comparison period |
| Phishing bypassing Microsoft / SEG defenses | +47% | KnowBe4 telemetry |
| AI observed in phishing emails | 82.6% | KnowBe4’s March 2025 threat-research dataset |
| Cofense malicious-email frequency | One every 19 seconds | Observed in Cofense’s 2025 environment |
| Mandiant email phishing initial vector | 14% | 2024 investigations published in M-Trends 2025 |
| Mandiant stolen credentials | 16% | Exceeded email phishing in the same incident-response sample |
The distinction between phishing and stolen credentials is increasingly important. Credential-phishing campaigns can create credentials that attackers use later, so an incident may ultimately be categorized as stolen-credential access even though phishing occurred earlier in the criminal supply chain.
FBI Phishing Statistics: Complaints and Financial Losses
The FBI Internet Crime Complaint Center is the strongest public source for U.S. complaint and reported-loss data, but its numbers represent incidents voluntarily reported to IC3 rather than every cybercrime event in the country.
In 2025, IC3 received 1,008,597 total complaints across all cybercrime categories and recorded $20.877 billion in reported losses. Total losses increased 26% from 2024.
Do not call $20.877 billion “phishing losses”The figure covers all IC3 cybercrime complaint categories. Phishing/spoofing was one of the most frequently reported categories, but the total loss figure includes investment fraud, tech-support scams, BEC, romance fraud, government impersonation, and other crimes.
191,561 Phishing and Spoofing Complaints Were Reported in 2025
The FBI recorded 191,561 phishing/spoofing complaints in 2025, compared with 193,407 in 2024, a decrease of approximately 0.95%.
IC3’s phishing/spoofing category is broader than email. It includes unsolicited email, text messages, and telephone communications that impersonate legitimate organizations in an attempt to obtain personal, financial, or login information.
BEC Losses Exceeded $3 Billion in 2025
| BEC metric | Figure |
|---|---|
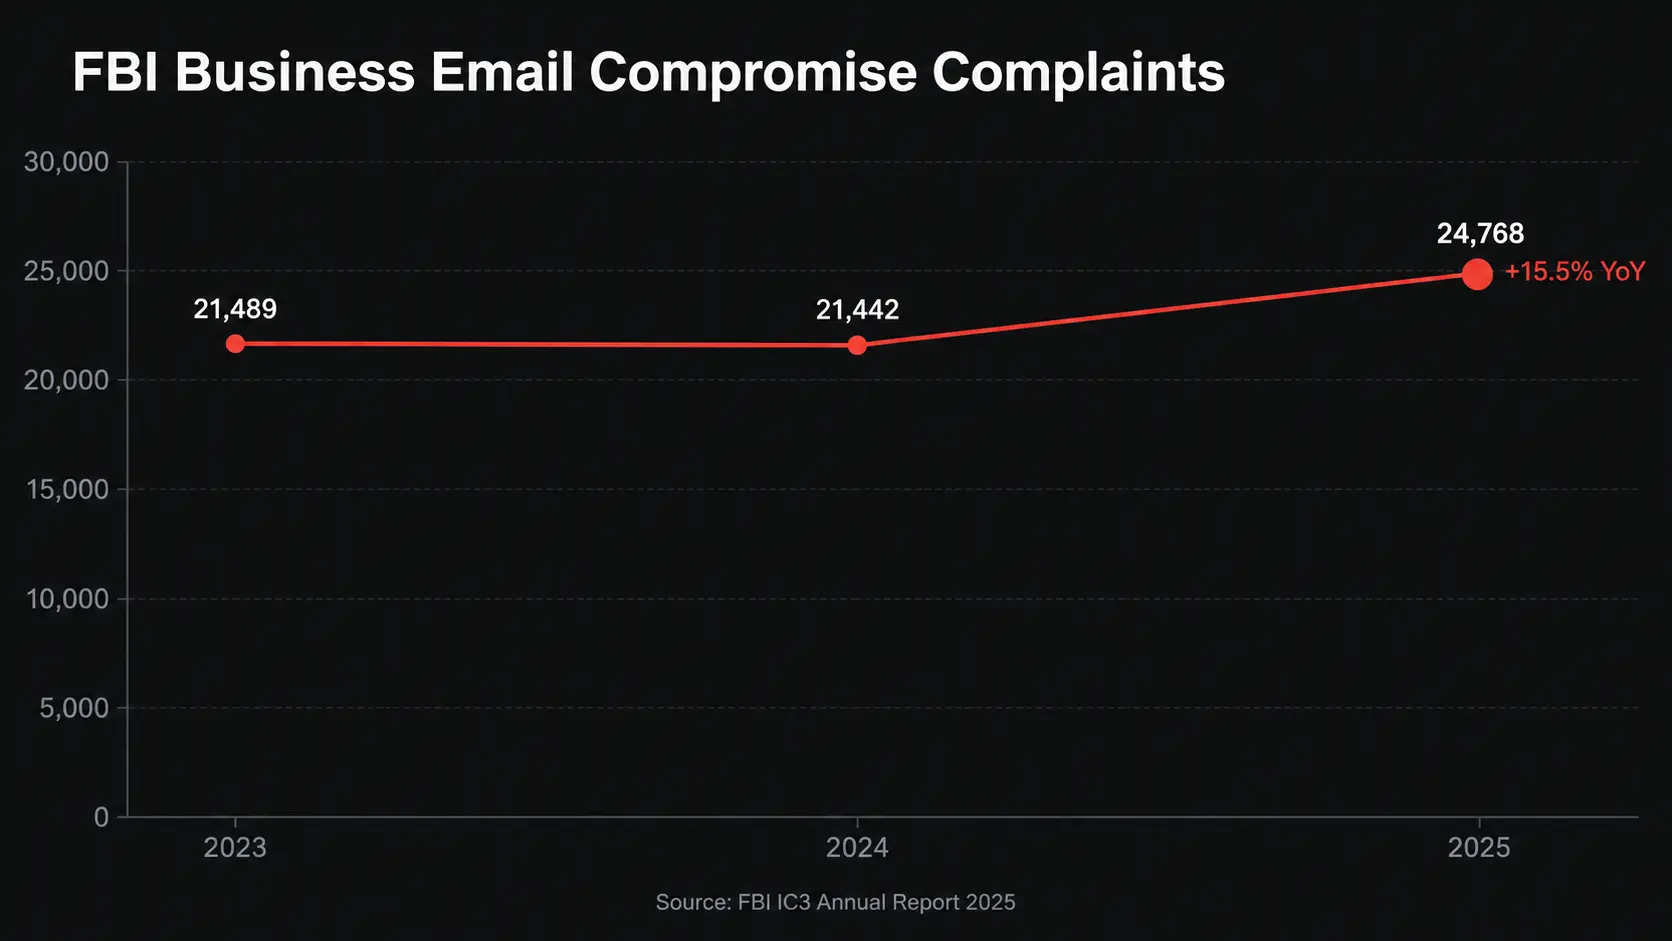
| 2023 complaints | 21,489 |
| 2024 complaints | 21,442 |
| 2025 complaints | 24,768 |
| 2025 YoY complaint growth | 15.5% |
| 2025 reported losses | $3,046,598,558 |
| Average reported loss per complaint | Approximately $123,005 |
The approximately $123,005 figure is calculated by dividing total FBI-reported BEC losses by the number of complaints. It should not be described as an average fraudulent wire request because complaints can involve different BEC methods and outcomes.
APWG’s newer Q2 2026 telemetry indicates that BEC pressure continued to grow. Wire-transfer BEC attacks increased 88% quarter over quarter, while the average amount attackers attempted to steal rose 45% to $61,732.
For ransomware incidents where malicious email and phishing appear as root causes, see ScanTitan’s Ransomware Statistics 2026 research.
What Percentage of Data Breaches Involve Phishing?
There is no single current percentage that applies to every breach dataset.
Phishing is the entry route; an unpatched web application is often what the attacker reaches next. ScanTitan’s website scanner covers that second half.
Verizon’s public 2025 DBIR material placed phishing at approximately 15% of breaches. The report analyzed more than 22,000 incidents and more than 12,000 confirmed breaches with an observation period from November 2023 through October 2024.
By the 2026 DBIR, Verizon reported a major shift in initial access: software vulnerability exploitation reached 31% of breaches and became the leading entry method in its latest dataset.
Mandiant’s incident-response population shows a similar reason not to describe phishing as universally dominant. In M-Trends 2025, the initial infection vectors were:
| Initial infection vector | Share of Mandiant investigations |
|---|---|
| Exploitation | 33% |
| Stolen credentials | 16% |
| Email phishing | 14% |
These figures are why modern phishing statistics should treat phishing as a major initial-access and credential-acquisition mechanism without automatically calling it the leading cause of every cyberattack.
That 31% Verizon figure applies to the broader breach corpus rather than specifically to financial services. For the finance-specific breakdown—22% vulnerability exploitation, 20% phishing and 15% credential abuse—see ScanTitan’s Financial Data Breach Statistics research.
AI Phishing Statistics 2026
Artificial intelligence is one of the most heavily exaggerated parts of phishing reporting, so vendor-specific observations need particularly careful attribution.
KnowBe4 Observed AI in 85.76% of Phishing Attacks in Its Latest Dataset
KnowBe4’s 2026 Phishing Threat Trends Report Volume Seven says 85.76% of attacks in its recent dataset were using artificial intelligence in some form. The report gives comparable figures of 84% in 2025 and 79.9% in 2024.
KnowBe4 also reported that 60.13% of phishing attempts contained a malicious hyperlink.
These are KnowBe4 telemetry statistics. They should be written as “KnowBe4 observed” rather than “85.76% of all phishing worldwide uses AI.”
An earlier March 2025 KnowBe4 dataset found AI characteristics in 82.6% of analyzed phishing emails, illustrating that percentages can vary even within the same vendor as methodology and reporting periods change.
FBI Recorded $893 Million in AI-Related Cybercrime Losses
The FBI’s 2025 data provides a different type of AI evidence: victim complaints rather than email telemetry.
| FBI AI-related measure | 2025 figure |
|---|---|
| AI-related complaints | 22,364 |
| AI-related reported losses | $893.35 million |
| AI-related phishing/spoofing complaints | 803 |
| AI-related BEC complaints | 135 |
| AI-assisted BEC losses | More than $30 million |
The broader IBM 2026 Cost of a Data Breach study found AI-driven attacks increased 56% year over year. IBM’s result is not phishing-specific, however, and should be treated as evidence of wider AI-enabled attack growth rather than converted into a phishing growth rate.
Smishing, Vishing and QR Phishing Statistics
Phishing increasingly extends beyond the email inbox.
| Attack type | Latest verified signal | Source |
|---|---|---|
| Smishing | +40% from Q1 to Q2 2026 | APWG |
| Vishing | +20% from Q1 to Q2 2026 | APWG |
| Vishing during 2025 | KnowBe4 separately reported a 449% surge | KnowBe4 telemetry; different methodology |
| QR-code phishing | More than doubled during Q1 2026 in Microsoft’s environment | Microsoft Threat Intelligence |
| Mobile interaction | 40% higher click rates | Verizon 2026 DBIR |
The APWG and KnowBe4 vishing percentages should not be treated as competing estimates because they cover different periods and telemetry. The defensible conclusion is that independent sources both observed substantial growth in voice-based phishing.
There is not yet a robust primary-source percentage showing what share of all global phishing is QR phishing. Claims such as “X% of phishing is quishing” should therefore be treated cautiously unless the denominator and telemetry source are stated.
Which Industries Are Targeted Most by Phishing?
APWG’s Q2 2026 site telemetry placed SaaS and webmail far ahead of other categories.
| Industry | Share of Q2 2026 phishing-site activity |
|---|---|
| SaaS / webmail | 29.1% |
| Payment | 13.2% |
| Financial institutions | 11.4% |
| Logistics / shipping | 9.6% |
| Social media | 8.5% |
| Cryptocurrency | 7.2% |
| E-commerce / retail | 5.2% |
| Telecommunications | 4.2% |
| Other | 11.6% |
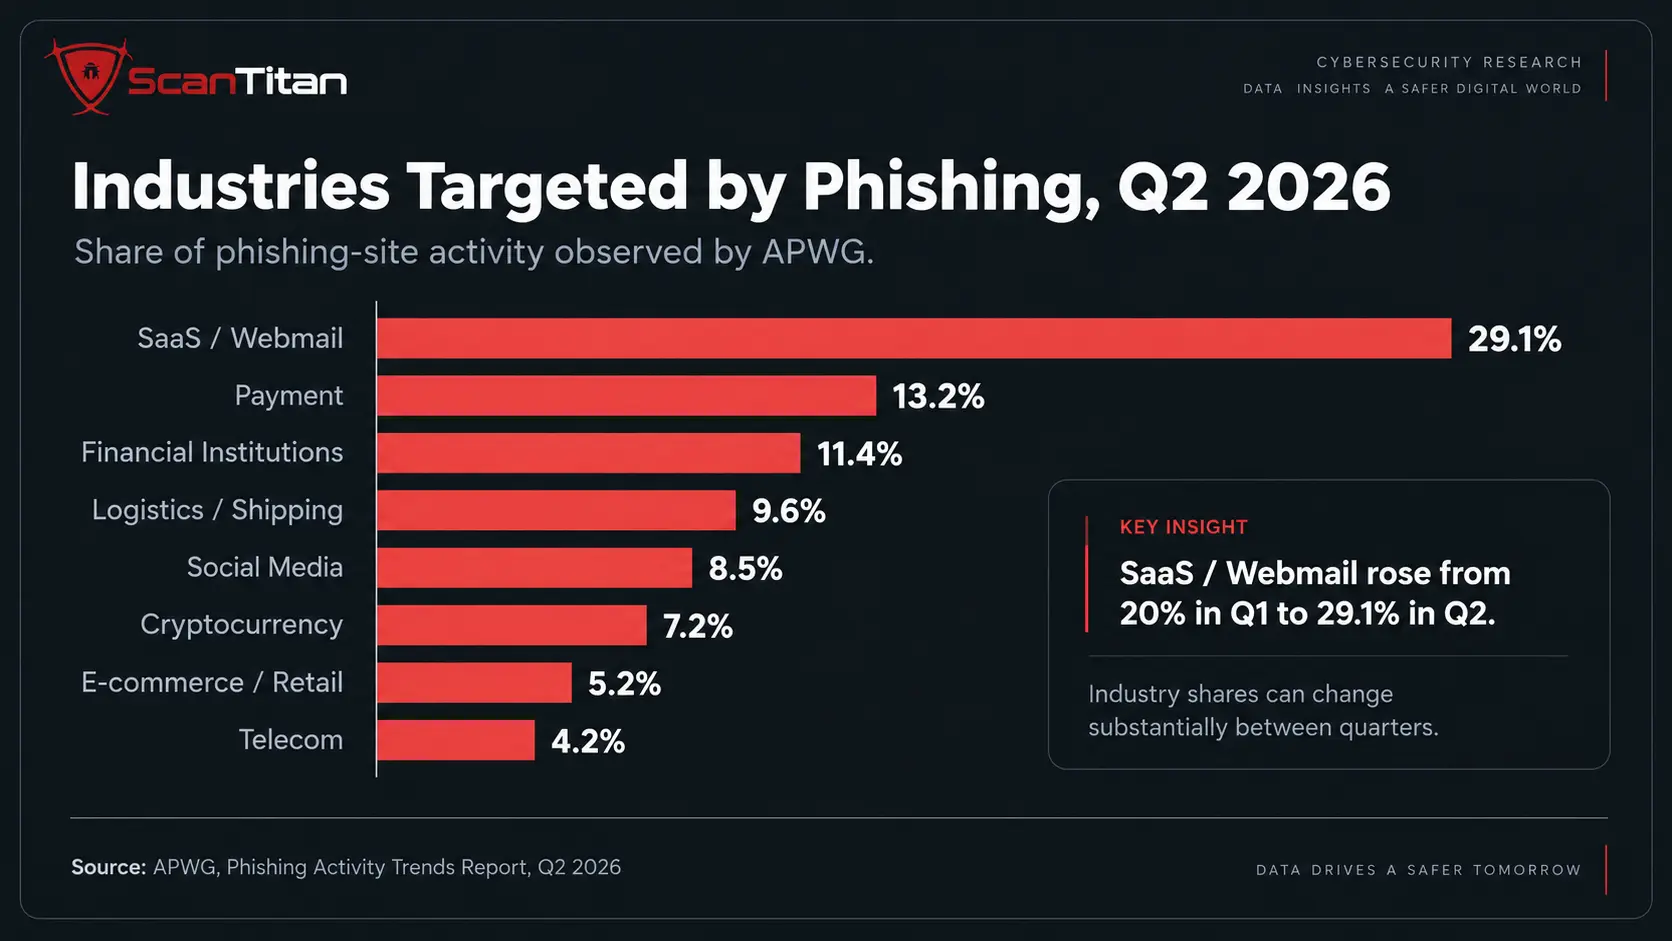
The figures can move rapidly. SaaS/webmail increased from about 20% in Q1 to 29.1% in Q2, while telecom fell sharply from its Q1 share. This is why an industry-targeting statistic without a quarter or year attached to it quickly becomes misleading.
Brand Phishing Statistics: Microsoft Remains the Top Impersonated Brand
Check Point Research found that Microsoft accounted for 23% of observed brand-phishing attempts in Q2 2026, up from 22% in Q1.
LinkedIn, Google, Apple, and Amazon completed the top five. Together, those five brands accounted for more than half of Check Point’s tracked brand-phishing attempts during the quarter.
ChatGPT also entered Check Point’s top ten for the first time in Q2 2026, showing how attackers adapt impersonation lures around widely recognized technologies and services.
What brand statistics measureA 23% Microsoft share means Microsoft represented 23% of brand-phishing attempts in Check Point’s dataset. It does not mean 23% of every phishing attack worldwide impersonates Microsoft.
Employee Phishing Statistics and Training Effectiveness
Simulation data is useful for measuring human susceptibility, but it should never be presented as the success rate of criminal phishing campaigns.
KnowBe4’s 2026 benchmarking research analyzed approximately 42 million phishing simulations across 14.8 million users at 64,000 organizations.
| Training stage | Global Phish-prone Percentage |
|---|---|
| Before training | 33.2% |
| After approximately 90 days | 20.1% |
| After one year | 4.2% |
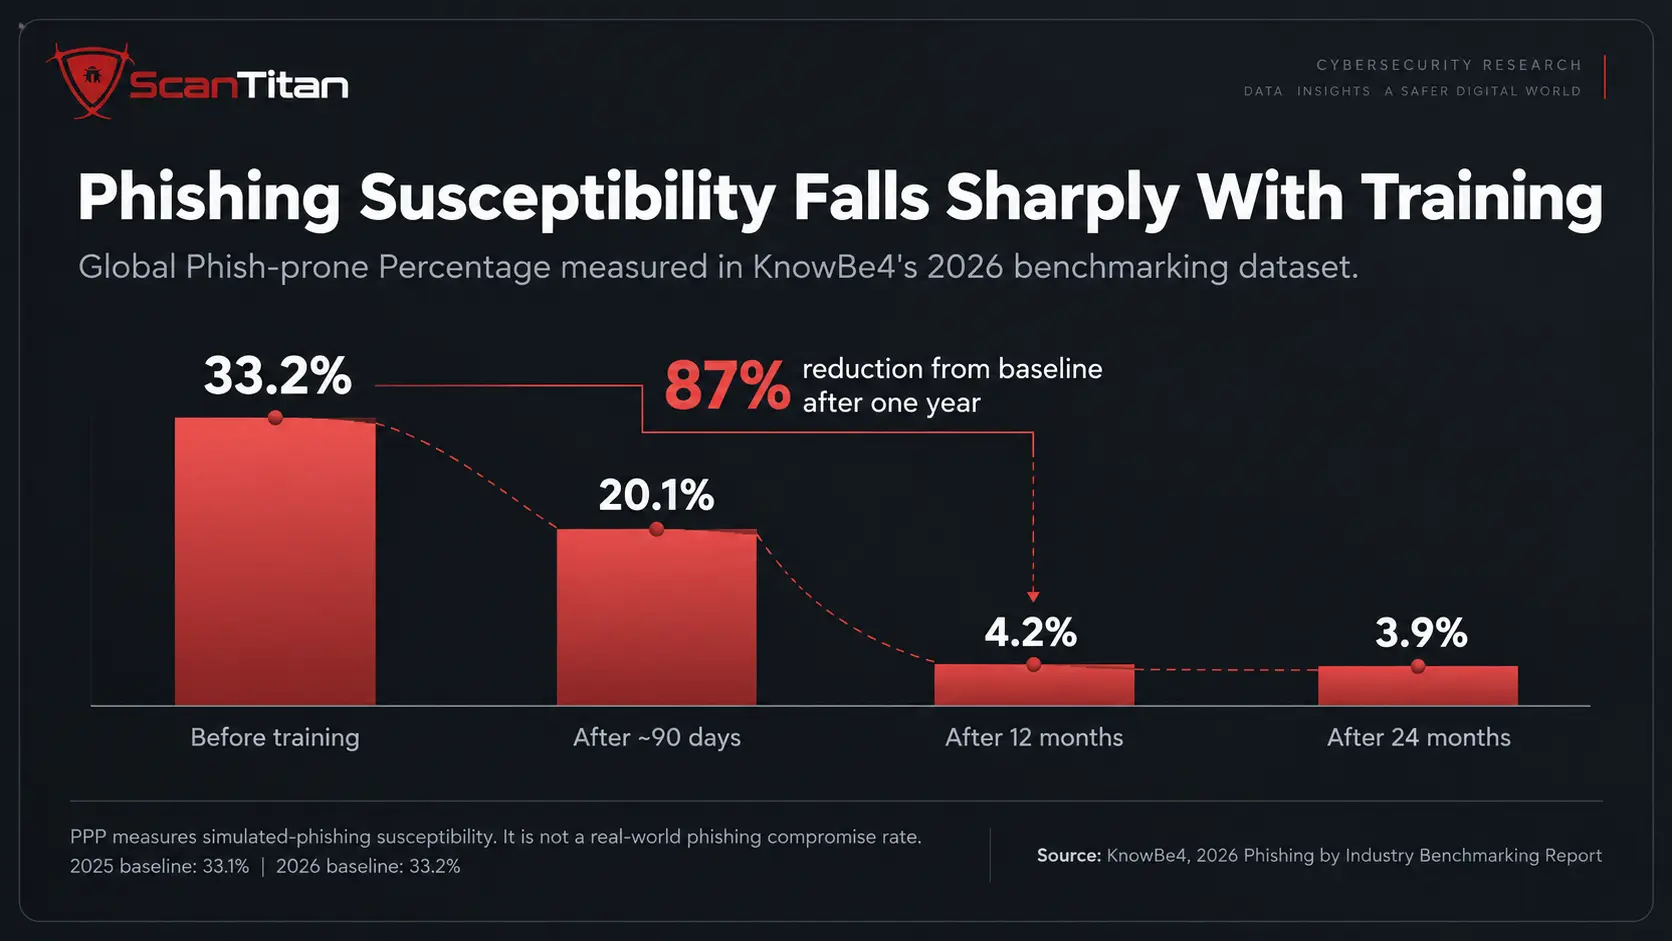
A 33.2% baseline does not mean 33.2% of real phishing attacks succeed. It measures behavior in KnowBe4’s simulated-phishing program before training.
Healthcare Had the Highest Baseline Susceptibility
| Industry | 2026 baseline PPP |
|---|---|
| Healthcare & Pharmaceuticals | 42.7% |
| Insurance | 38.1% |
| Retail & Wholesale | 36.0% |
The same three industries were the highest-risk categories in KnowBe4’s benchmarking for a second consecutive year.
Larger Organizations Showed Higher Baseline Simulation Risk
Organizations with fewer than 250 employees recorded a baseline Phish-prone Percentage of 24.7%, while organizations with more than 10,000 employees began at 39.5%.
Large healthcare organizations reached a baseline of 54% in KnowBe4’s dataset.
Again, these are simulation benchmarks—not the percentage of real cyberattacks that successfully compromise companies of each size, Phishing susceptibility is only one part of healthcare cyber risk. Our healthcare breach statistics research compares phishing with vulnerability exploitation, credential abuse, ransomware, unauthorized disclosure, and HHS OCR breach-reporting data without treating those measurements as interchangeable.
For wider SMB breach and threat data, see ScanTitan’s Small Business Cybersecurity Statistics.
Mobile Phishing Statistics
Mobile devices are becoming a more important social-engineering surface.
Verizon’s 2026 DBIR reports 40% higher click rates on mobile devices. APWG separately recorded a 40% quarter-over-quarter increase in smishing in Q2 2026.
Together, the datasets provide evidence from two different directions: attackers are increasing activity through mobile messaging channels, while users interacting through mobile devices show higher engagement with phishing lures in Verizon’s data.
Phishing Statistics by Country
Country-level statistics are particularly difficult to compare because national agencies use different reporting systems. Some count scam reports, some count cyber incidents, some count victim complaints, and others publish financial-loss data.
United States
FBI IC3 reporting for 2025 recorded:
- 1,008,597 complaints across all IC3 cybercrime categories.
- $20.877 billion in total reported losses.
- 191,561 phishing/spoofing complaints.
- 24,768 BEC complaints.
- $3.0466 billion in BEC losses.
- 22,364 AI-related complaints.
- $893.35 million in AI-related losses.
Phishing Statistics Canada
The Canadian Anti-Fraud Centre received more than 112,000 fraud reports involving more than C$704 million in reported losses across all fraud categories in 2025.
Within that dataset, traditional phishing generated:
- 2,869 phishing reports.
- 467 recorded victims.
The CAFC classifies this phishing category primarily as solicitation for personal information and does not attach direct financial losses to it.
Spear phishing is reported separately and produced a much larger financial impact:
- 813 spear-phishing reports in 2025.
- 571 victims.
- C$67.9 million in reported losses.
By the first three months of 2026, Canadians had already reported nearly C$31 million in spear-phishing-related losses, according to the CAFC.
Phishing Statistics UK
The UK’s National Cyber Security Centre operates the Suspicious Email Reporting Service rather than publishing one national “phishing attack total.”
As of June 2026, the NCSC reported:
- More than 56.9 million scam reports since the reporting service began.
- 252,000 scams removed.
- Removals across approximately 448,000 URLs.
The NCSC’s 2025 Annual Review also reported more than 10.9 million Suspicious Email Reporting Service submissions during the year.
Its Takedown Service disrupted more than 26,000 phishing campaigns targeting UK government departments. Of confirmed phishing attacks targeting those departments, 79% were resolved within 24 hours and 50% within one hour.
UK denominator warning56.9 million reports are not 56.9 million unique phishing attacks. Users can report repeated messages, and the NCSC reporting system covers scams more broadly.
Phishing Statistics Australia
Australia’s National Anti-Scam Centre reported A$2.18 billion in combined scam losses during 2025 across Scamwatch, ReportCyber, IDCARE, the Australian Financial Crimes Exchange, and ASIC.
Phishing was the fourth-largest scam type by reported loss, at A$97.6 million in 2025, compared with A$84.5 million in 2024.
The broader scam dataset recorded 481,523 reports in 2025, down 2.3% from 2024.
Email remained the most frequently reported contact method to Scamwatch, generating 84,861 reports. Only 4,329 of those reports involved reported financial loss, showing why message volume and financial harm should be tracked separately.
Text-message scam reports dropped sharply from 77,365 in 2024 to 29,058 in 2025, but reported losses through the channel increased from A$14.0 million to A$17.9 million.
Phishing Statistics Philippines
The Philippine Statistics Authority provides one of the clearest population-level measurements available for the country.
Among the 24.28 million Filipinos aged 10 and over who reported experiencing a cybersecurity incident in the relevant national survey:
- 57.1% experienced SMS fraud.
- 7.8% experienced hacking.
- 6.1% experienced phishing.
- 1.1% experienced cyberbullying or cyber libel.
BARMM recorded the highest phishing share among regions at 17.3%, followed by Region I at 14.5%.
Only 1.9% of people who experienced any cybersecurity incident reported the incident to authorities, which is an important limitation when comparing police or government complaint counts with survey-based exposure.
CISA Phishing Statistics: What Does CISA Actually Report?
Searches for “CISA phishing statistics” often imply that CISA maintains a national phishing-volume counter. In the current 2025–2026 CISA material reviewed for this report, CISA is more useful as a source of defensive guidance than as a source for a comparable U.S. phishing attack total.
CISA, NSA, FBI, and MS-ISAC guidance focuses on breaking the phishing attack cycle through:
- Phishing-resistant multi-factor authentication.
- Email-gateway and firewall filtering.
- Blocking known malicious domains, URLs, IP addresses, and risky attachment types.
- Security-awareness training.
- Rapid reporting and incident response after successful phishing.
CISA also recommends moving toward phishing-resistant authentication methods such as FIDO/WebAuthn where practical.
Best source for each U.S. questionUse FBI IC3 for U.S. complaint and financial-loss statistics, Verizon or Mandiant for breach and intrusion datasets, Microsoft or vendor telemetry for email volume, and CISA primarily for government defensive guidance and mitigations.
Why Major Phishing Statistics Disagree
The most important methodological lesson in phishing research is that apparently conflicting numbers can all be valid within their own datasets.
| Source | Finding | Actual measurement |
|---|---|---|
| APWG | 1.07M attacks in Q2 2026; +10.1% QoQ | Reported phishing sites |
| Microsoft | ~8.3B Q1 2026 | Email-based phishing detections |
| Cofense | One malicious email every 19 seconds | Malicious email observed in Cofense’s ecosystem |
| Zscaler | ~20% YoY decline | Zscaler cloud phishing telemetry |
| FBI | 191,561 complaints | Victim reports submitted to IC3 |
| Verizon | About 15% of breaches in 2025 DBIR | Confirmed breach population |
| Mandiant | 14% email phishing | Initial vector in investigated intrusions |
| KnowBe4 | 33.2% baseline PPP | User behavior during simulated phishing |
These numbers should not be averaged and should not be used to “correct” one another.
A defensible statement is:
APWG recorded 1.07 million reported phishing attacks in Q2 2026, up 10.1% quarter over quarter, while Zscaler observed phishing volume decline roughly 20% year over year in its own telemetry. The difference reflects separate populations and may also indicate movement from broad campaigns toward more targeted activity.
An indefensible statement would be:
Global phishing increased 10.1% in 2026.
Phishing Statistics You Should Stop Quoting Without Context
Are 3.4 Billion Phishing Emails Sent Every Day?
Do not present this as a current 2026 statistic.
The claim that 3.4 billion phishing emails are sent every day appears throughout phishing-statistics roundups, including current competitor pages. However, the number traces through older secondary estimates rather than a transparent 2025 or 2026 global phishing measurement.
For a current page, stronger replacements are:
- Microsoft detected approximately 8.3 billion email-based phishing threats in Q1 2026.
- APWG recorded 1,069,681 reported phishing attacks in Q2 2026.
- Cofense observed an average of one malicious email every 19 seconds during 2025 in its telemetry.
Is It True That 90% of Cyberattacks Start With Phishing?
No current major breach dataset reviewed here supports that as a universal claim.
Mandiant’s latest comparable data found exploitation at 33% of initial infection vectors, stolen credentials at 16%, and email phishing at 14%.
Verizon’s 2026 DBIR reports that software vulnerability exploitation reached 31% of breaches and became its leading breach-entry method.
Phishing remains an important initial-access and credential-acquisition vector, but “90% of cyberattacks start with phishing” should not be used as a current universal statistic.
What Percentage of Phishing Attacks Are Successful?
There is no credible universal phishing success percentage.
The denominator changes dramatically depending on whether researchers measure:
- Email opens.
- Link clicks.
- Credential submissions.
- Malware execution.
- Account takeover.
- Fraudulent payments.
- Confirmed breaches.
- Simulated-phishing failures.
KnowBe4’s 33.2% baseline Phish-prone Percentage is a useful simulation benchmark, but it is not evidence that 33.2% of criminal phishing attacks succeed.
Do Users Really Click Phishing Links in 21 Seconds?
The widely repeated 21-second click statistic is based on older behavioral research. It may still be useful as historical context, but it should not be labeled as a measured 2026 result.
For current mobile behavior, Verizon’s 2026 DBIR provides a better dated signal: phishing-related click rates were 40% higher on mobile devices.
What the 2026 Phishing Data Actually Shows
The evidence does not support a simple narrative that every form of phishing is increasing at the same rate.
Instead, the 2025–2026 data points to a change in the composition of the threat:
- Reported phishing sites remain extremely high, with more than one million recorded by APWG in Q2 alone.
- Email telemetry remains enormous, with Microsoft detecting approximately 8.3 billion Q1 threats.
- BEC is becoming more financially significant, with FBI losses exceeding $3 billion in 2025 and APWG observing strong Q2 2026 wire-fraud growth.
- Mobile channels are gaining importance, with smishing up 40% QoQ and higher mobile click rates in Verizon data.
- AI is becoming embedded in attacker workflows, although exact percentages depend heavily on the vendor dataset.
- Credential theft increasingly overlaps with phishing, with stolen credentials now outranking email phishing in Mandiant’s initial-access data.
- Brand impersonation remains concentrated around major technology identities, especially Microsoft.
- Security-awareness training substantially changes simulation results, with KnowBe4’s baseline PPP falling from 33.2% to 4.2% after a year in its benchmark population.
The practical implication is that phishing is increasingly an identity and account-takeover problem, not merely an unwanted-email problem. Email filtering matters, but so do phishing-resistant MFA, session security, credential monitoring, payment verification, mobile security, user reporting, and the ability to detect compromised accounts after a lure succeeds.
Primary Sources Used in This Research
- Anti-Phishing Working Group — Phishing Activity Trends Reports
- Microsoft Threat Intelligence — Q1 2026 Email Threat Landscape
- FBI Internet Crime Complaint Center — 2025 Annual Report
- Verizon — 2026 Data Breach Investigations Report
- Google / Mandiant — M-Trends 2025
- IBM — Cost of a Data Breach Report 2026
- KnowBe4 — 2026 Phishing by Industry Benchmarking Report
- Zscaler ThreatLabz — 2026 Phishing and Initial Access Report
- Check Point Research — Q2 2026 Brand Phishing Report
- Cofense — Annual State of Email Security Report
- UK National Cyber Security Centre — Phishing and Suspicious Email Reporting data
- Canadian Anti-Fraud Centre — 2025 Fraud Statistics
- Australian National Anti-Scam Centre — Targeting Scams 2025
- Australian Signals Directorate / ACSC — Annual Cyber Threat Report
- Philippine Statistics Authority — National ICT Household Survey cybersecurity data
Frequently Asked Questions
What are the latest statistics on phishing attacks?
APWG recorded 1,069,681 reported phishing attacks in Q2 2026, up 10.1% from Q1, while Microsoft detected approximately 8.3 billion email-based phishing threats in Q1 2026. The figures are not directly comparable because APWG primarily counts reported phishing sites and Microsoft counts email detections.
How many phishing attacks happen worldwide?
There is no authoritative global total covering every phishing email, website, SMS message, phone call, social-media lure, and collaboration-platform attack. APWG, Microsoft, Zscaler, Cofense and other organizations measure different slices of the ecosystem, so their totals should remain separate.
Is it true that 90% of cyberattacks start with phishing?
No current major breach dataset reviewed for this research supports that as a universal statistic. Mandiant’s 2025 report found exploitation at 33% of initial infection vectors, stolen credentials at 16%, and email phishing at 14%. Verizon’s 2026 DBIR says vulnerability exploitation reached 31% of breaches and became its leading entry method.
What percentage of phishing attacks are successful?
There is no universal success rate because researchers measure different outcomes such as clicks, credential submissions, malware execution, account takeover and confirmed breaches. KnowBe4’s 33.2% baseline Phish-prone Percentage is a simulation benchmark and should not be presented as the success rate of criminal phishing.
Are 3.4 billion phishing emails sent every day?
The 3.4-billion-per-day claim is widely repeated but should not be presented as a verified 2026 global statistic. A better current metric is Microsoft’s approximately 8.3 billion email-based phishing detections during Q1 2026, with the important caveat that this represents Microsoft telemetry rather than every phishing email sent worldwide.
What are the latest FBI phishing statistics?
The FBI IC3 recorded 191,561 phishing/spoofing complaints in 2025. Business Email Compromise generated 24,768 complaints and approximately $3.047 billion in reported losses. Total IC3 losses across all cybercrime categories reached $20.877 billion and should not be described as phishing-only losses.
What are the latest CISA phishing statistics?
CISA is primarily a source of U.S. government defensive guidance rather than a comprehensive national phishing-volume dataset. For U.S. complaint and financial-loss numbers, FBI IC3 is the stronger statistical source. CISA guidance focuses on controls such as phishing-resistant MFA, email filtering, user training and incident response.
Is phishing increasing in 2026?
It depends on the measurement. APWG recorded a 10.1% quarter-over-quarter increase in reported phishing attacks in Q2 2026, while Zscaler reported an approximately 20% year-over-year decline in phishing volume within its own telemetry. Smishing, vishing, BEC wire attempts and several AI-enabled phishing indicators increased in current datasets.
How much money is lost to phishing?
There is no reliable single global loss figure covering every form of phishing. FBI IC3 reported $3.0466 billion in U.S. Business Email Compromise losses during 2025, while Canada’s CAFC reported C$67.9 million in spear-phishing losses and Australia’s combined national scam dataset reported A$97.6 million in phishing losses. These systems use different definitions and cannot be added into a global total.
Which brand is impersonated most in phishing attacks?
Microsoft was the most impersonated brand in Check Point Research’s Q2 2026 dataset, representing 23% of observed brand-phishing attempts. LinkedIn, Google, Apple and Amazon completed the top five, which collectively accounted for more than half of tracked attempts.
Is AI making phishing more common?
Multiple vendor datasets show increasing AI use, but there is no universal global percentage. KnowBe4’s 2026 research says 85.76% of attacks in its recent telemetry used AI in some form, up from 84% in 2025. FBI data separately recorded 22,364 AI-related cybercrime complaints and $893.35 million in reported losses during 2025.
Does security awareness training reduce phishing risk?
KnowBe4’s 2026 simulation benchmark recorded a global baseline Phish-prone Percentage of 33.2%, falling to 20.1% after approximately 90 days and 4.2% after one year of continuous training. These are simulated-phishing results rather than measured real-world breach rates.