
Last updated: September 2026. Figures are labeled by source population and data year so breach share, survey results, leak-site claims, cryptocurrency flows, and reported losses are not treated as interchangeable.
Key ransomware statistics for 2026 at a glance
The most useful ransomware statistics are the ones with a clear denominator. The table below prioritizes current primary sources and states exactly what each number measures. Some figures describe confirmed breaches, some describe organizations already hit by ransomware, and others describe cryptocurrency flows or FBI complaints. Reading them together gives a broader picture, but combining them into one universal “ransomware rate” would be misleading.
| Metric | Latest figure | What it measures | Source |
|---|---|---|---|
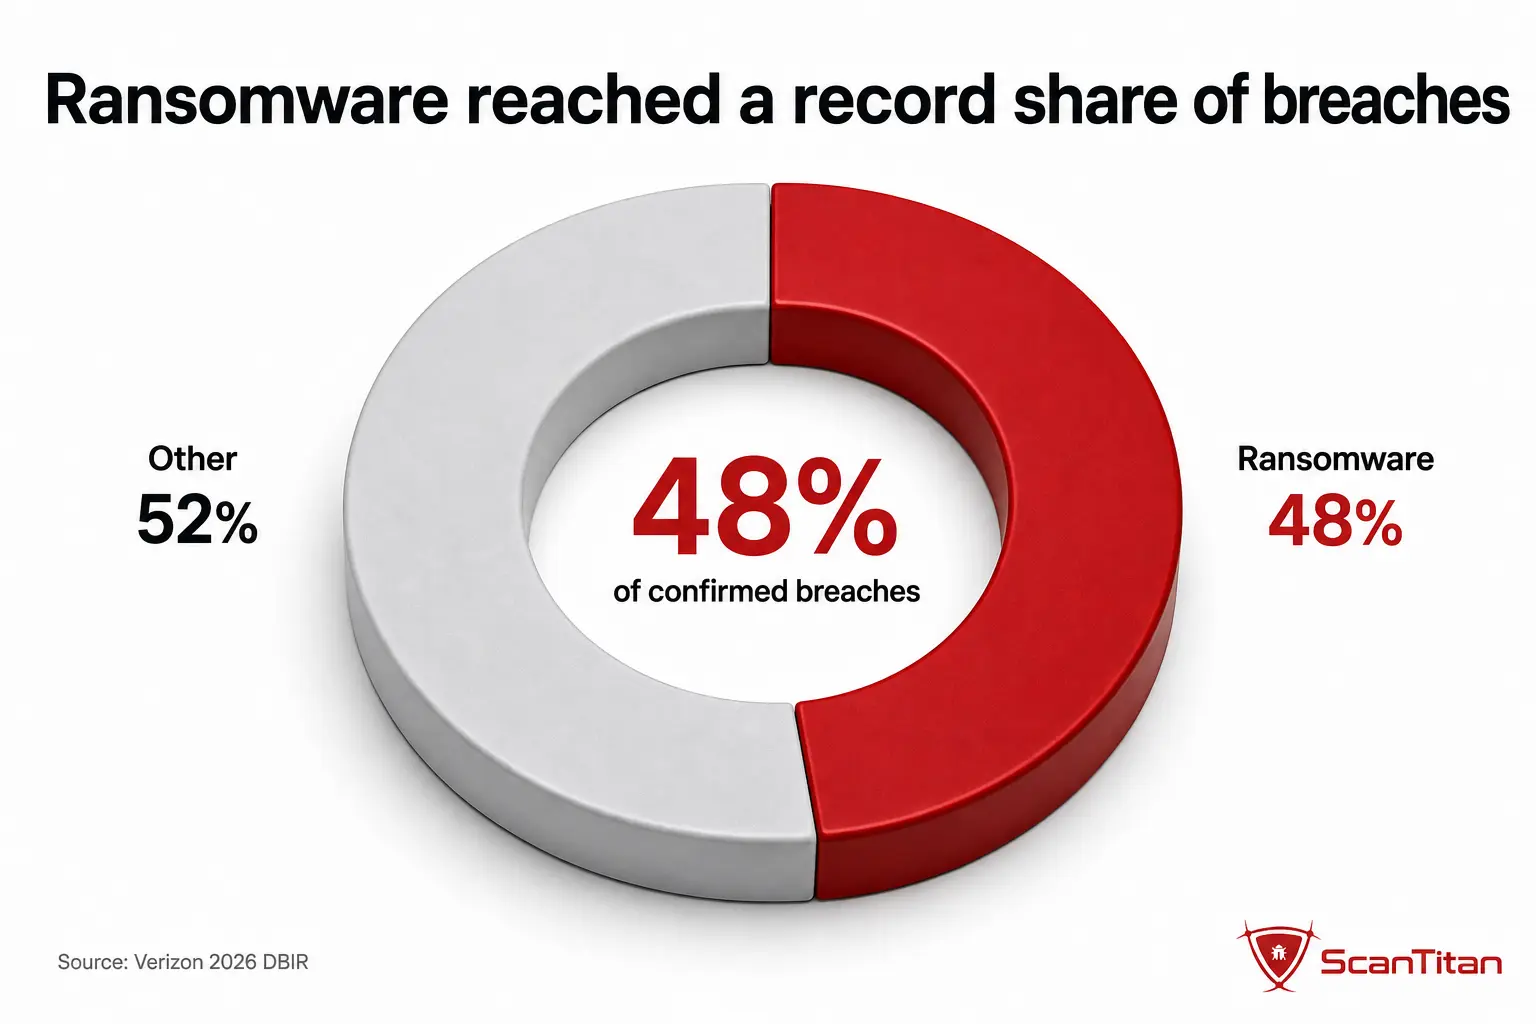
| Breaches involving ransomware | 48% | Share of breaches in Verizon’s 2026 DBIR dataset | Verizon 2026 DBIR |
| Ransomware victims that did not pay | 69% | Victims in Verizon’s 2026 reporting dataset | Verizon 2026 DBIR |
| Median ransom paid | $139,875 | Median payment in Verizon’s 2026 reporting dataset | Verizon 2026 DBIR |
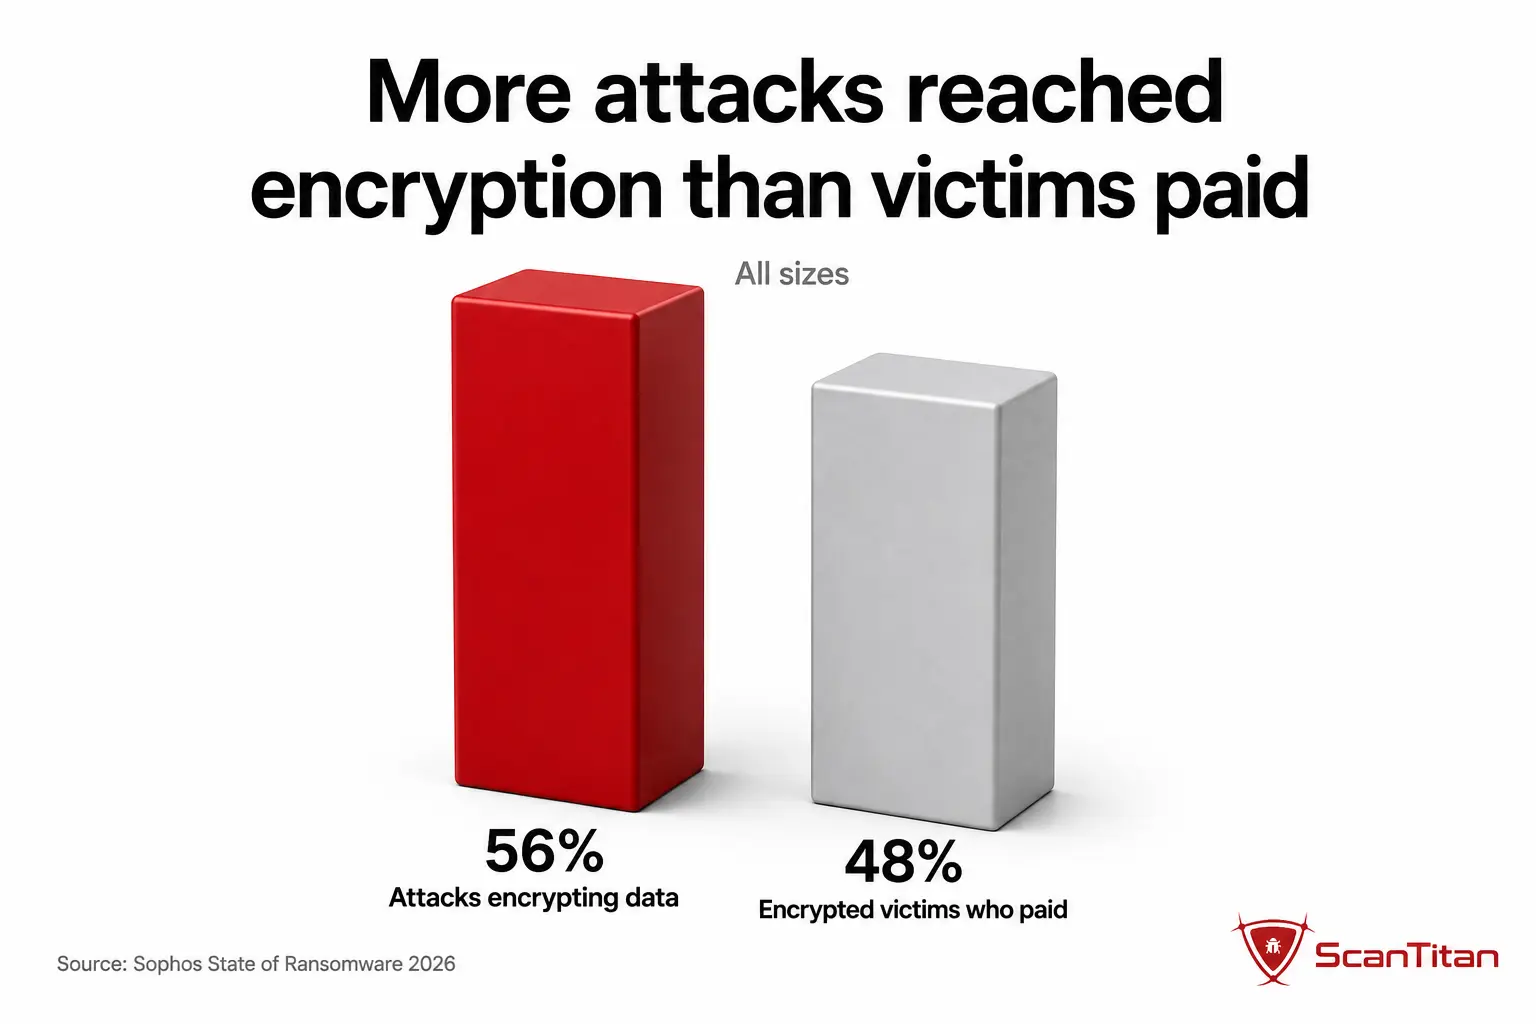
| Attacks that encrypted data | 56% | Organizations hit by ransomware in Sophos’s 2026 survey | Sophos 2026 |
| Encrypted victims that paid | 48% | Organizations whose data was encrypted | Sophos 2026 |
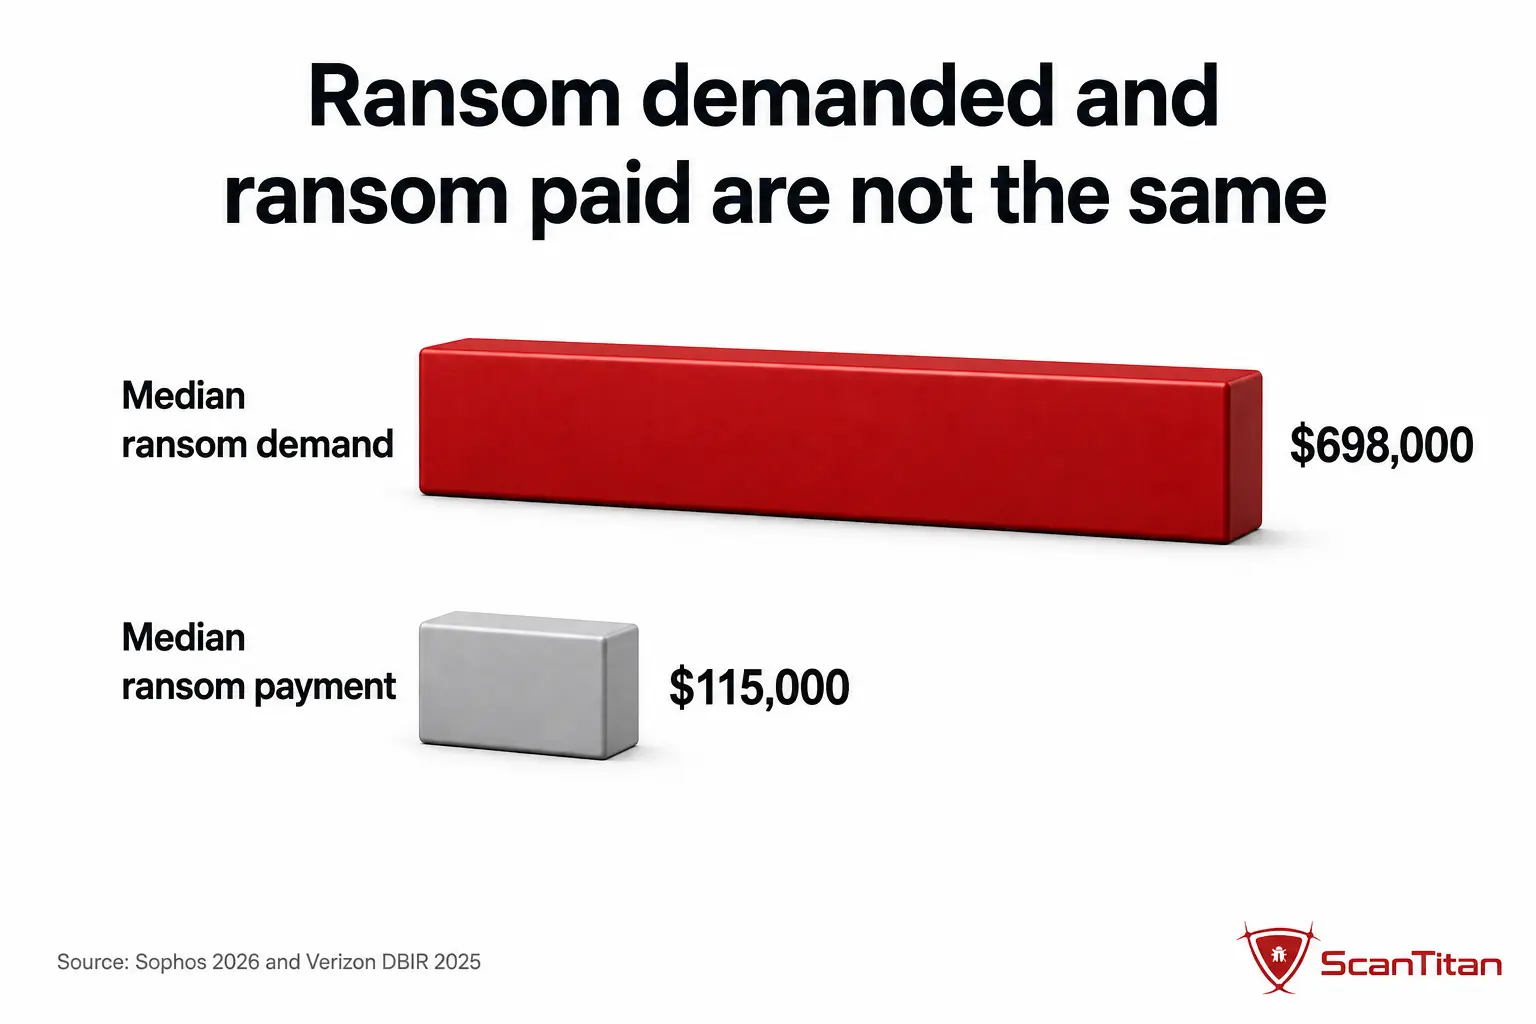
| Median ransom demand | $698,000 | Median attacker demand across Sophos respondents | Sophos 2026 |
| Median ransom payment | $769,000 | Median payment among Sophos respondents that paid | Sophos 2026 |
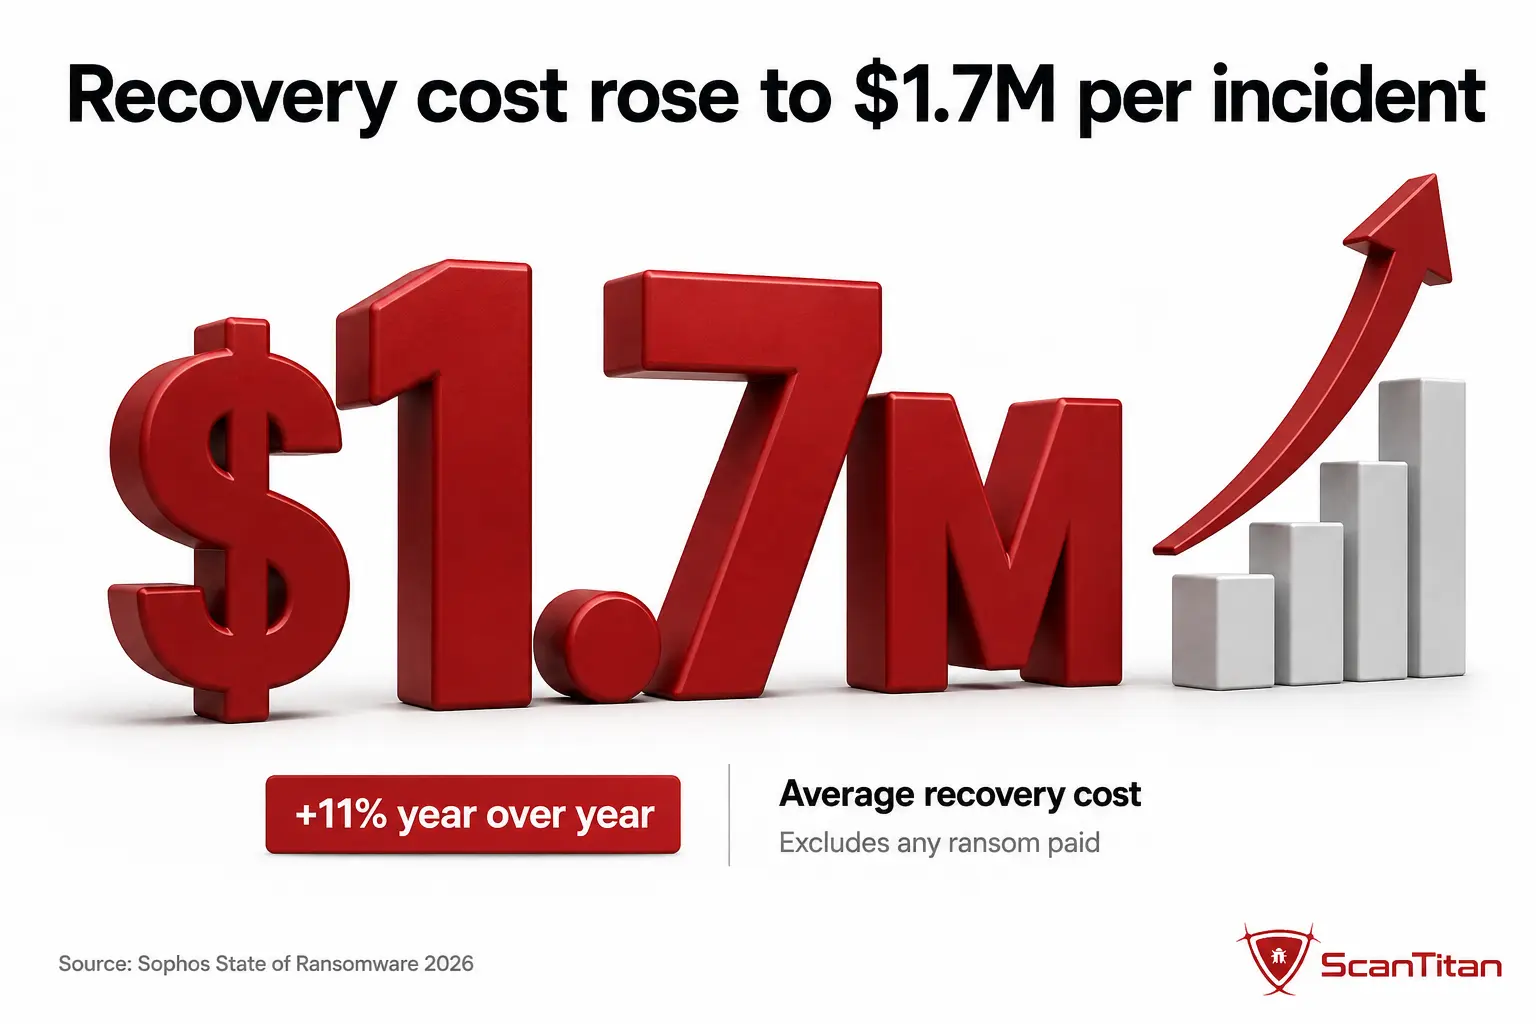
| Average recovery cost | $1.7M | Average recovery cost excluding ransom across Sophos respondents | Sophos 2026 |
| Backup-based recovery | 66% | Encrypted-data cases recovered using backups | Sophos 2026 |
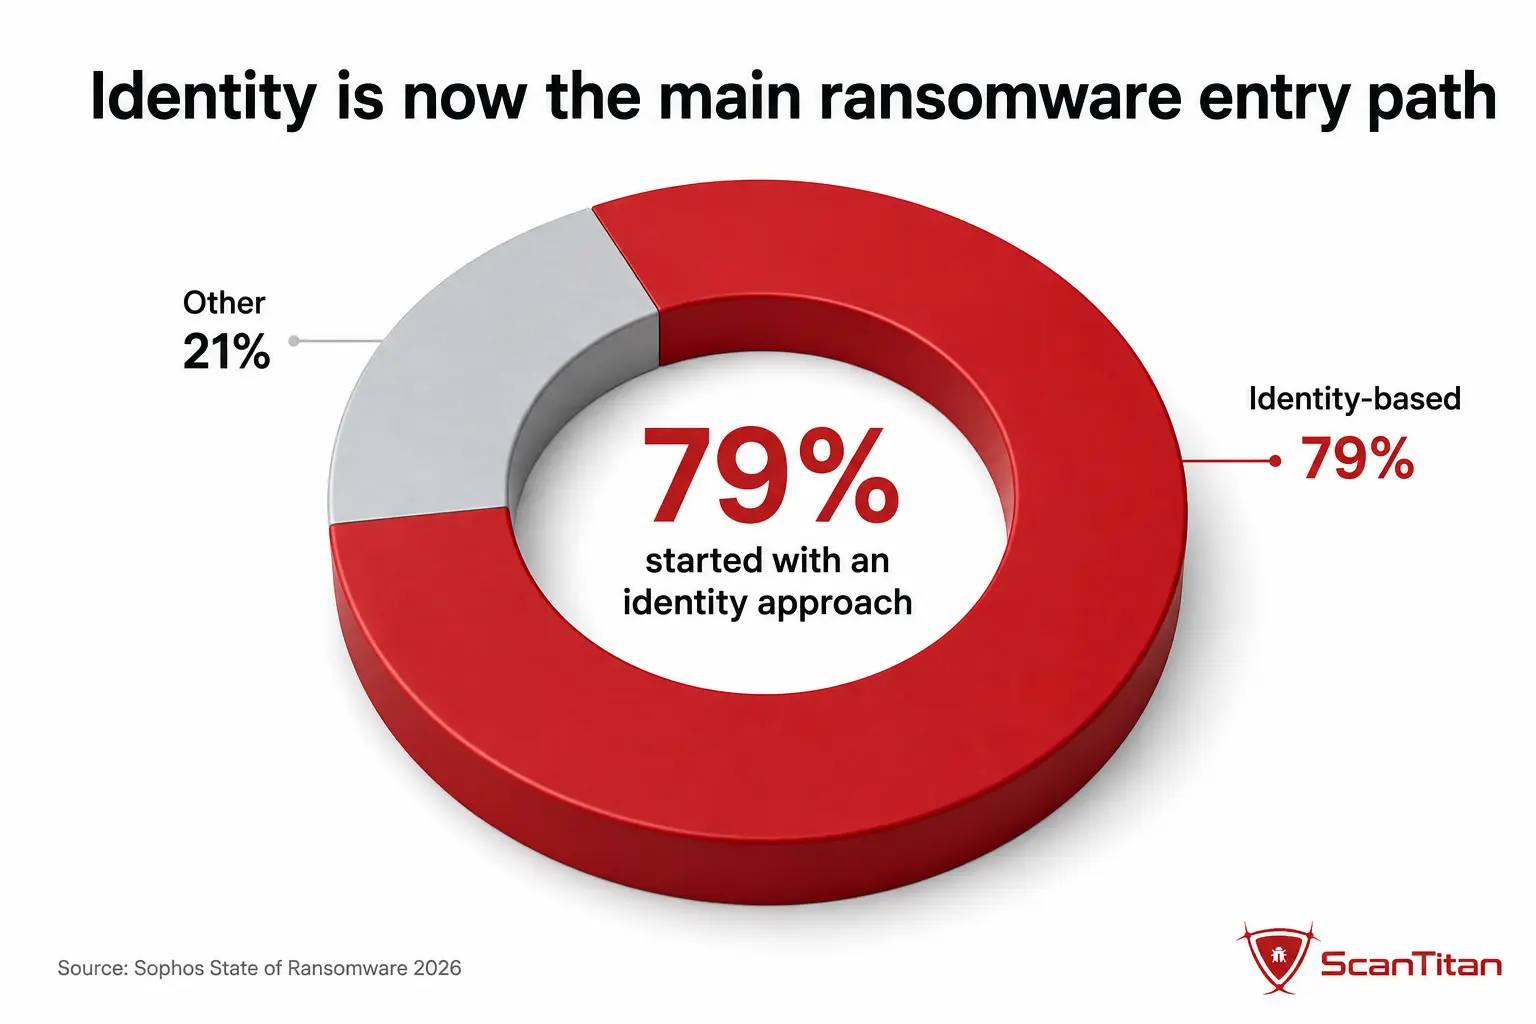
| Identity-based starts | 79% | Ransomware attacks beginning with an identity-based approach | Sophos 2026 |
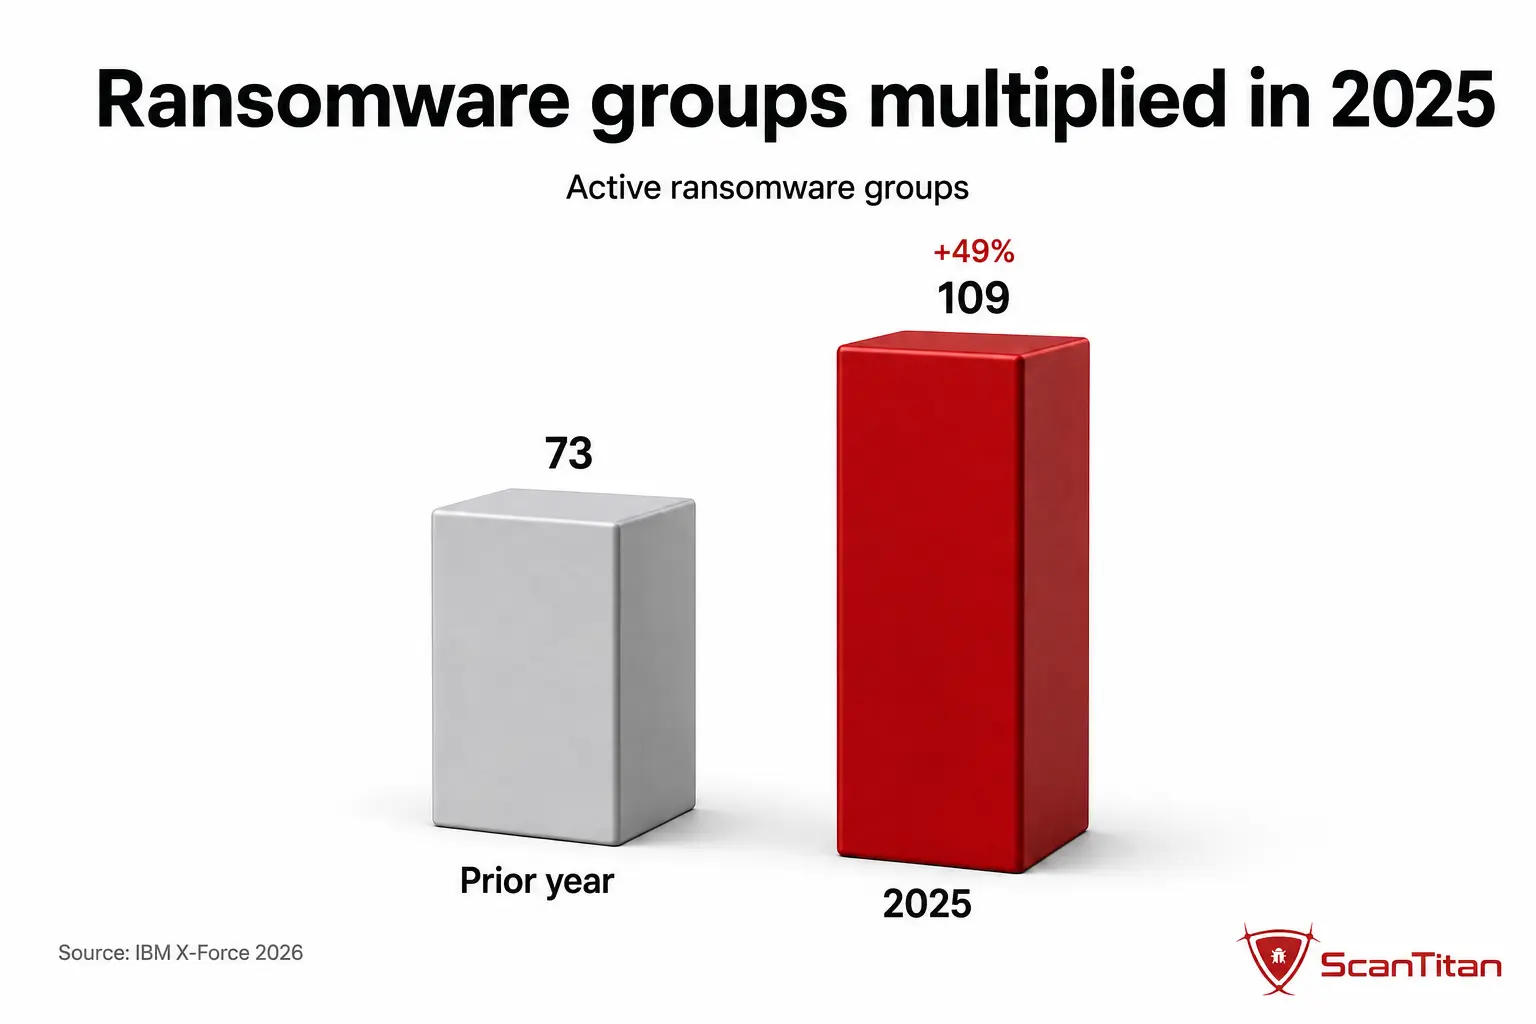
| Active ransomware/extortion groups | 109 | Distinct groups identified by IBM X-Force in 2025 | IBM X-Force 2026 |
| Growth in active groups | 49% | Year-over-year increase from 73 groups in 2024 to 109 in 2025 | IBM X-Force 2026 |
| On-chain ransomware payments | >$820M | Cryptocurrency payments attributed to ransomware actors in 2025 | Chainalysis 2026 |
| Change in on-chain payments | -8% | 2025 versus Chainalysis’s updated 2024 estimate | Chainalysis 2026 |
| Growth in claimed attacks | +50% | Year-over-year change in claimed attacks tracked by Chainalysis | Chainalysis 2026 |
| FBI ransomware complaints | >3,600 | Complaints reported to IC3 during 2025 | FBI IC3 2025 |
| FBI reported ransomware losses | >$32M | Direct losses reported to IC3; excludes many downstream costs | FBI IC3 2025 |
Are ransomware attacks increasing in 2026?
Yes by several important measures, but not by every measure. Verizon found ransomware in 48% of breaches in its 2026 DBIR, up from 44% in the prior report. Chainalysis reported a 50% increase in claimed ransomware attacks during 2025, while IBM X-Force identified 109 active ransomware and extortion groups, up from 73 a year earlier. At the same time, ransomware revenue did not grow with attack volume: Chainalysis estimated 2025 on-chain payments fell about 8%. The correct 2026 conclusion is therefore not simply “ransomware is up.” Attack reach and criminal participation are rising while victim willingness to pay is weakening.
Ransomware statistics by year
Year-over-year comparisons are safest when the denominator stays the same. A common SEO mistake is to put a breach-share percentage from Verizon next to a victim survey from Sophos and call it a trend. The tables below keep like with like: Verizon for ransomware’s share of breaches, Sophos for encryption and ransom economics, and Chainalysis for attributed cryptocurrency payments. Report year and underlying incident window can differ, so these are trend indicators rather than a single global census of attacks.
| Report year | Ransomware share of breaches | Source | Interpretation |
|---|---|---|---|
| 2024 | 32% | Verizon DBIR | Baseline before the sharp two-year increase |
| 2025 | 44% | Verizon DBIR | 12 percentage-point increase |
| 2026 | 48% | Verizon DBIR | Highest share reported in the current series |
| Sophos report year | Encryption rate | Median ransom demand | Key change |
|---|---|---|---|
| 2023 | 75% | Not used here for direct demand comparison | Encryption reached the recent peak cited by Sophos |
| 2025 | 50% | $1.32M | Lower encryption than the 2023 peak |
| 2026 | 56% | $698K | Encryption rose, while median demand fell sharply |
| Payment year | Attributed on-chain payments | Change | Source |
|---|---|---|---|
| 2023 | About $1.25B | Record-level payment year in Chainalysis reporting | Chainalysis |
| 2024 | Updated estimate: $892M | Down materially from 2023 | Chainalysis 2026 update |
| 2025 | More than $820M | About 8% lower year over year | Chainalysis 2026 |
Why ransomware can increase while payments fall
The apparent contradiction is one of the most important ransomware trends of 2026. More groups can attack more organizations without producing more total revenue if fewer victims pay, negotiations reduce settlements, or operators target smaller victims. Chainalysis found 2025 payments fell about 8% while claimed attacks rose 50%. Verizon reported that 69% of ransomware victims in its 2026 dataset did not pay. Sophos, using a different denominator, found 48% of organizations whose data was encrypted paid. Those figures are not inconsistent: they describe different populations. The market is expanding on the attack side while monetization per attempted victim is becoming less reliable.
Ransom demands, ransom payments, and recovery costs
Demand, payment, and recovery cost should never be presented as if they were the same statistic. Sophos’s 2026 study reported a $698,000 median demand and a $769,000 median payment among paying respondents, while average recovery costs reached $1.7 million and excluded the ransom itself. A median payment can exceed a median demand because the two medians are calculated from different subsets; it does not mean victims generally paid more than demanded. Verizon’s separate 2026 incident dataset reported a $139,875 median ransom paid. The spread between sources shows why every ransomware payment statistic needs its population and methodology beside it.
| Measure | Figure | Population | Why it matters |
|---|---|---|---|
| Median ransom demand | $698K | Sophos respondents hit by ransomware | What attackers initially asked for |
| Median ransom payment | $769K | Sophos respondents that paid | What paying organizations actually transferred |
| Median ransom payment | $139,875 | Verizon 2026 reporting dataset | Independent incident dataset with a different population |
| Average recovery cost | $1.7M | Sophos respondents | Recovery expense excluding any ransom |
| 2025 on-chain payments | >$820M | Attributed cryptocurrency transactions | Tracked criminal revenue, not total victim impact |
The real cost of a ransomware attack
Ransomware cost statistics are broader than the payment to the attacker. Recovery can include incident response, forensic investigation, system rebuilding, restoration, legal review, customer notification, lost productivity, lost sales, overtime, regulatory work, and reputational damage. Sophos reported an average recovery cost of $1.7 million in 2026, up 11% year over year, excluding the ransom. The FBI’s IC3 recorded more than $32 million in reported ransomware losses for 2025, but explicitly warns that its ransomware loss figure normally excludes lost business, time, wages, files, equipment, and third-party remediation. IC3 therefore represents a reported floor, not the total U.S. economic cost of ransomware.
How ransomware attacks start in 2026
Sophos’s 2026 research marks a meaningful shift in root cause. Malicious email accounted for 26% of incidents and phishing for 24%, together representing half of surveyed ransomware attacks. Compromised credentials accounted for 23%, exploited vulnerabilities for 18%, and brute-force attacks for 6%. Sophos also reported that 79% of attacks began with an identity-based approach. The important lesson is not that patching stopped mattering. Exploited vulnerabilities remain a major entry route, and Verizon’s broader 2026 DBIR found vulnerability exploitation became the leading initial access vector across breaches overall. For deeper exploitation data, see our Vulnerability Statistics.
Internet-facing exploitation remains a leading entry route, so scan your website on a schedule and close what it finds before it becomes an access broker’s listing.
| Root cause | Share in Sophos 2026 | Defensive priority |
|---|---|---|
| Malicious email | 26% | Email filtering, attachment and link controls, endpoint detection |
| Phishing | 24% | Phishing-resistant authentication, user verification, domain controls |
| Compromised credentials | 23% | MFA coverage, conditional access, credential monitoring |
| Exploited vulnerabilities | 18% | Exposure discovery, patching, exploit intelligence, scanning |
| Brute force | 6% | Rate limiting, MFA, lockout policy, exposed-service reduction |
Websites and internet-facing applications are particularly important because they are continuously reachable and can expose vulnerable software to automated scanning. ScanTitan’s website vulnerability scanner is the single service link used in this article, placed here because vulnerability exploitation remains a documented ransomware entry route, For phishing beyond the ransomware population, see our latest phishing statistics, covering global attack volume, FBI BEC losses, email detections, smishing, vishing, AI-assisted phishing, brand impersonation, and human susceptibility.
MFA is essential, but partial MFA coverage is not enough
One of the most useful 2026 findings is that MFA presence alone does not equal complete identity protection. Sophos reported that MFA was deployed in some capacity in 97% of incidents where compromised credentials were identified as the root cause. This does not show that MFA is ineffective. It shows that organizations can still have unprotected accounts, bypassable methods, legacy authentication, session theft, help-desk weaknesses, or conditional-access gaps. The practical metric to track is therefore not “Do we have MFA?” but “What percentage of privileged, remote, cloud, vendor, and workforce identities are covered by phishing-resistant MFA with monitored exceptions?”
Ransomware encryption and data recovery statistics
Encryption became more successful again in 2026. Sophos found that 56% of ransomware attacks resulted in encrypted data, up from 50% in the prior report, although still below the 75% peak it reported for 2023. Recovery resilience also improved. Sixty-six percent of encrypted-data cases used backups for recovery, up 12 percentage points from 2025, and 55% of affected organizations returned to operation within one week. These statistics explain why ransomware outcomes can improve even while encryption rises: organizations can fail to stop the payload but still avoid a catastrophic payment decision if tested backups and recovery procedures work.
Ransomware statistics by organization size
Smaller organizations face a measurable prevention gap in Sophos’s 2026 survey. Only 34% of organizations with 100 to 250 employees stopped ransomware before encryption or extortion, compared with 46% of organizations with 3,001 to 5,000 employees. That is a 12 percentage-point difference in the ability to contain an attack before the most damaging stage. The result should not be generalized to every small business worldwide because Sophos surveyed organizations with 100 to 5,000 employees that had already experienced ransomware. It does, however, provide a useful size-based comparison inside one consistent study. Our broader Small Business Cybersecurity Statistics page covers SMB-specific breach, cost, identity, and third-party data.
Ransomware statistics by industry
Industry comparisons vary depending on whether the source measures attack volume, ransom payment behavior, breach cost, or observed incident response cases. Sophos’s 2026 ransomware survey found major differences in payment behavior: 72% of local and state government organizations with encrypted data paid, the highest sector rate reported, while only 32% of retail organizations paid, the lowest. IBM X-Force reported manufacturing remained the most targeted industry in its 2025 threat data, followed by financial services and insurance. These figures should not be ranked in one combined table as if “most targeted” and “most likely to pay” mean the same thing.
| Industry signal | Latest finding | Source | Meaning |
|---|---|---|---|
| Highest payment rate in Sophos sector data | Local and state government: 72% | Sophos 2026 | Share of encrypted victims in that sector that paid |
| Lowest payment rate in Sophos sector data | Retail: 32% | Sophos 2026 | Share of encrypted victims in that sector that paid |
| Most targeted sector in IBM threat data | Manufacturing | IBM X-Force 2026 | Observed attack concentration, not payment behavior |
| Next most targeted sector | Financial services and insurance | IBM X-Force 2026 | Observed attack concentration |
Ransomware activity should not be treated as equivalent to confirmed data-breach frequency. For the broader finance-specific breach picture, including ransomware context, initial access, costs and confirmed disclosure data, see ScanTitan’s Financial Data Breach Statistics research.
The ransomware market in 2026
The ransomware economy is becoming more fragmented. IBM X-Force identified 109 ransomware and extortion groups active in 2025, up from 73 in 2024, a 49% increase. IBM also reported that the dominance of attacks attributed to the top 10 groups fell by 25%, indicating that activity is spreading across more operators rather than consolidating around a few brands. This matters because law-enforcement disruption of one major group can be followed by rebranding, splintering, or affiliate migration. Ransomware-as-a-Service lowers the barrier to entry by separating malware development, access acquisition, deployment, negotiation, and laundering into specialized roles.
For the broader breach picture—including initial access, third-party involvement, industry exposure and costs—see our data breach statistics research.
Initial access brokers and the ransomware supply chain
Initial access brokers, or IABs, sell access to already-compromised organizations, allowing ransomware affiliates to skip part of the intrusion process. Chainalysis estimated that IABs received at least $14 million in on-chain payments in 2025 and found that spikes in IAB inflows tended to precede increases in ransomware payments and victim leak posts by roughly 30 days. It also reported that the average price for victim access fell from about $1,427 in Q1 2023 to $439 by Q1 2026, based on Darkweb IQ data. Cheaper access can support higher attack volume even when ransom revenue does not grow at the same rate.
Ransomware and cryptocurrency statistics
Cryptocurrency data gives one of the clearest views of ransomware monetization, but it is still incomplete because attribution improves over time. Chainalysis initially estimated 2024 ransomware payments at about $813 million; its 2026 analysis revised the 2024 figure upward to $892 million as additional transactions were attributed. For 2025, it estimated more than $820 million in payments, about 8% below the updated 2024 figure, while warning that the total could approach or exceed $900 million as attribution matures. That revision is exactly why a statistics article should date the estimate and avoid presenting an early blockchain total as permanently final.
United States ransomware statistics from the FBI
The FBI’s 2025 Internet Crime Report recorded more than 3,600 ransomware complaints and more than $32 million in reported ransomware losses. Those numbers should be treated as a minimum. IC3 states that ransomware adjusted losses normally do not include lost business, time, wages, files, equipment, or third-party remediation services, and some organizations report an incident without reporting a dollar amount. The report also identified 63 new ransomware variants during 2025, averaging 5.25 newly identified variants per month. The top reported variants included Akira, Qilin, INC/Lynx/Sinobi, BianLian, Play, RansomHub, LockBit, DragonForce, SafePay, and Medusa.
| FBI IC3 2025 metric | Figure | Scope note |
|---|---|---|
| Ransomware complaints | More than 3,600 | Voluntarily reported to IC3 |
| Reported ransomware losses | More than $32M | Does not capture the full downstream business cost |
| New ransomware variants identified | 63 | Variants identified via IC3 during 2025 |
| Average new variants per month | 5.25 | Derived directly from the FBI’s annual count |
Ransomware, vulnerabilities, websites, APIs, and CMS exposure
Ransomware is often discussed as an endpoint problem, but the initial foothold can sit in public-facing software, a website, an API, a VPN, a firewall, or a third-party application. Sophos attributed 18% of its 2026 ransomware root causes to exploited vulnerabilities, while Verizon found software vulnerability exploitation became the leading initial access vector across breaches overall. That connects ransomware prevention directly to asset discovery and remediation. Our Website Hacking Statistics cover broader website compromise patterns, while API Security Statistics focus on API attack and breach data.
CMS ecosystems also matter because extensions can create internet-facing weaknesses that attackers automate against. For platform-specific disclosure data, see WordPress Plugin Vulnerability Statistics and WooCommerce Vulnerability Statistics. These pages should not be interpreted as ransomware prevalence studies; they document vulnerability exposure that can become one component of an intrusion chain.
What role is AI playing in ransomware?
The strongest 2026 evidence supports AI as an accelerator rather than a completely separate ransomware category. Verizon reported that generative AI bolstered 15% of attack techniques in its 2026 breach dataset, while IBM described AI as lowering barriers for reconnaissance, vulnerability discovery, credential abuse, and attack automation. IBM also observed more than 300,000 ChatGPT credential sets advertised on the dark web in 2025, illustrating the broader credential-theft ecosystem around AI services. None of those figures means 15% of ransomware attacks were “caused by AI.” The defensible conclusion is that AI can make existing attack stages faster and cheaper without changing the basic need for identity, email, patching, and recovery controls.
Should organizations pay a ransomware demand?
Payment statistics describe behavior, not a recommendation. The FBI and CISA generally discourage paying because payment does not guarantee data recovery, can fund future criminal activity, and may create sanctions or legal complications depending on the recipient. Verizon’s 2026 dataset found 69% of ransomware victims did not pay, while Sophos found 48% of encrypted victims paid. Sophos also reported that 51% of organizations that did pay negotiated below the initial demand. The practical goal is to build enough recovery capacity that payment is not the only path back to operation, while involving legal counsel, insurers, incident responders, and law enforcement when an actual incident occurs.
Statistics to stop citing
Ransomware content is crowded with memorable numbers that are either outdated, derived from opaque estimates, or repeated without the original denominator. Removing weak claims is part of building a better statistics page because it protects citation quality and prevents old numbers from competing with current primary evidence. The following claims should either be retired or heavily qualified.
How to reduce ransomware risk using the 2026 data
The statistics point to a layered control model rather than one product. Identity and email deserve more attention because Sophos attributed half of incidents to malicious email and phishing and found 79% began with an identity-based approach. Vulnerability management still matters because exploited vulnerabilities accounted for 18% of Sophos root causes and software exploitation led initial access across Verizon breaches overall. Recovery controls matter because 56% of attacks still reached encryption. Use the data to prioritize the attack chain rather than buying controls in isolation.
- Harden identity coverage. Require phishing-resistant MFA where possible, remove legacy authentication, monitor privileged access, and audit third-party identities and recovery methods. Verizon found 27% of ransomware victims had no prior infostealer or credential leak, and half of the rest had one within 95 days.
- Secure email and user workflows. Combine technical filtering with domain authentication, attachment controls, user verification, and fast reporting of suspicious messages.
- Discover and patch exposed vulnerabilities. Prioritize internet-facing weaknesses with real exploitation evidence. Our guide to How to Prioritize Vulnerability Remediation explains how to combine severity, exploit likelihood, exposure, and business context.
- Scan continuously rather than quarterly. New assets and vulnerabilities appear between audit windows. Continuous Vulnerability Scanning reduces the time between exposure, detection, remediation, and verification.
- Segment critical systems. Limit lateral movement from user endpoints, vendor accounts, and compromised applications into backups, identity infrastructure, and production systems.
- Back up offline and test restoration. A backup that has never been restored under pressure is an assumption, not a recovery plan.
- Rehearse incident response. Define legal, executive, technical, insurer, and law-enforcement contacts before an attack so the first hours are not spent deciding who owns the response.
How this ransomware statistics page differs from other lists
Large ransomware-statistics pages often maximize the number of bullets by mixing primary data, old surveys, vendor estimates, secondary articles, projections, and anecdotes. This page uses a different standard: current primary sources first, explicit denominators, year labels, source-lineage corrections, and separate treatment of breach share, survey outcomes, crypto payments, and FBI complaints. That makes the total number of statistics less important than whether a reader can quote one without changing its meaning. It also explains why two credible sources can publish different ransom-payment medians in the same year without either source necessarily being wrong.
Methodology and source notes
This article prioritizes the Verizon 2026 Data Breach Investigations Report, Sophos State of Ransomware 2026, Chainalysis 2026 Crypto Crime ransomware research, IBM X-Force Threat Intelligence Index 2026, and the FBI 2025 Internet Crime Report. Where a prior-year figure is used, it is labeled as historical comparison. Survey statistics are not treated as a global census; leak-site or claimed-attack data are not treated as confirmed total attacks; blockchain payments are not treated as total economic loss; and FBI complaints are not treated as the full U.S. incident count. Figures can change when publishers revise attribution, as Chainalysis did for its 2024 payment estimate.
Frequently asked questions
What percentage of breaches involve ransomware in 2026?
48%. Verizon’s 2026 Data Breach Investigations Report found ransomware involved in 48% of breaches in its dataset, up from 44% in the previous report. This measures ransomware involvement in confirmed breaches, not the percentage of every organization worldwide that was attacked.
Are ransomware attacks increasing?
Yes by attack-reach measures. Verizon’s ransomware breach share increased to 48%, Chainalysis reported claimed attacks up 50% year over year, and IBM X-Force identified 109 active ransomware and extortion groups in 2025, up 49%. However, Chainalysis estimated total on-chain ransomware payments fell about 8%, so attack activity and attacker revenue are moving in different directions.
How much is the average ransomware payment in 2026?
There is no single universal average. Sophos reported a $769,000 median payment among paying respondents in its 2026 survey, while Verizon reported a $139,875 median amount paid in its separate 2026 reporting dataset. The populations and methodologies differ, so the figures should not be blended.
What is the median ransom demand in 2026?
$698,000 in Sophos State of Ransomware 2026. Sophos said the median demand had fallen 65% over two years. A ransom demand is not the same metric as a ransom payment or the total cost of recovery.
How much does ransomware cost to recover from?
Sophos reported an average recovery cost of $1.7 million per incident in 2026, up 11% year over year and excluding the ransom. This is an average across the organizations in Sophos’s survey, not a universal cost for every business size.
What percentage of ransomware victims pay?
The answer depends on the denominator. Verizon’s 2026 dataset found 69% of ransomware victims did not pay, meaning 31% did. Sophos found 48% of organizations whose data was encrypted paid. Sophos’s denominator is specifically encrypted victims, so the two figures should not be presented as contradictory.
How do ransomware attacks usually start?
In Sophos’s 2026 survey, malicious email accounted for 26% of root causes, phishing 24%, compromised credentials 23%, exploited vulnerabilities 18%, and brute force 6%. Sophos also reported that 79% of ransomware attacks began with an identity-based approach.
How many ransomware groups are active?
IBM X-Force identified 109 distinct ransomware and extortion groups in 2025, up from 73 in 2024, a 49% year-over-year increase. The count reflects groups observed and identified by IBM, not every actor operating globally.
How much did ransomware operators receive in cryptocurrency in 2025?
Chainalysis estimated more than $820 million in on-chain ransomware payments during 2025, about 8% below its updated $892 million estimate for 2024. Chainalysis cautions that the 2025 total may rise as more transactions are attributed.
How many ransomware complaints did the FBI receive in 2025?
The FBI’s Internet Crime Complaint Center received more than 3,600 ransomware complaints in 2025, with reported ransomware losses exceeding $32 million. IC3 warns that this loss figure excludes many forms of business disruption and remediation cost, so it is a reported floor.