


Website hacking statistics are easy to quote and surprisingly easy to misrepresent. There is no credible global counter showing how many websites are successfully hacked each day, and the figures most articles repeat do not survive a source check. What primary telemetry can measure is different things: automated traffic, malicious bot traffic, attack attempts, vulnerability disclosures, exploitation, breach entry vectors, and financial impact. This page separates those measurements, traces the most repeated claims back to their sources, and flags the statistics that no longer deserve to be cited.
Last updated: August 2026. This page is a source audit, reviewed quarterly. You are welcome to cite it with a link back to ScanTitan.
Key website hacking statistics at a glance
Each row states the figure, what it actually measures, the year of the underlying data, and the source, so an editor can quote it without misreading it.
| Metric | Figure | What it measures | Data year | Source |
|---|---|---|---|---|
| Automated bot traffic | >53% | Share of global web traffic that was automated | 2025 | Thales/Imperva 2026 Bad Bot Report |
| Bad bot traffic | 40% | Malicious/bad bot share of web traffic | 2025 | Thales/Imperva 2026 Bad Bot Report |
| WordPress ecosystem vulnerabilities | 11,334 | Newly disclosed WordPress ecosystem vulnerabilities | 2025 | Patchstack 2026 |
| WordPress plugin share | 91% | Share of WordPress ecosystem vulnerabilities found in plugins | 2025 | Patchstack 2026 |
| Heavily exploited WordPress time-to-exploit | 5 hours | Weighted median time to first exploit for the heavily exploited subset | 2025 | Patchstack 2026 |
| Website vulnerability attack volume | 6.29B | Attack activity targeting website vulnerabilities (not compromises) | 2025 | Indusface 2026 |
| Vulnerability exploitation as breach initial access | 31% | Share of breaches that started with software vulnerability exploitation | Nov 2024 to Oct 2025 | Verizon 2026 DBIR |
| CMS share of KEVs | ~one third | Share of VulnCheck Known Exploited Vulnerabilities categorized as CMS | 1H 2026 | VulnCheck |
| Sucuri infected-site detections | 1,176,701 | Infected websites detected in 70.8M remote scans (vendor telemetry) | 2024 | Sucuri SiteCheck |
| Average global breach cost | $4.99M | Organization-level average breach cost | 2026 | IBM |
| Mean time to exploit | -7 days | Broad estimate; exploitation can precede a patch | 2026 | Mandiant M-Trends |
What these numbers actually measure
The fastest way to misuse website hacking statistics is to treat different measurements as if they were the same thing. Four distinctions carry most of the risk.
Attack attempts vs successful hacks. Read Indusface’s 6.29 billion figure as attack activity aimed at website vulnerabilities, not as the number of sites that fell. Attack volume shows pressure, not outcomes.
Vulnerability disclosures vs breaches. Treat Patchstack’s 11,334 as flaws disclosed across the WordPress ecosystem in a year, not as a count of hacked WordPress sites. A disclosed vulnerability is a potential door, not a break-in.
Vendor detections vs a web census. Interpret Sucuri’s detection figures as coverage of its own SiteCheck scanning dataset, useful for trends, not as a global total of infected websites.
Breach cost vs website remediation cost. Note that IBM’s 4.99 million dollars is an organization-level average breach cost, not the cost of cleaning a single hacked website.
How many websites get hacked?
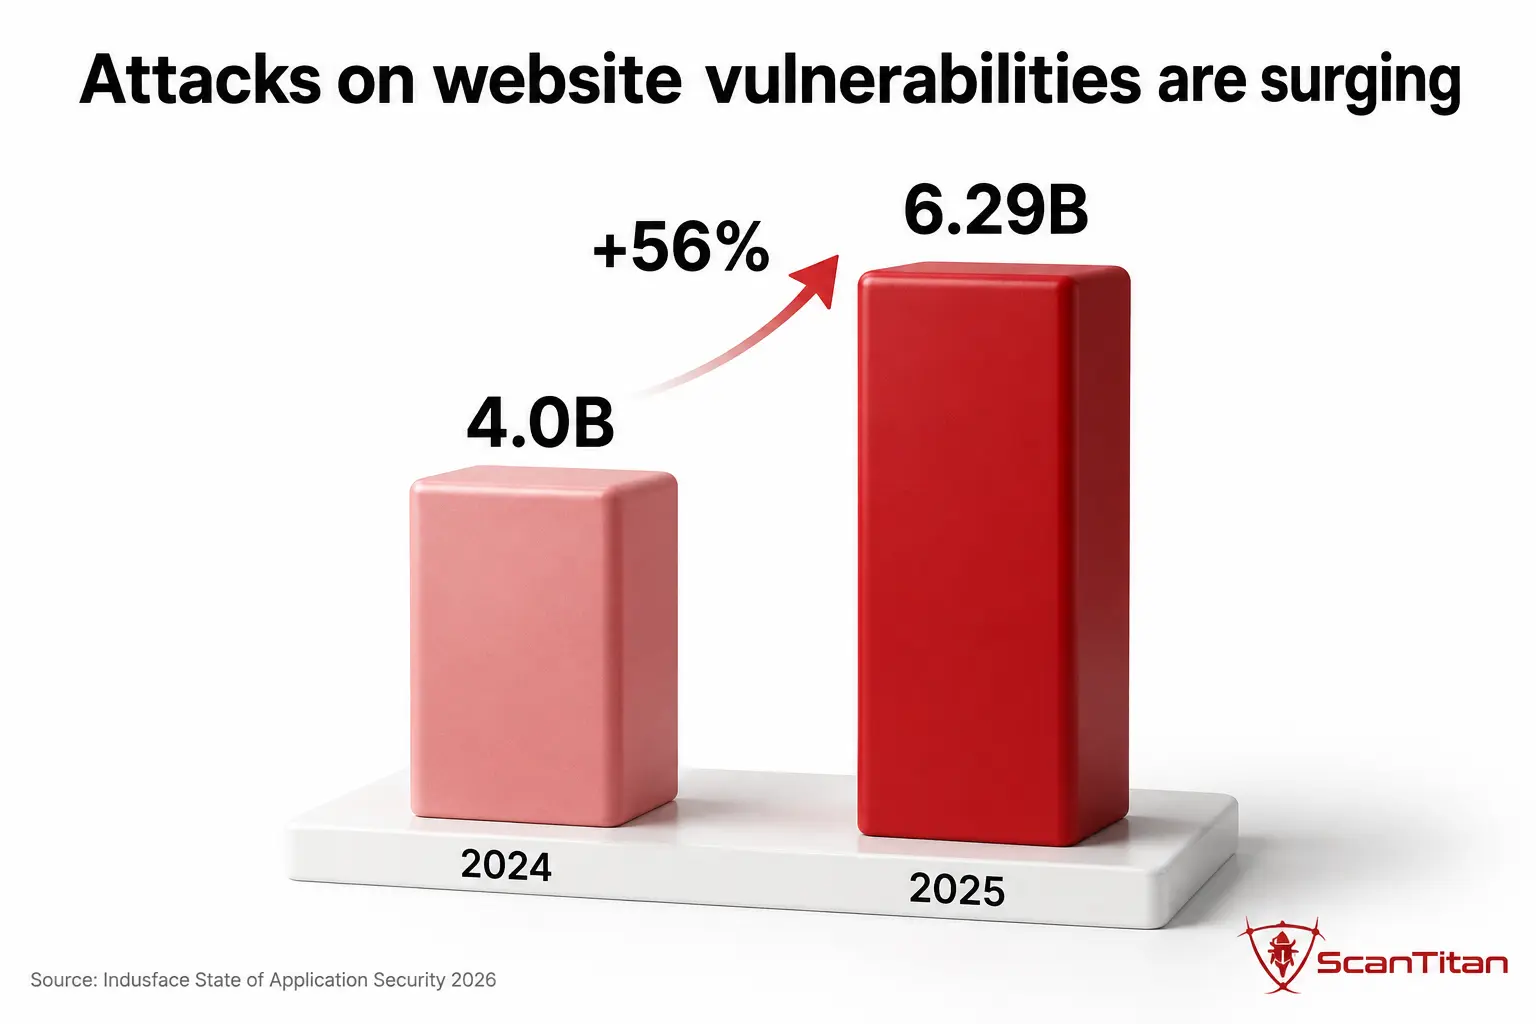
There is no verified global count of websites hacked per day, and any figure presented as one is repeating a number with no transparent methodology behind it. The web holds well over one billion sites, most compromises go unreported, and the firms with real telemetry measure their own datasets rather than the whole internet. What can be measured is attack pressure and vendor detections, both of which are large and rising. Indusface recorded 6.29 billion attacks targeting website vulnerabilities in 2025, up 56% from 4 billion the prior year, a measure of attack activity rather than successful compromises (Indusface 2026). A small team running one brochure site sits under the same automated pressure as a large enterprise, because the scanning bots do not check headcount before they probe.
How much of web traffic is automated?
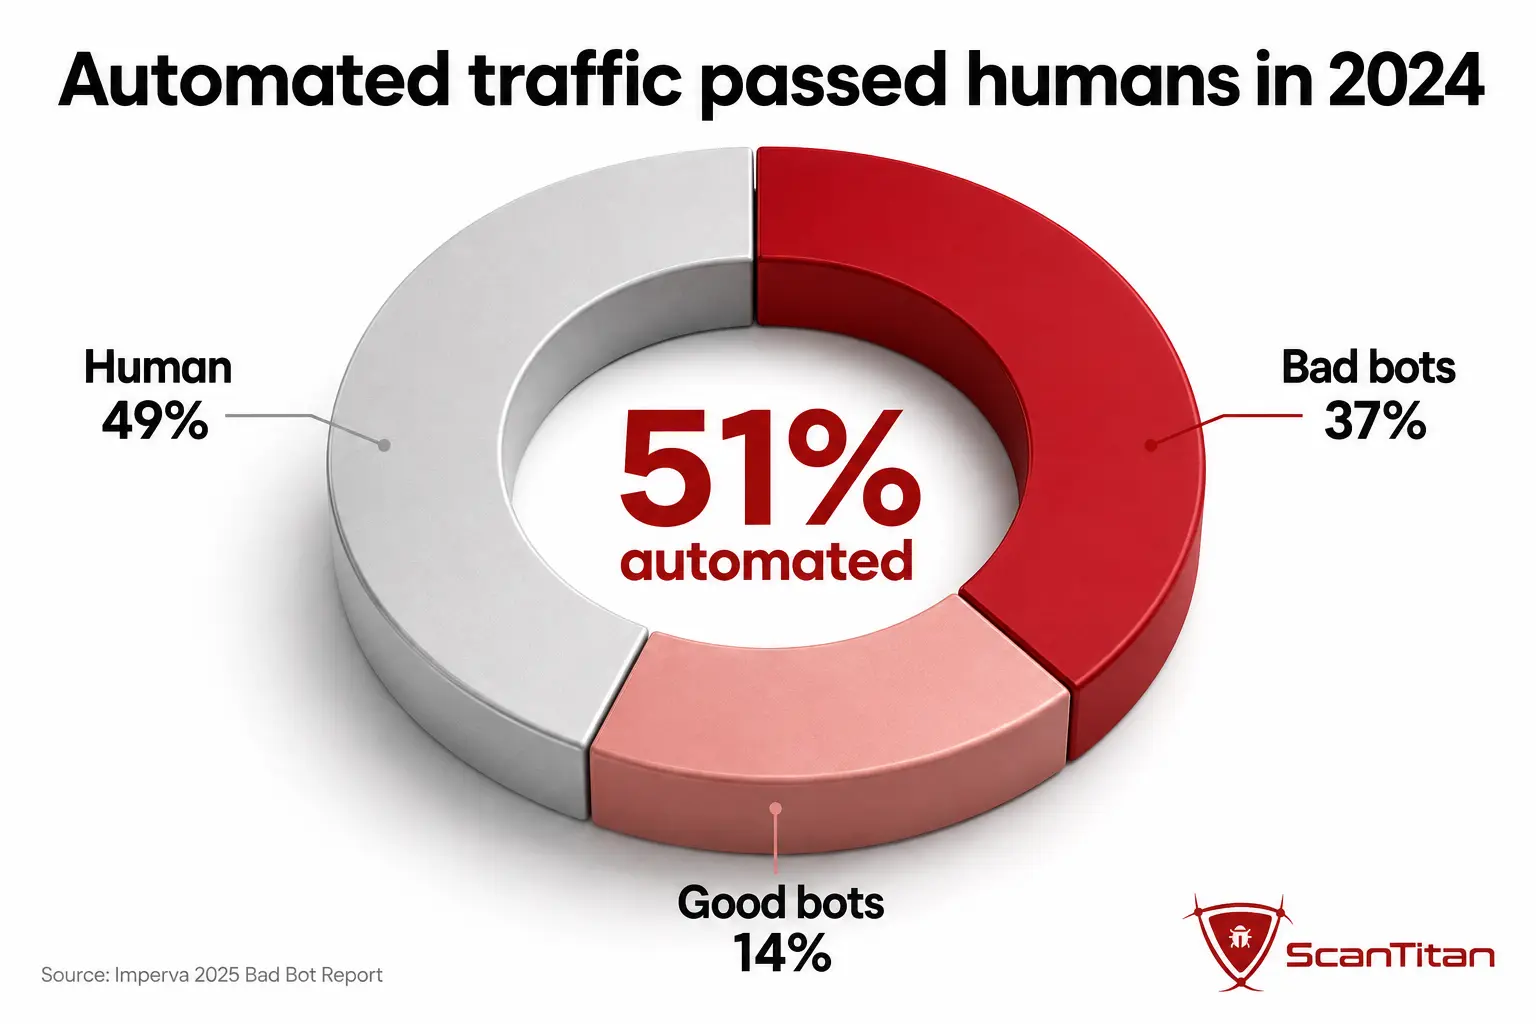
Automated bot traffic now exceeds human web traffic. The Thales/Imperva 2026 Bad Bot Report found that automated traffic reached more than 53% of all web traffic in 2025, up from 51% the year before, with human activity down to 47%. That total splits into two categories that should never be merged: good bots such as search and monitoring crawlers, and bad bots. Bad bots specifically accounted for 40% of web traffic, up from 37%, the seventh straight year of growth. Automated does not mean malicious, and 53% automated traffic is not 53% attacks. What the split does show is that most requests hitting a public site are not human, and that 27% of bot attacks in 2025 targeted application programming interfaces (APIs) directly. External exposure, not internal headcount, sets a site’s baseline risk.
Why websites get hacked: the root causes
Most compromises exploit predictable gaps that scanning finds first, not novel zero day operations.
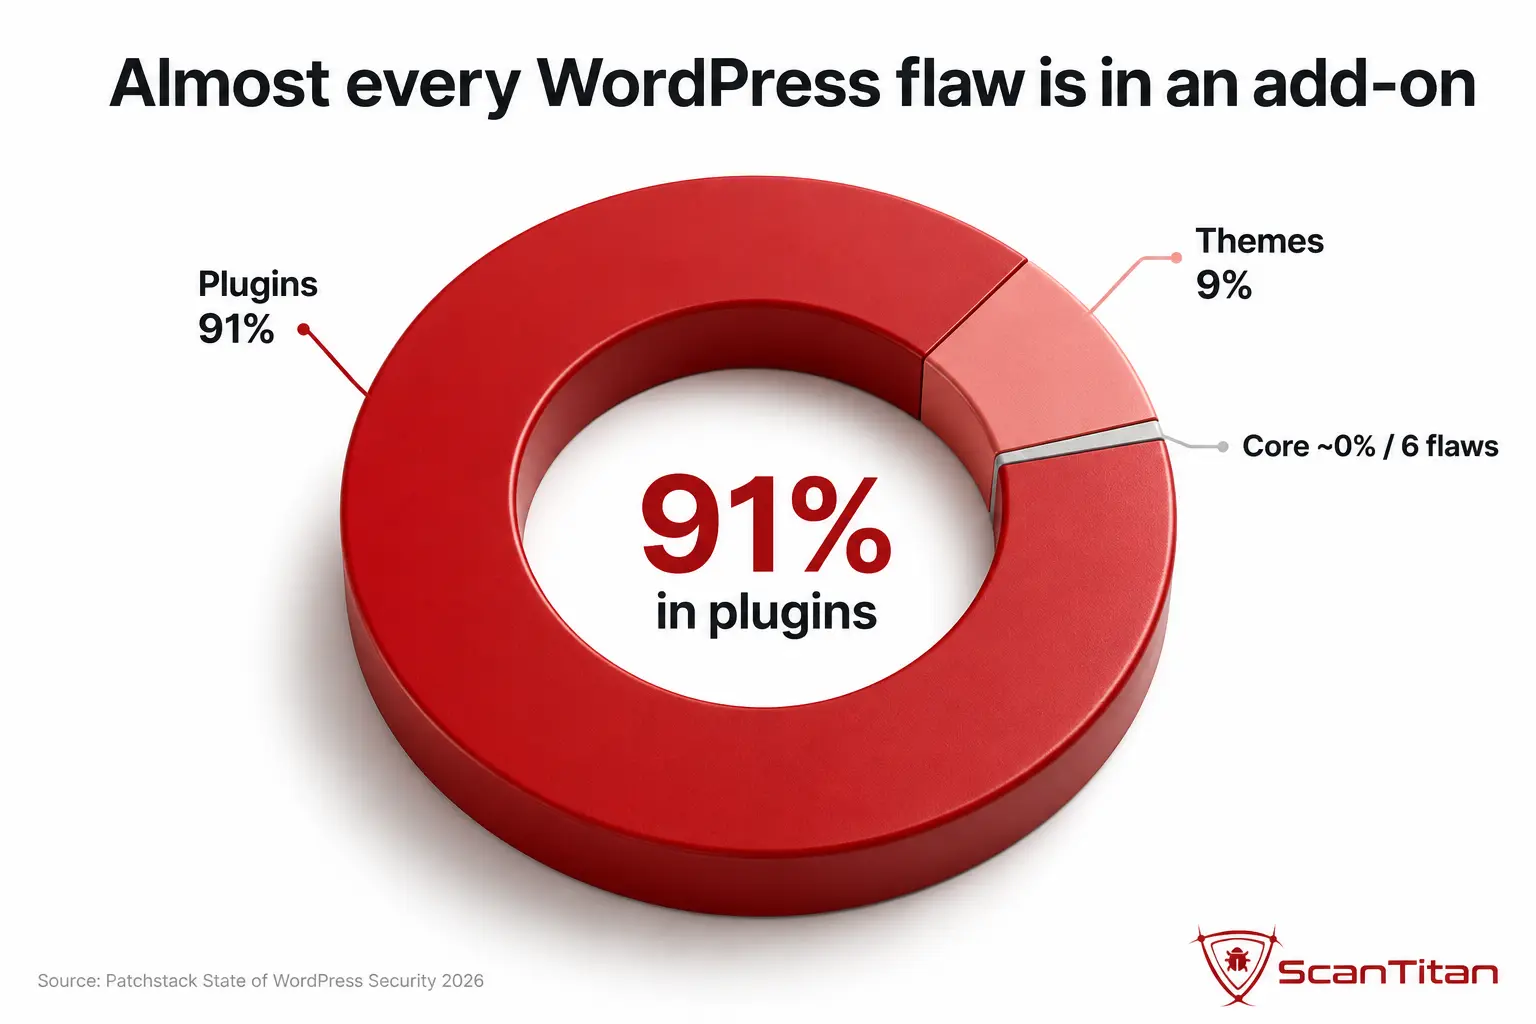
Third-party components carry most of the disclosed risk. Patchstack attributes 91% of 2025 WordPress ecosystem vulnerabilities to plugins and 9% to themes, with only six low priority flaws in core (Patchstack 2026). Read this precisely: it is the share of disclosed WordPress vulnerabilities that sit in add-ons, not a claim that 91% of hacks are caused by plugins. Even so, the direction is clear, and the number of extensions on a site is a better risk proxy than the platform’s brand.
Outdated software widens the window. Slow patching leaves known flaws exposed long after a fix ships, which is why maintenance discipline matters more than any single control.
Weak and stolen credentials open the front door. Compromised credentials remain a major initial access route across breach datasets, so enforcing two factor authentication (2FA) removes a large slice of risk for very little effort, a rare high value control for a lean team.
Website hacking by platform and CMS
WordPress runs a large share of the web and therefore dominates the disclosure data, but the risk concentrates in its extension ecosystem rather than its core. The table below uses a single consistent denominator, share of all websites, so platform reach is not confused with content management system (CMS) market share.
| Platform | Share of all websites | Share among sites with a known CMS | Source |
|---|---|---|---|
| WordPress | 40.8% | 59.0% | W3Techs, retrieved 18 Aug 2026 |
| Joomla | 1.2% | 1.7% | W3Techs, retrieved 18 Aug 2026 |
| Drupal | 0.7% | 1.0% | W3Techs, retrieved 18 Aug 2026 |
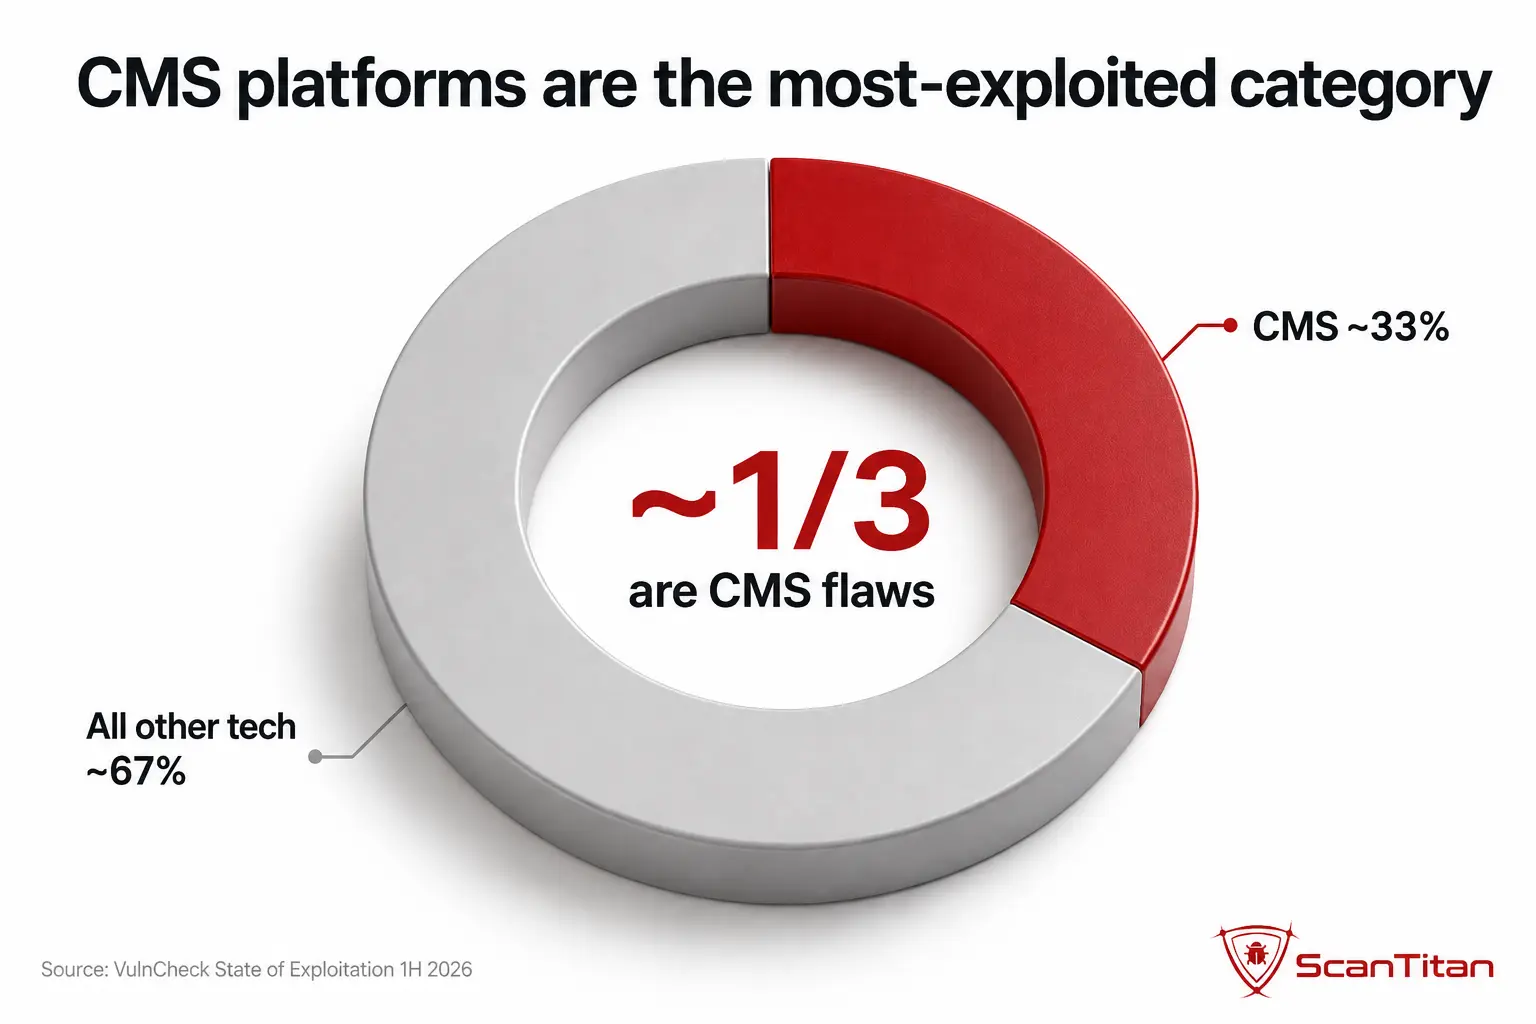
Content management systems as a category carry outsized exploitation risk relative to their footprint. VulnCheck reported that CMS flaws accounted for roughly one third of all Known Exploited Vulnerabilities (KEV, meaning vulnerabilities with confirmed real-world exploitation) added in the first half of 2026, the largest share of any technology category it tracked. Anyone running one of these platforms benefits from scheduled scanning that surfaces an exposed component from their own tooling first.
WordPress specific website hacking statistics
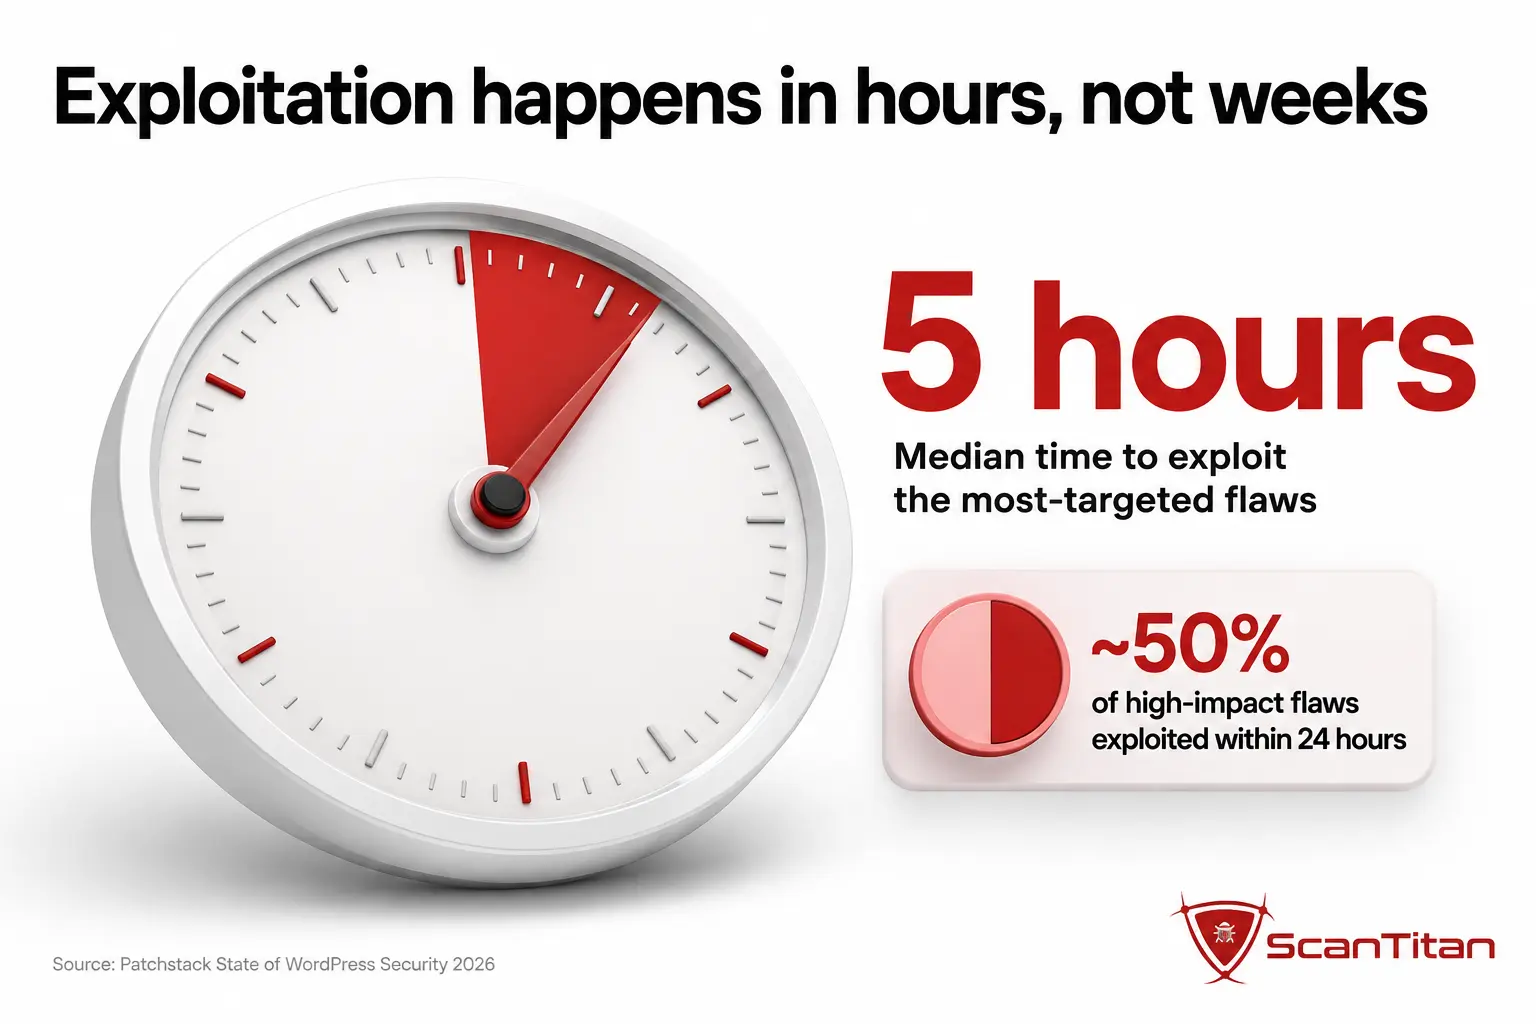
WordPress vulnerability disclosure hit a record in 2025. Patchstack documented 11,334 new ecosystem vulnerabilities, a 42% jump on 2024, with more high severity issues than the previous two years combined. Of those, 1,966 (17%) were rated high severity, and 46% did not receive a developer fix in time for public disclosure. Exploitation is fast for the flaws attackers care about: around half of high impact vulnerabilities were attacked within 24 hours of disclosure. For the heavily exploited subset that accounted for the bulk of observed exploitation activity, Patchstack reported a weighted median time to first exploit of five hours. That five hour figure describes the heavily targeted subset, not every WordPress vulnerability. Site owners on WordPress benefit from a dedicated WordPress vulnerability scanner that flags a risky plugin before that short window closes.
Joomla and Drupal website hacking statistics
Joomla and Drupal run a small fraction of the web compared to WordPress, yet they remain steady targets because attackers automate against known core and extension flaws regardless of market share. Joomla compromises frequently trace to outdated extensions and delayed core updates, the same maintenance failure that drives WordPress infections. Drupal powers relatively few sites but skews toward government, education, and enterprise, which raises the value of each target and the severity of past core vulnerabilities. Teams on these platforms should pair patching discipline with regular scanning through a Joomla vulnerability scanner or a Drupal vulnerability scanner, since manual tracking of every advisory is not realistic for a small team.
Vulnerabilities as the entry point
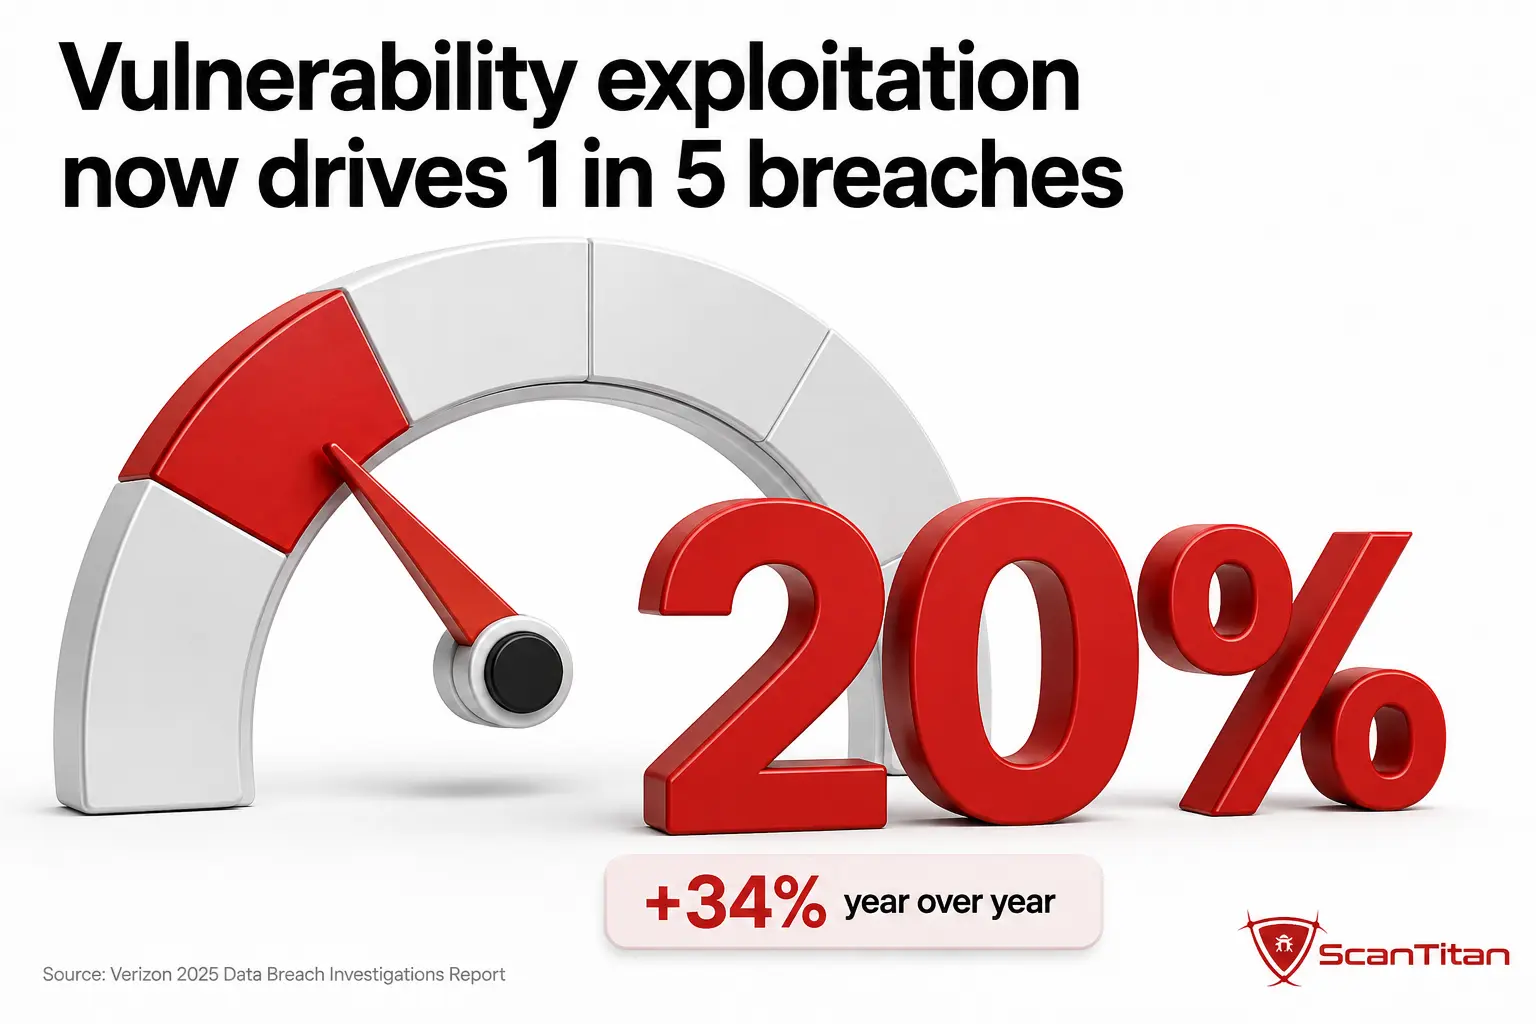
The gap between disclosure and exploitation has nearly vanished, and breach data now reflects it. The Verizon 2026 Data Breach Investigations Report (DBIR) found that exploitation of software vulnerabilities was the leading initial access vector, appearing in 31% of breaches, up from 20% the prior year, a 55% increase, and the first time in the report’s 19 year history that exploitation overtook stolen credentials. That statistic is a breach initial-access measure, not a claim that 31% of websites are hacked through vulnerabilities. The DBIR dataset covers incidents from November 2024 through October 2025.
Exploitation timing supports the same picture. VulnCheck’s State of Exploitation report for the first half of 2026 found that 23.43% of KEVs showed exploitation evidence on or before the day the vulnerability was published, and that the median time from publication to KEV status fell to 80 days, from 120 days in 2025. Indusface counted 131 new Common Vulnerabilities and Exposures (CVEs) disclosed per day in 2025. Mandiant’s M-Trends 2026 put the broader estimated mean time to exploit at roughly negative seven days, meaning exploitation can begin before an official patch is available. The practical stance: severity scores alone no longer set priority. A vulnerability that is confirmed as exploited belongs at the top of the queue, ahead of higher scores that nobody is attacking.
The vulnerability disclosure trend, 2023 to 2025
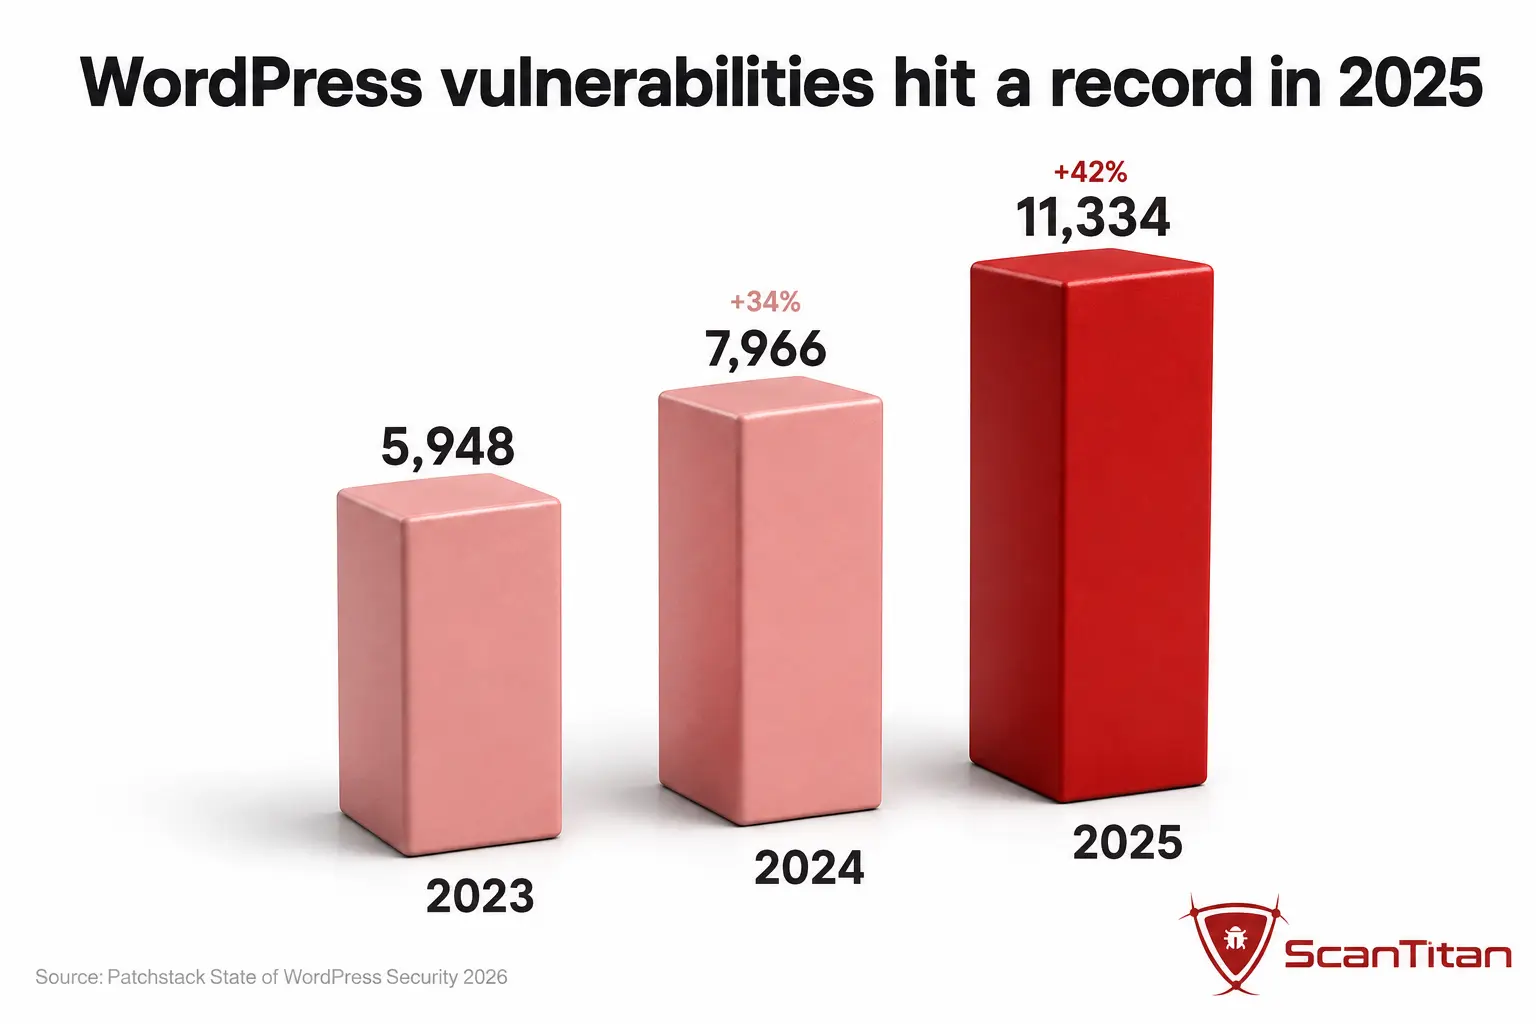
Disclosure volume is not just high, it is accelerating, and the trend line matters more than any single year. Patchstack recorded a steady climb across three years in the WordPress ecosystem, and the count of highly exploitable flaws rose sharply over the same window. Two details sharpen the risk. First, 43% of the 2024 vulnerabilities required no authentication to exploit, exactly the profile automated attacks prefer, since a bot needs no login to fire. Second, disclosed volume does not equal compromised sites; it is the size of the exposure surface, not the count of break-ins.
| Year | New WordPress ecosystem vulnerabilities | Change |
|---|---|---|
| 2023 | 5,948 | baseline |
| 2024 | 7,966 | +34% |
| 2025 | 11,334 | +42% |
Malware and website infections
Once attackers are in, the payload usually earns money quietly rather than defacing the homepage. The clearest current picture comes from vendor scanning telemetry, which must be read as vendor telemetry rather than a census of the web. The Sucuri SiteCheck Malware Trends Report 2024 recorded 70.8 million remote website scans and detected 1,176,701 infected websites, an overall infection rate of 1.66% across those scans. It logged 822,651 malware and malicious redirect detections and 422,741 websites affected by search engine optimization (SEO) spam, with 149,351 Balada Injector detections and 147,332 SocGholish detections. These figures describe Sucuri’s SiteCheck dataset, not the whole internet.
Detection is genuinely hard, which is why response matters as much as prevention. Sucuri’s 2024 analysis describes how major campaigns route compromised traffic through traffic distribution systems that actively filter out security researchers and automated scanners, so a site can be infected and serving scam redirects while still appearing clean to a casual check. A compromised site needs professional website malware removal rather than a single surface scan that misses server side backdoors.
Historical cleanup data (Sucuri 2023 remediation dataset)
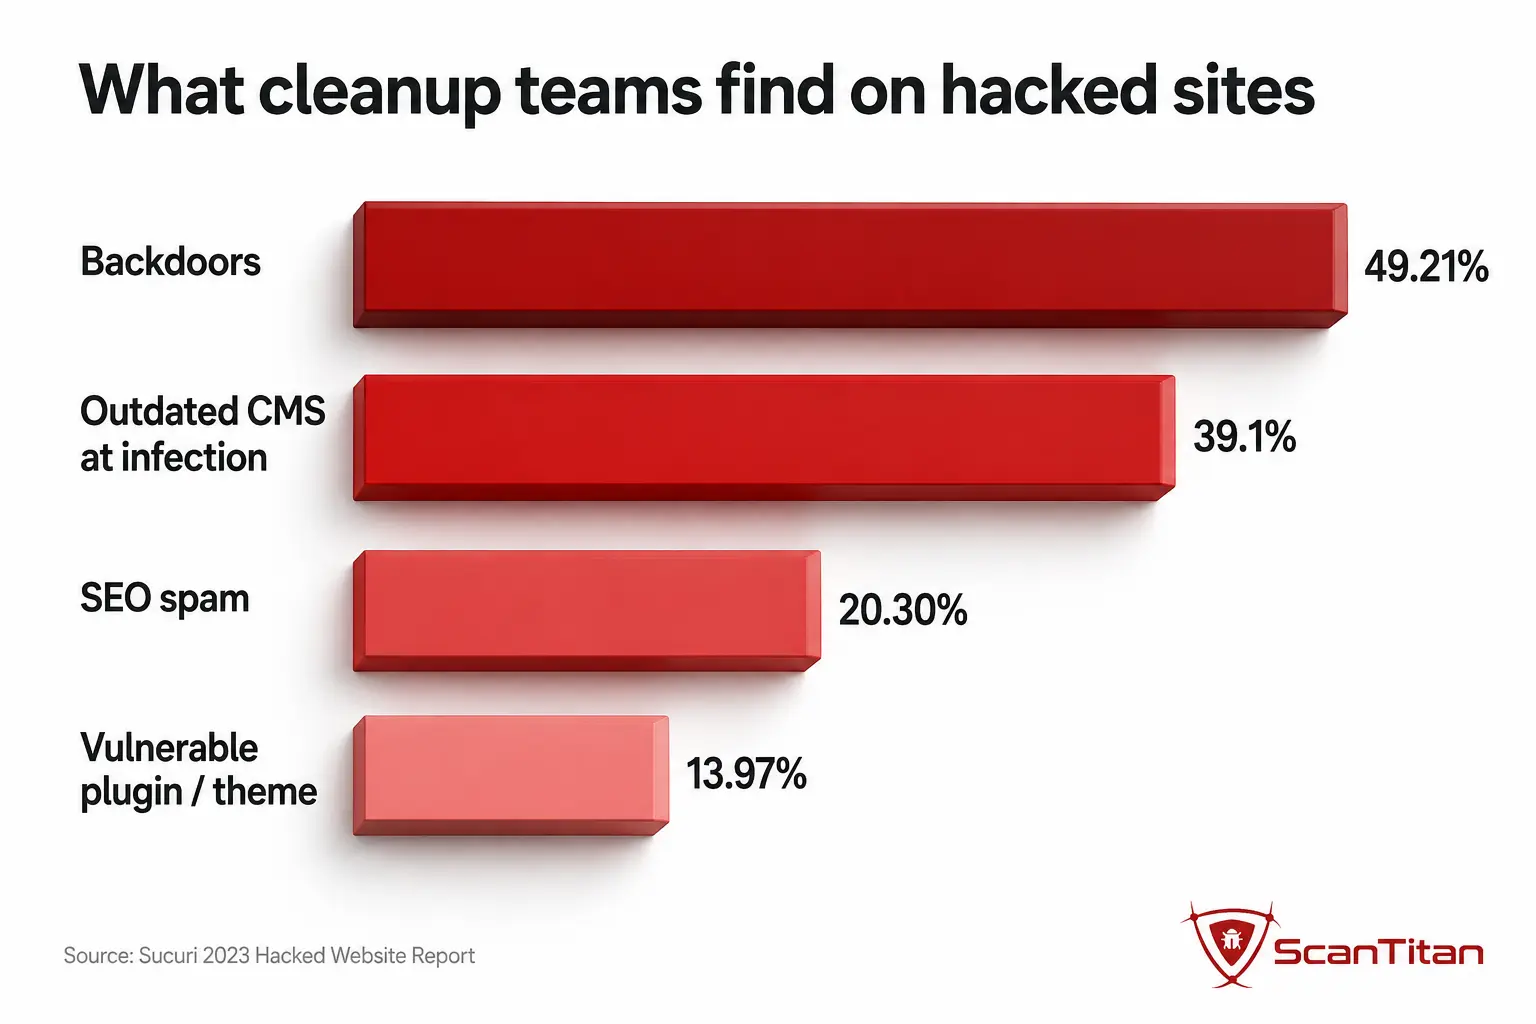
Sucuri’s earlier 2023 Hacked Website Report, based on its incident response cleanup dataset rather than remote scans, adds root-cause context. In that 2023 remediation sample, backdoors appeared on 49.21% of compromised sites, 39.1% of CMS applications were outdated at the point of infection, SEO spam was present on 20.30% of infected sites, and 13.97% still ran at least one vulnerable plugin or theme when cleanup began. These are 2023 cleanup figures from Sucuri’s customer base, useful for understanding how infections take hold, not as current-year totals.
The cost and impact of a hacked website
The financial damage is documented even where the volume of hacks is not. IBM’s Cost of a Data Breach Report 2026 put the global average organizational breach at 4.99 million dollars, a record and a 12% rise year over year, based on 602 organizations breached between March 2025 and February 2026. One precision note matters for this page: that figure is the average cost of an organizational data breach, not the average cost of a single hacked website. For a small business the relevant impact is different in kind: recovery, downtime, and lost trust that compound when there is no incident response plan and no clean backup to restore from.
Beyond direct cost sit three quieter penalties. Search visibility drops when a search engine detects SEO spam or malware and shows a warning, which can erase months of organic growth. Blocklisting cuts off email deliverability and browser access at once. Reputation damage lingers after the code is clean. A single unpatched plugin can trigger all three, which is why routine scanning stays far cheaper than remediation and recovery.
Small business website risk
Small businesses face the same automated and vulnerability-driven threat environment as larger organizations, usually with fewer defensive resources. In Verizon’s 2026 DBIR small and medium sized business (SMB) dataset, which covered 7,256 incidents and 7,152 confirmed breaches, exploitation of vulnerabilities was the leading initial access vector at 26%, followed by credential abuse at 13% and phishing at 9%. Third-party involvement appeared in 55% of these breaches and the human element in 45%, and Verizon notes that small organizations are disproportionately affected by ransomware.
The business implication is practical, not alarmist. The controls that remove the most SMB risk are also the cheapest: keep software current, enforce 2FA, reduce the plugin count, and scan on a schedule so exposure surfaces from your own tooling first. A lean team cannot read every advisory, so automation has to do the watching. That is the case for transparent, self serve scanning aimed at smaller sites rather than enterprise pricing that assumes a dedicated security operations center.
Statistics to stop citing
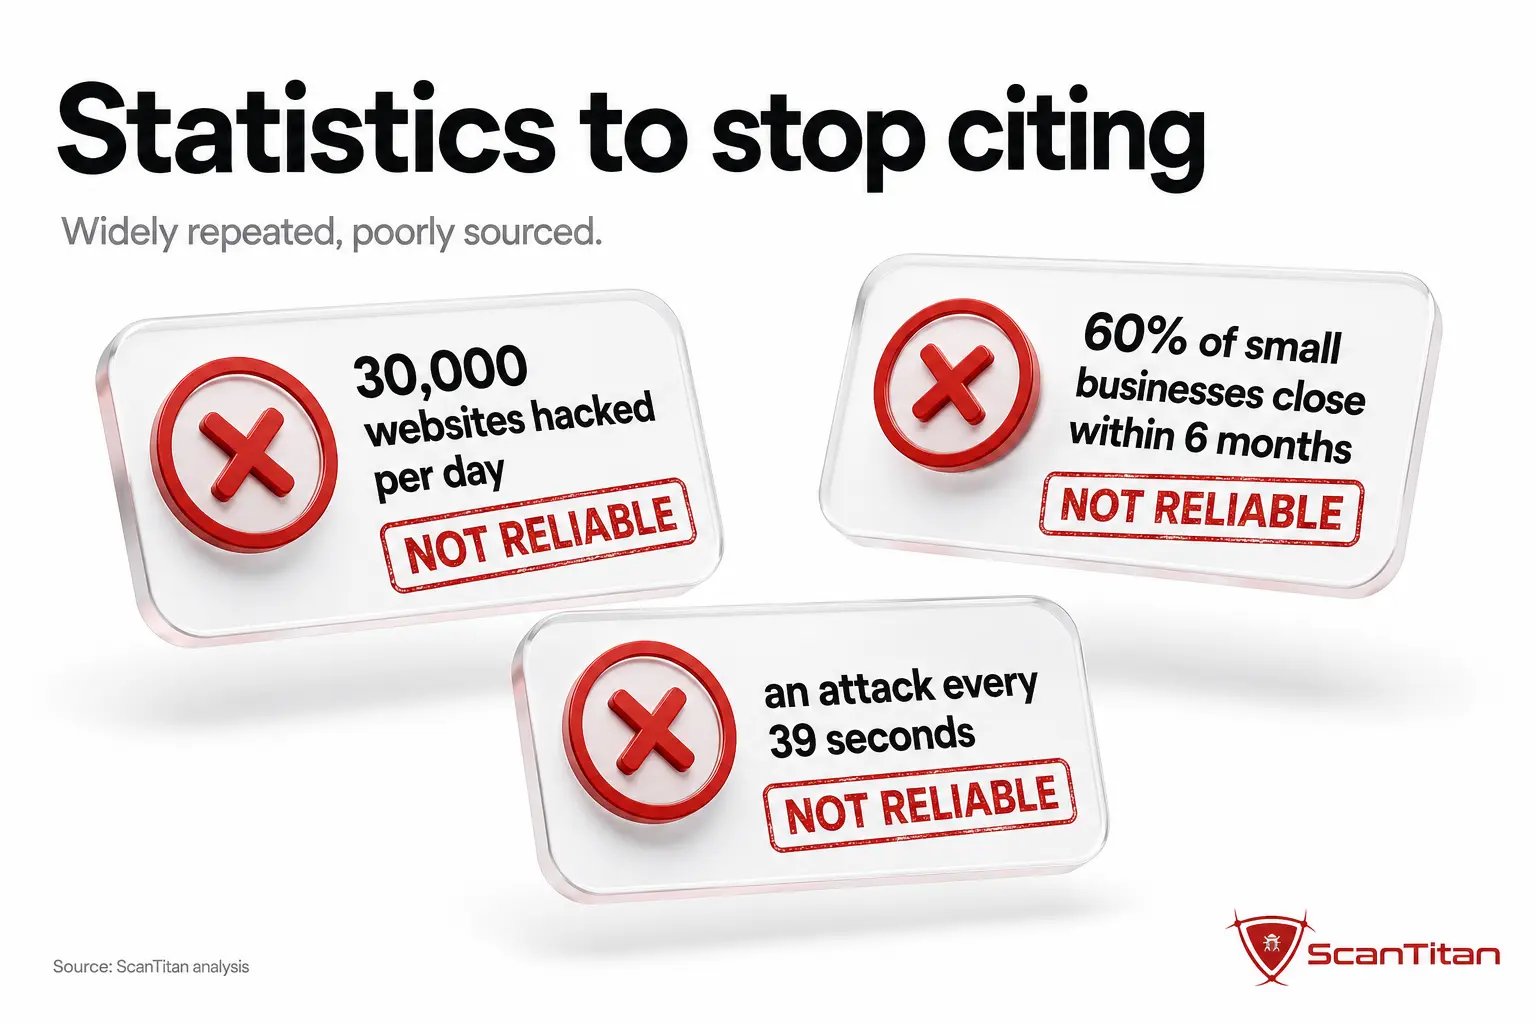
Part of publishing honest website hacking statistics is refusing to repeat numbers that do not hold up. Each of the following is widely repeated and should be retired, with a better sourced alternative named.
“30,000 websites are hacked every day”
This figure does not come with a transparent, current global methodology for measuring every successful website compromise worldwide. Older references often describe newly detected malicious or compromised sites within a specific vendor dataset rather than a measured worldwide count of successful website hacks, and those are not the same thing. It should not be cited as a current daily hack total. Use measurable alternatives instead: attack volume from Indusface, and infection detections from Sucuri’s SiteCheck dataset, each labeled for what it measures.
“60% of small businesses close within six months of a cyberattack”
The National Cybersecurity Alliance stated in 2022 that this statistic did not come from its research, that it could not verify the original source, that it removed references to it, and that it does not recommend continued use. The organization’s own correction is the primary record. Use current Verizon DBIR SMB data when discussing small business impact.
“There is a hacker attack every 39 seconds”
This comes from a University of Maryland study dated February 2007, led by Michel Cukier, and its announcement is the primary record. The researchers set up four Linux computers with deliberately weak security and recorded automated brute force attacks against those test systems, averaging 2,244 attacks per day per machine. The study is real and useful in context, but it measured automated probes against a small lab setup nearly two decades ago, not modern successful website compromises, and should not be presented as a current website-hack rate. Use current exploit and bot telemetry instead.
Source-lineage verification table
| Popular claim | Verdict | What the source actually supports | Use instead |
|---|---|---|---|
| 30,000 websites hacked every day | Unsupported as a global daily total | No transparent, current global methodology for successful compromises | Indusface attack volume + Sucuri SiteCheck detections |
| 60% of SMBs close within 6 months | Do not cite | The National Cybersecurity Alliance says it did not produce or verify it | Current Verizon DBIR SMB data |
| A hacker attack every 39 seconds | Historical lab result, not a current website-hack rate | 2007 UMD test of four weakly secured Linux machines | Current exploit and bot telemetry |
How to reduce your risk
The data points to a short, high impact checklist rather than a long program.
Patch on a schedule, not on discovery. With exploitation of the most targeted WordPress flaws measured in hours, waiting until you notice a problem is waiting too long.
Cut the plugin count. Every extension is code you did not review from a developer you cannot audit, and add-ons hold the large majority of disclosed WordPress vulnerabilities.
Enforce 2FA and strong credentials. Compromised credentials remain a major initial access route, and 2FA removes most of that risk for minimal effort.
Scan continuously and fix exploited findings first. Prioritize vulnerabilities with confirmed exploitation over raw severity. A website vulnerability scanner that runs on a schedule turns the ambient background of automated attacks into a list a small team can actually work through.
Methodology and sources
This page is a source audit of website hacking statistics, built on these principles:
- It prioritizes primary-source reports and links them directly.
- It does not normalize different datasets into one invented “global hacked websites” number, because the datasets measure different things.
- It labels vendor telemetry with the vendor and the dataset scope.
- It does not count attack attempts as successful compromises.
- It does not count vulnerability disclosures as breaches.
- It does not treat organization-level breach cost as website remediation cost.
- It shows a retrieval date for dynamic figures such as W3Techs market share.
- It is reviewed quarterly, and the last-updated date appears near the top.
- It requires traceable source lineage before repeating any popular claim, and flags claims that fail that test.
Primary sources used: Thales/Imperva 2026 Bad Bot Report; Patchstack State of WordPress Security in 2026; Sucuri SiteCheck Malware Trends Report 2024 and the Sucuri 2023 Hacked Website Report; Indusface State of Application Security 2026; VulnCheck State of Exploitation 1H 2026; Verizon 2026 Data Breach Investigations Report; IBM Cost of a Data Breach Report 2026; Mandiant M-Trends 2026; and W3Techs CMS usage data retrieved 18 August 2026. You are welcome to cite this page with a link back to ScanTitan.
Frequently asked questions
How many websites get hacked every day?
No credible verified single global daily total exists. What can be measured is attack volume and vendor detections: Indusface recorded 6.29 billion attacks targeting website vulnerabilities in 2025 (attack activity, not compromises), and Sucuri’s SiteCheck dataset detected 1,176,701 infected websites across 70.8 million scans in 2024 (vendor scanning telemetry, not a global census). Neither equals a worldwide count of successful hacks, and dividing an annual attack count into a daily figure does not produce one.
What is the most common cause of a website being hacked?
Third-party components are a major website risk, particularly in WordPress: Patchstack found 91% of 2025 WordPress ecosystem vulnerabilities in plugins and 9% in themes. That is the share of disclosed vulnerabilities, not the share of successful hacks. Across broader breach datasets, vulnerability exploitation, stolen credentials, and phishing remain the major initial-access routes.
Is WordPress secure?
WordPress core is well maintained, with only six low priority vulnerabilities in Patchstack’s 2025 dataset. The ecosystem risk is concentrated in third-party plugins and themes, which held the other 99% plus of disclosed vulnerabilities that year. That does not prove WordPress is universally secure, but a site kept updated, with few plugins and two factor authentication enabled, is far harder to compromise.
How fast are website vulnerabilities exploited?
For the heavily exploited subset of WordPress flaws, Patchstack reported a weighted median time to first exploit of five hours in 2025, and about half of high impact vulnerabilities were attacked within 24 hours of disclosure. Separately, Mandiant’s broader M-Trends 2026 estimate puts the mean time to exploit at roughly negative seven days, meaning exploitation can precede a patch. These are two different datasets and should not be merged.
How much does a hacked website cost a business?
IBM’s Cost of a Data Breach Report 2026 puts the global average at 4.99 million dollars, up 12% year over year. That figure is the average cost of an organizational data breach, not the average cost of a single hacked website. For small businesses the practical cost is downtime, lost search visibility from SEO spam or blocklisting, and reputation damage that outlasts the cleanup.
Reviewed by Obaida Al-Sulaiman, Information Security Manager (CISSP, GWAPT, GXPN, GCIH, CEH), on August 18, 2026.