

Open ports statistics describe the internet from four different angles, and the numbers do not convert into each other. Shadowserver’s daily scans found about 16.1 million IP addresses with SSH reachable and 1.7 million with RDP reachable in the week of 12 to 18 October 2026. Censys counted about 134,000 industrial control system hosts exposed to the internet. CISA’s catalog of known exploited vulnerabilities reached 1,748 entries, and ScanTitan counted 335 of them in products from 21 selected network-edge vendors. Verizon’s 2026 DBIR found that 44% of initial-access-broker offers were for VPN access. An open port is a door, an exposed service is something answering behind it, a vulnerable instance is a version with a known flaw, and a known exploited vulnerability is a flaw attackers have already used. This research keeps those four units apart, dates every count, and flags where two sources measuring the same thing disagree. Data last checked: 20 October 2026.
Key Open Ports Statistics for 2026
Executive Benchmark: Open Ports Statistics for 2026
| Metric | Latest figure | Period | Trend / context | Source |
|---|---|---|---|---|
| IP addresses with SSH reachable | 16,123,849 | 12 to 18 Oct 2026, 7-day mean | 18,117,400 a year earlier (−11.0%) | Shadowserver dashboard |
| IP addresses with RDP reachable | 1,724,327 | 12 to 18 Oct 2026, 7-day mean | 2,172,970 a year earlier (−20.6%) | Shadowserver dashboard |
| IP addresses with Telnet reachable | 611,029 | 12 to 18 Oct 2026, 7-day mean | 1,288,346 a year earlier (−52.6%) | Shadowserver dashboard |
| IP addresses with SMB reachable | 675,172 | 12 to 18 Oct 2026, 7-day mean | 801,130 a year earlier (−15.7%) | Shadowserver dashboard |
| IP addresses with MongoDB reachable | 45,684 | 12 to 18 Oct 2026, 7-day mean | 84,372 a year earlier (−45.9%) | Shadowserver dashboard |
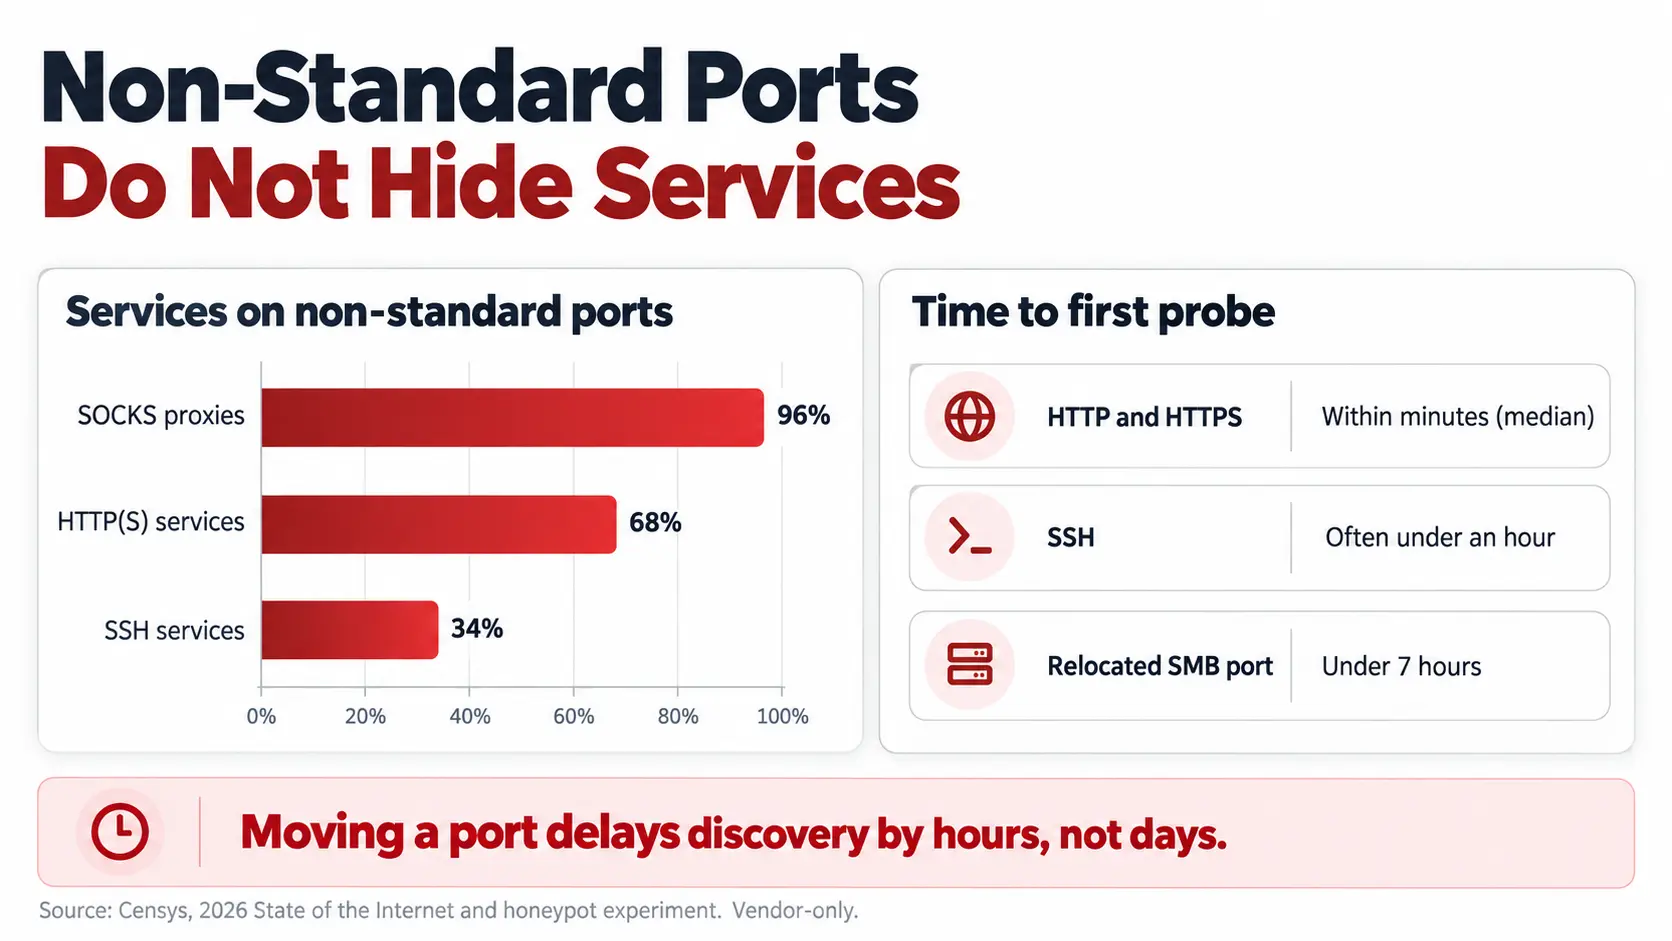
| Services on non-standard ports | 96% of SOCKS, 68% of HTTP(S), 34% of SSH | Censys 2026 State of the Internet | Vendor-only scan data | Censys |
| Exposed ICS hosts | About 134,000 | Early 2026 average | Up about 4% from about 129,000 in 2024; about 70% on consumer and mobile networks | Censys |
| Exposed n8n hosts | 113,926 | Censys 2026 State of the Internet | 76% in an affected version range | Censys |
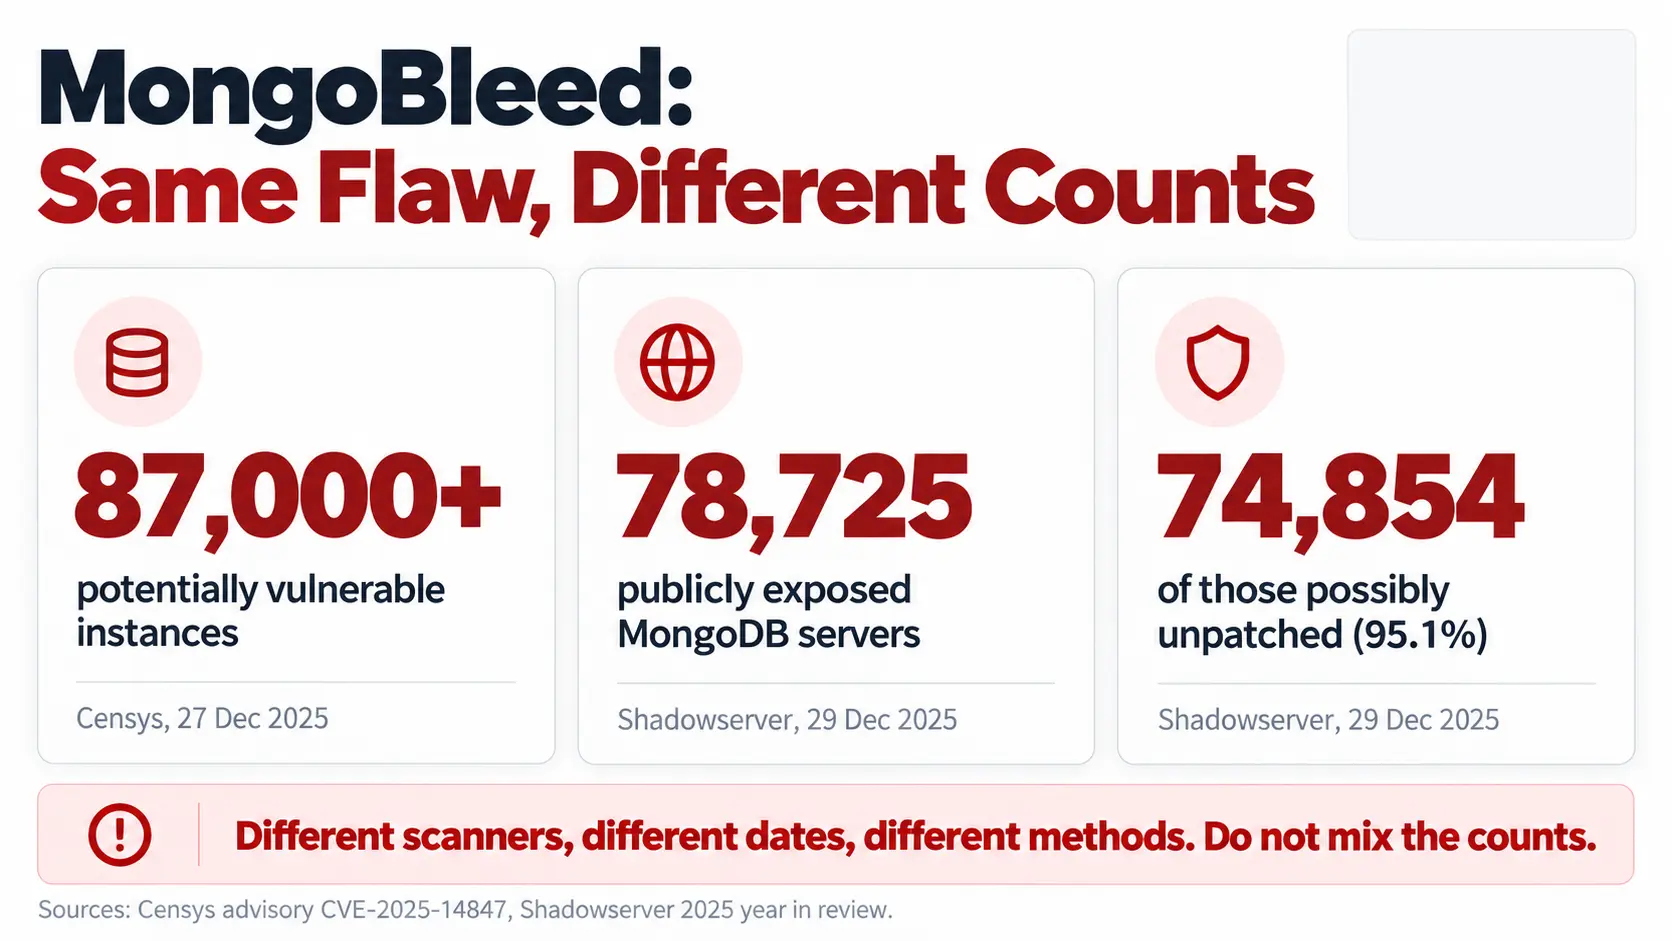
| MongoBleed, potentially vulnerable (Censys) | 87,000+ | 27 Dec 2025 | Different scanner from Shadowserver’s count below | Censys advisory |
| MongoBleed, possibly unpatched (Shadowserver) | 74,854 of 78,725 | 29 Dec 2025 | Same flaw, different count and date | Shadowserver year in review |
| CISA KEV catalog size | 1,748 | Catalog version 2026.10.16 | 264 added in 2026 so far vs 245 in all of 2025; 361 (20.7%) ransomware-linked | CISA KEV feed, counted by ScanTitan |
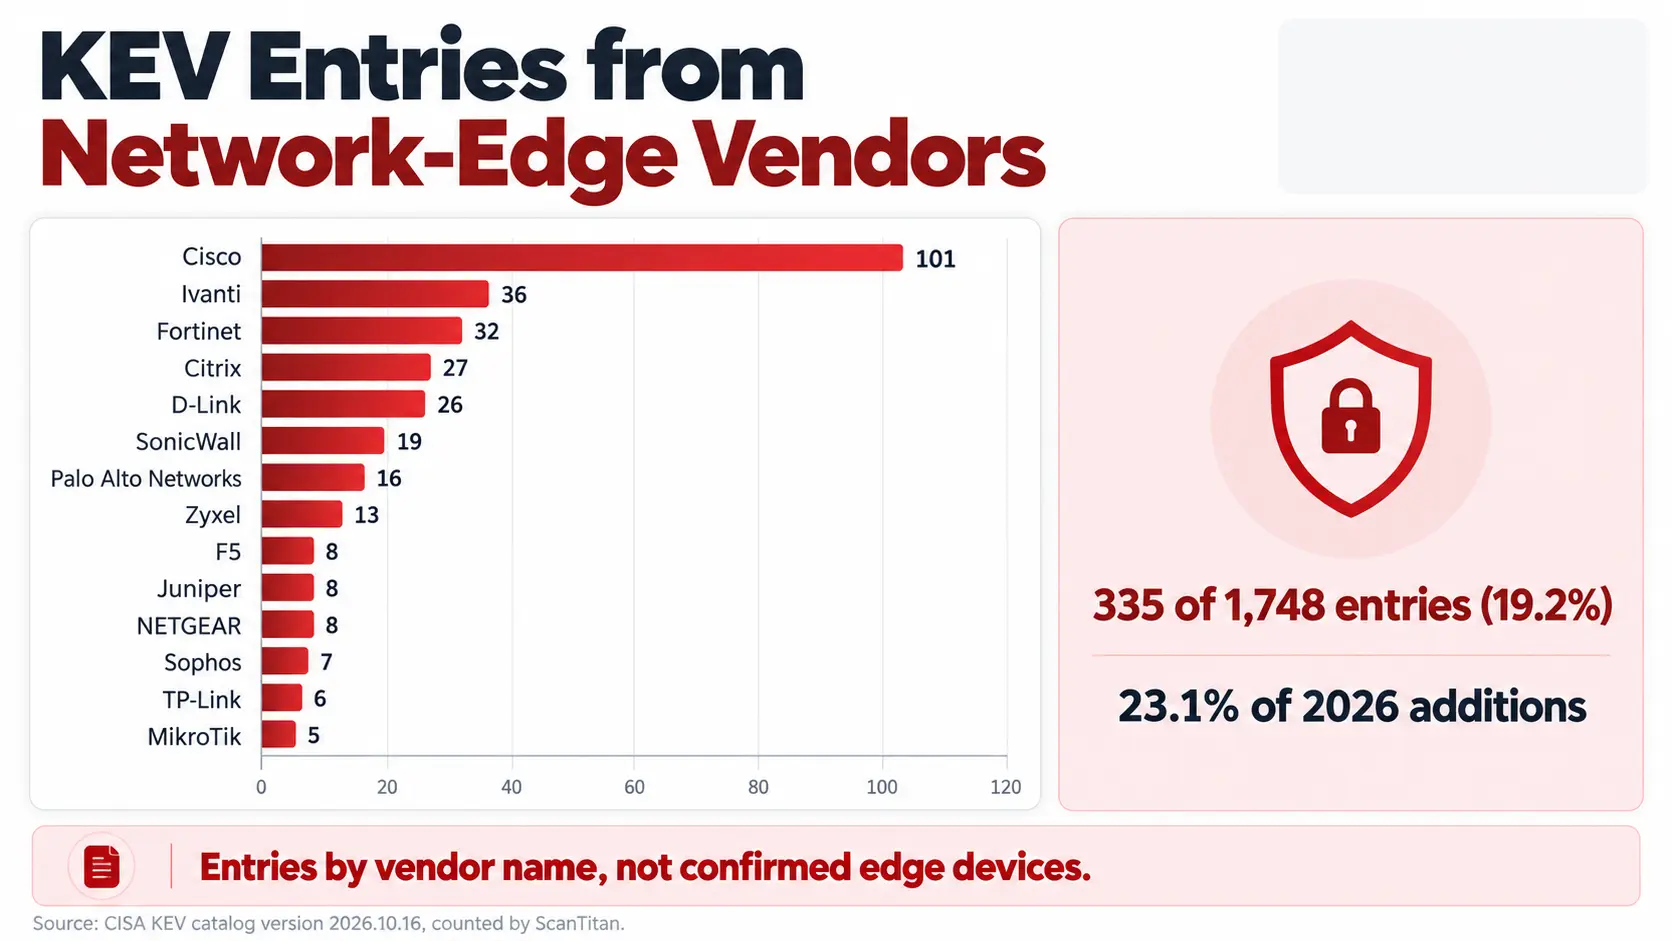
| KEV entries from selected network-edge vendors | 335 (19.2%) | Catalog version 2026.10.16 | 22.0% of 2025 additions, 23.1% of 2026 additions | CISA KEV feed, counted by ScanTitan |
| Exploited vulnerabilities in end-of-life edge products | 42.5% | Vulnerabilities exploited in 2025 | Affecting end-of-life or likely end-of-life devices; vendor-only | VulnCheck |
| VPN share of initial-access-broker offers | 44% | n=876 offers over four years | RDP and similar remote desktop close behind | Verizon 2026 DBIR |
Methodology: What Counts as an Open Port?
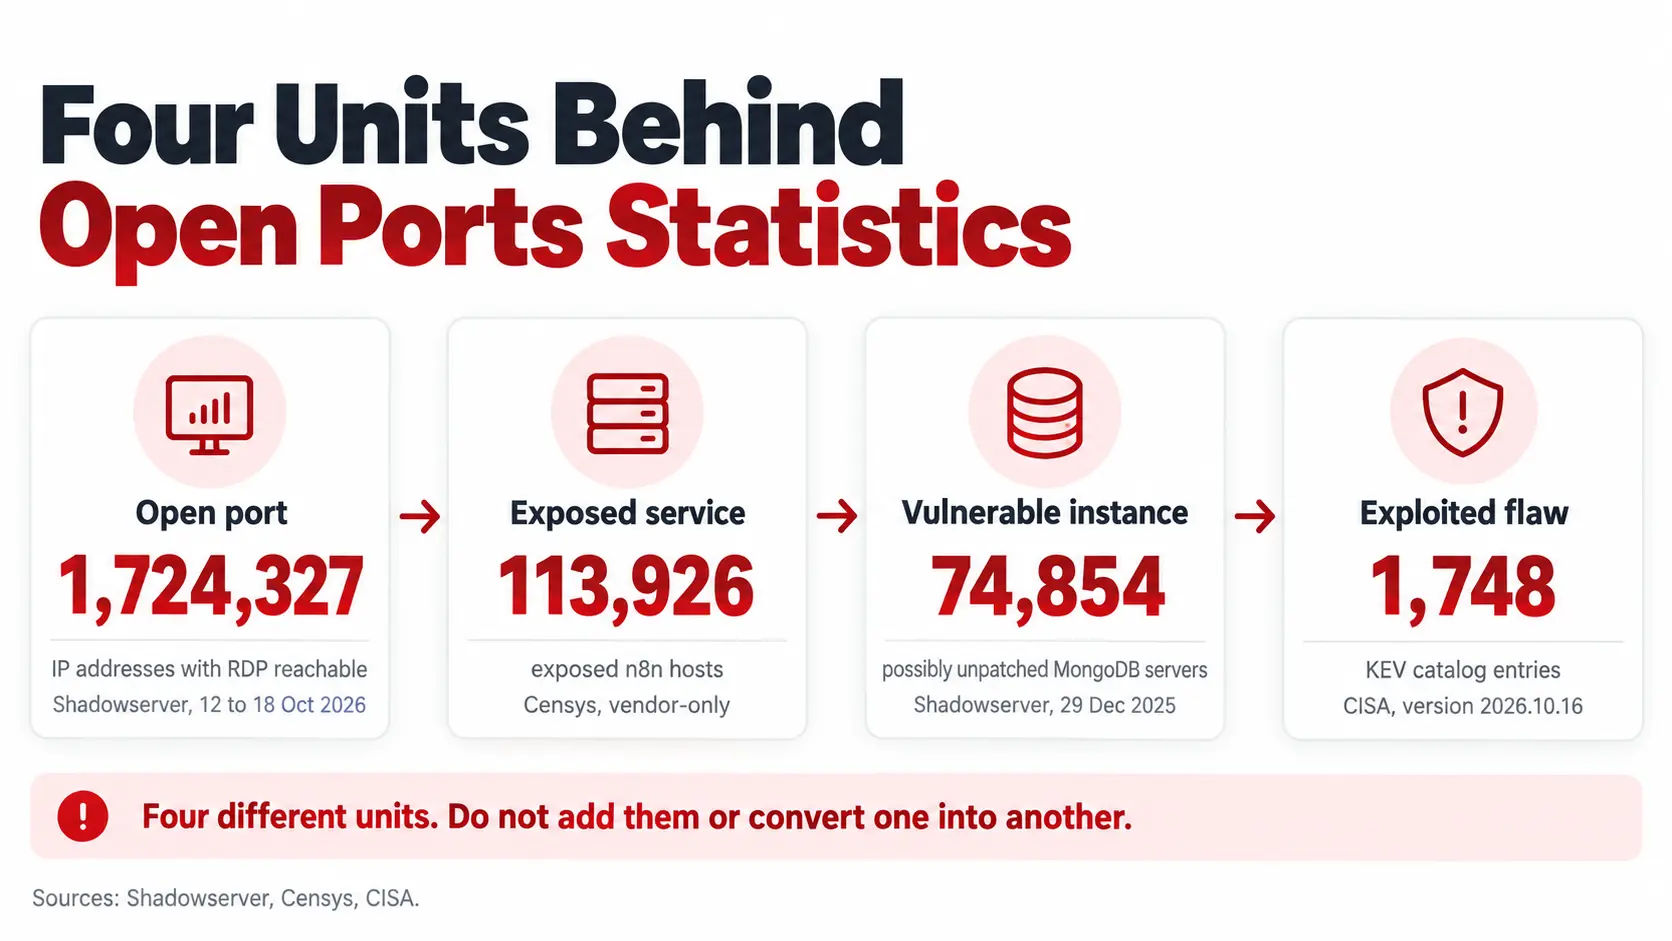
“Open ports statistics” is used for four different measurements. Each answers a different question, comes from a different kind of source, and can be wrong in a different way.
| Unit | What it counts | Example 2026 figure | Source type | What it cannot tell you |
|---|---|---|---|---|
| Open port | An IP address that answers on a given port when scanned | 1,724,327 IP addresses with RDP reachable (Shadowserver) | Internet scans | Whether the service is vulnerable, or whether a person is behind the address |
| Exposed service | A recognized product or protocol answering, often on any port | 113,926 exposed n8n hosts (Censys) | Vendor scan data | Which versions are patched, or who owns the host |
| Vulnerable instance | An exposed service in a version range with a known flaw | 74,854 possibly unpatched MongoDB servers (Shadowserver) | Scanner plus version check | Whether anyone exploited it |
| Known exploited vulnerability | A flaw with reliable evidence of exploitation | 1,748 KEV entries; 335 from selected edge vendors | CISA catalog | How many internet-facing systems carry the flaw |
Source confidence. Shadowserver publishes daily counts of unique IP addresses from its own scans. Its year in review describes more than 10,000 subscribing organizations and 201 national CSIRTs covering 175 countries, which makes it the broadest free public record. Censys is a commercial scanner; its counts describe what its scanners saw, which differs from what Shadowserver or any other scanner saw. CISA’s catalog is a floor of confirmed exploitation, not a census. Verizon’s DBIR is a contributed corpus of incidents, so it says how attackers got in, not how many doors exist. An IP address is not a device, an organization or a person.
Counting rules used here. Daily scan counts are noisy, so every Shadowserver figure in this report is a 7-day mean of daily unique IP counts, and the year-over-year comparison uses the same 7-day window one year earlier. A figure is never converted between units. Vendor-only data is labeled as such.
Open Ports Statistics: The Most Exposed Services in 2026
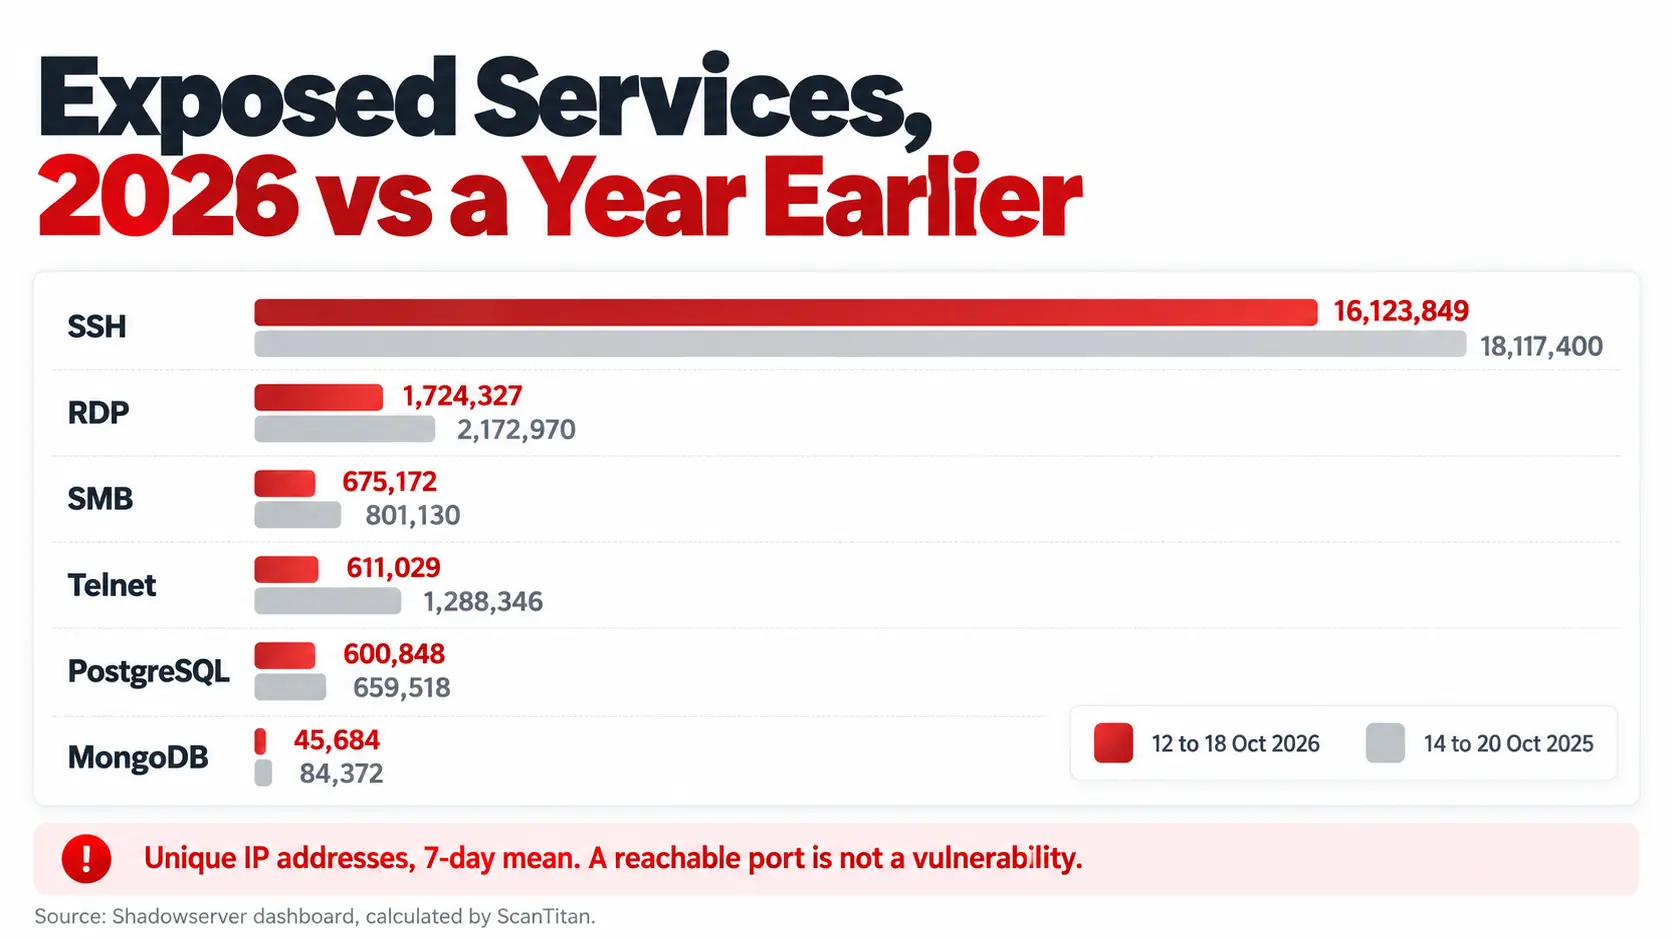
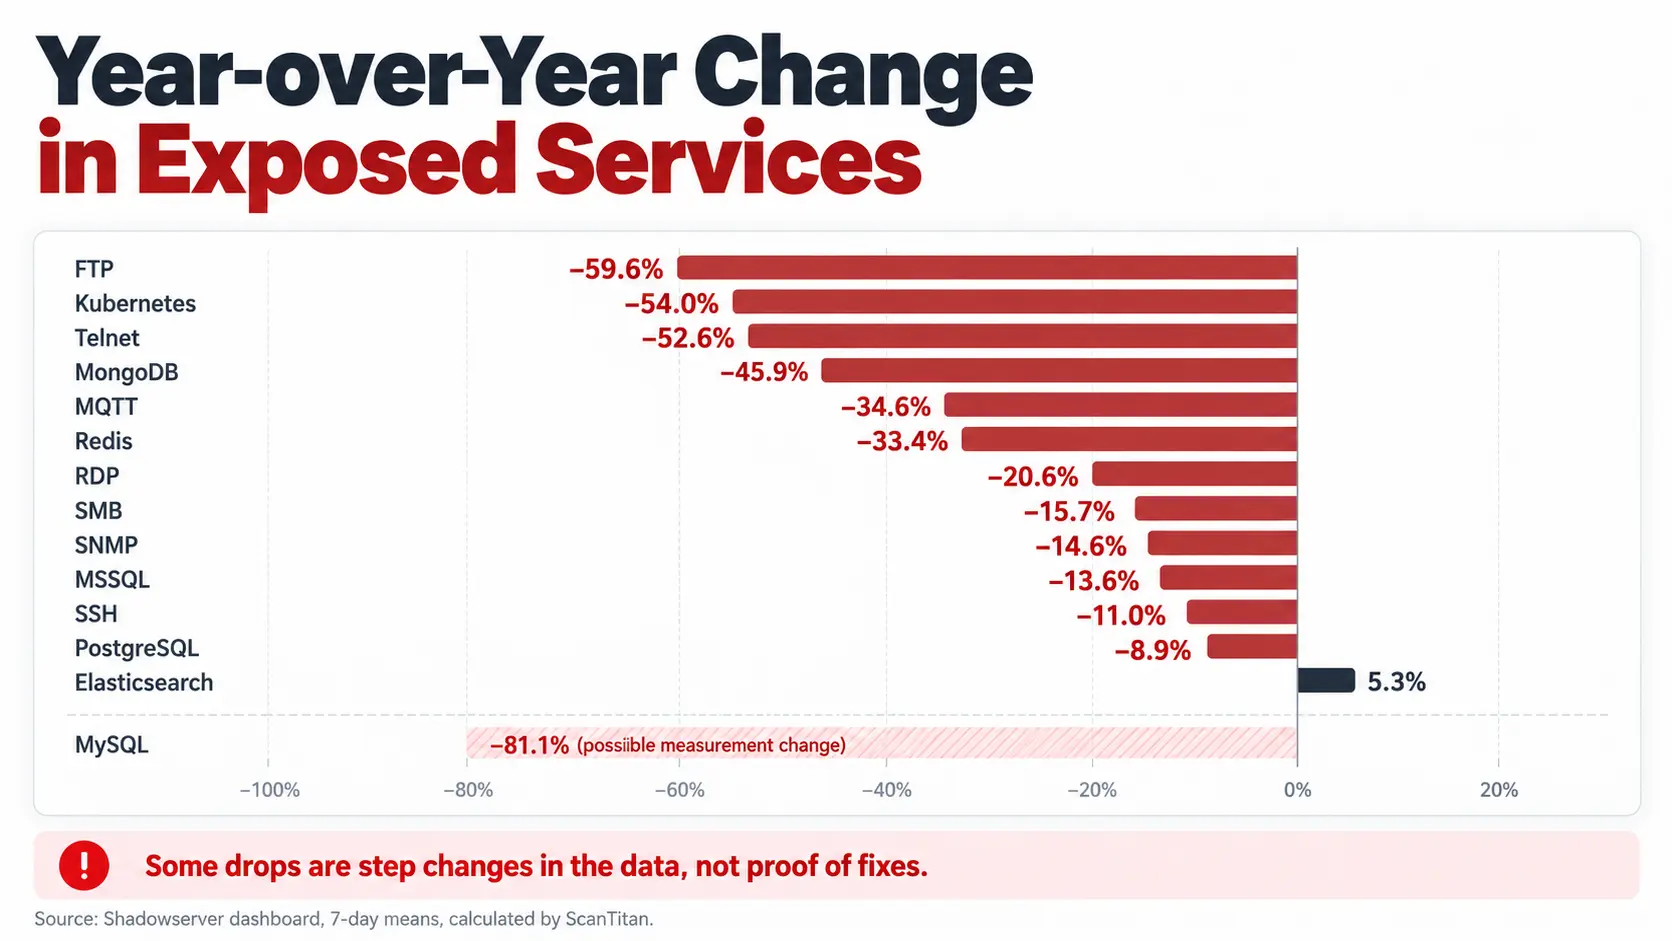
Shadowserver’s public dashboard reports unique IP addresses per day for dozens of services. The table gives the 7-day mean for 12 to 18 October 2026 and for the same window one year earlier (14 to 20 October 2025).
| Service | 12 to 18 Oct 2026 | Year earlier | Change |
|---|---|---|---|
| SSH | 16,123,849 | 18,117,400 | −11.0% |
| FTP | 4,266,664 | 10,570,587 | −59.6% |
| RDP | 1,724,327 | 2,172,970 | −20.6% |
| MySQL | 1,329,129 | 7,037,537 | −81.1% |
| SNMP | 767,749 | 899,333 | −14.6% |
| SMB | 675,172 | 801,130 | −15.7% |
| Telnet | 611,029 | 1,288,346 | −52.6% |
| PostgreSQL | 600,848 | 659,518 | −8.9% |
| MQTT | 144,626 | 221,139 | −34.6% |
| Kubernetes | 85,338 | 185,440 | −54.0% |
| MSSQL | 49,991 | 57,855 | −13.6% |
| MongoDB | 45,684 | 84,372 | −45.9% |
| Redis | 28,730 | 43,116 | −33.4% |
| Elasticsearch | 14,900 | 14,152 | +5.3% |
Source: Shadowserver dashboard, unique IP addresses per day, 7-day means calculated by ScanTitan. Latest single-day values on 18 October 2026: SSH 16,411,447, RDP 1,822,306, Telnet 611,712, SMB 686,545, FTP 4,517,074, MySQL 1,429,928, PostgreSQL 601,098.
Two things stand out. SSH is the most exposed management service by a wide margin: with 16.1 million addresses, it is about 9.4 times the RDP count. And almost every service is lower than a year ago, which is the opposite of the headline “attack surface keeps growing.” The only increase among the services tracked here is Elasticsearch, up 5.3% from a small base.
Remote Access Ports: RDP, SSH, Telnet, VNC and SMB
Remote access services get the most attention in open port statistics because a reachable login prompt invites password guessing and, for flawed versions, exploitation. In the 2026 DBIR, exploitation of vulnerabilities was the most common initial access vector at 31%, ahead of credential abuse at 13%, so a reachable port matters most when the software behind it is unpatched.
RDP: 1.7 million addresses, nearly half in Asia
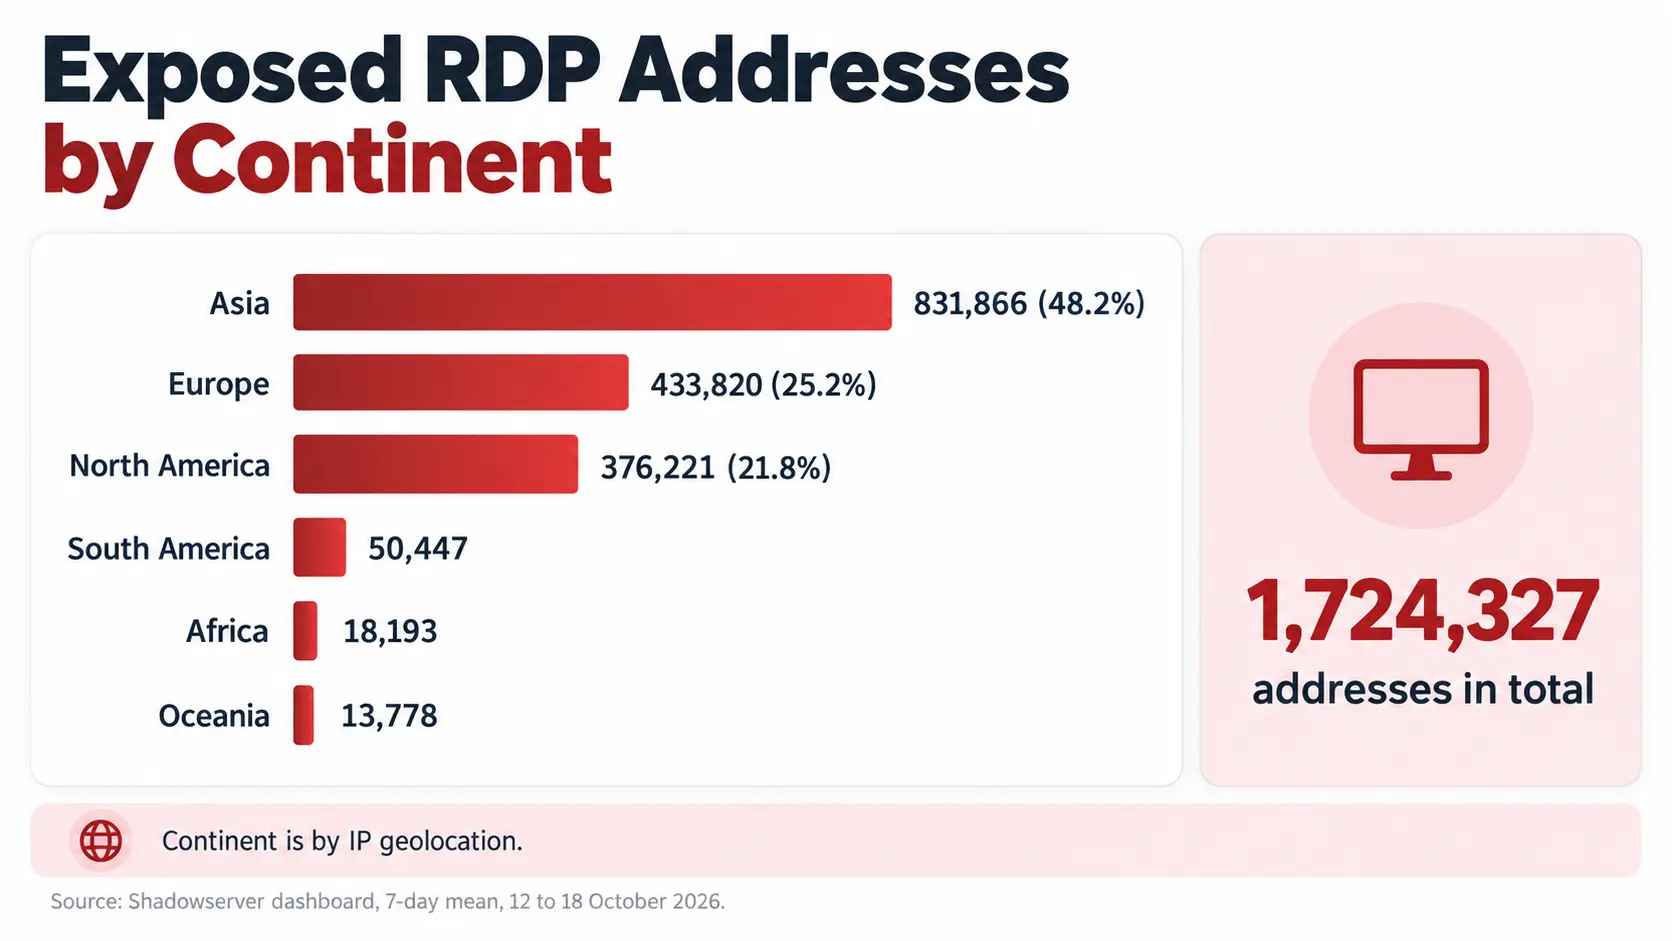
Windows Remote Desktop was reachable on 1,724,327 IP addresses in the 7-day mean for 12 to 18 October 2026, down 20.6% from 2,172,970 a year earlier. By continent, Asia held 831,866 (48.2%), Europe 433,820 (25.2%), North America 376,221 (21.8%), South America 50,447, Africa 18,193 and Oceania 13,778.
SSH: 16.1 million addresses, spread across three continents
SSH was reachable on 16,123,849 addresses, down 11.0% from 18,117,400. Europe held 5,869,328 (36.4%), Asia 5,007,883 (31.1%) and North America 4,567,997 (28.3%). South America had 375,291, Oceania 165,900 and Africa 136,979. SSH is built to be exposed, so a reachable SSH port is a much weaker signal than a reachable RDP or database port. The question is key-only login, patch level and brute-force controls.
Telnet: halved, and concentrated in Asia and South America
Telnet, an unencrypted protocol that has no business facing the internet, was reachable on 611,029 addresses, down 52.6% from 1,288,346. Asia accounted for 326,333 (53.4%) and South America for 136,838 (22.4%), a much larger share for South America than for any other service in this table. Europe had 63,873, North America 53,171, Africa 27,227 and Oceania 3,588.
SMB: 675,172 addresses, and why port 445 matters
SMB was reachable on 675,172 addresses, down 15.7% from 801,130. Asia held 277,278 (41.1%), Europe 210,780 (31.2%) and North America 137,269 (20.3%). SMB is the protocol behind worm-style spread, which is why port 445 exposure is treated as high risk wherever it is reachable from the internet.
| Service | Addresses (7-day mean) | Top continent | Top continent’s share |
|---|---|---|---|
| RDP | 1,724,327 | Asia | 48.2% |
| SSH | 16,123,849 | Europe | 36.4% |
| Telnet | 611,029 | Asia | 53.4% |
| SMB | 675,172 | Asia | 41.1% |
Source: Shadowserver dashboard, 12 to 18 October 2026. Continent is by IP geolocation, so it describes where the address is registered, not where the owner works.
Databases and Admin Services Reachable From the Internet
Databases and orchestration interfaces should rarely face the internet. Shadowserver’s 7-day means for 12 to 18 October 2026:
| Service | Addresses | Year earlier | Change |
|---|---|---|---|
| MySQL | 1,329,129 | 7,037,537 | −81.1% (see caution above) |
| PostgreSQL | 600,848 | 659,518 | −8.9% |
| MSSQL | 49,991 | 57,855 | −13.6% |
| MongoDB | 45,684 | 84,372 | −45.9% |
| Redis | 28,730 | 43,116 | −33.4% |
| Elasticsearch | 14,900 | 14,152 | +5.3% |
| Kubernetes | 85,338 | 185,440 | −54.0% (see caution above) |
Source: Shadowserver dashboard. The count is addresses where the service answered, not addresses where it lacked a password.
Verizon’s 2026 DBIR includes a category of errors it describes as misconfiguration, such as a data store placed on the internet without access controls. That is the failure these databases represent when they are reachable and open. A reachable MongoDB or Redis port is not the same as an open database, because the count does not say whether authentication is on.
Do Non-Standard Ports Hide Services?
Closing a port on its default number or moving a service to an unusual one is sometimes offered as protection. Censys’s 2026 State of the Internet found that many services already run elsewhere: 96% of SOCKS proxies, 68% of HTTP(S) services and 34% of SSH services were on non-standard ports. For anyone who builds their view of exposure from a list of default ports, that means a large share of exposure is missing from the list.
Moving a port does not stop discovery. In a honeypot experiment published in November 2025, Censys reported that HTTP and HTTPS services received a first probe within a median of minutes, SSH servers were often probed within an hour, and a relocated SMB port (50445) was probed in under 7 hours. Censys found that port about 20 minutes earlier. The post does not publish the number of hosts or how long the experiment ran, so treat these as an illustration, not a benchmark.
| Finding | Figure | Source |
|---|---|---|
| SOCKS proxies on non-standard ports | 96% | Censys |
| HTTP(S) services on non-standard ports | 68% | Censys |
| SSH services on non-standard ports | 34% | Censys |
| First probe of a relocated SMB port | Under 7 hours | Censys honeypot experiment |
Sources: Censys 2026 State of the Internet and Censys, who’s knocking on your door. Vendor-only.
Exposed Vulnerable Instances: Same Flaw, Different Counts
An exposure count becomes a risk count once a version check is added. But different scanners check at different times with different methods, so the same flaw produces different totals. MongoBleed (CVE-2025-14847) is a clean example.
| Source | Count | Date | What it says |
|---|---|---|---|
| Censys advisory | 87,000+ | 27 Dec 2025 | Potentially vulnerable instances; no known active exploitation at the time |
| Shadowserver | 78,725 | 29 Dec 2025 | Publicly exposed MongoDB servers |
| Shadowserver | 74,854 | 29 Dec 2025 | Of those, possibly unpatched (95.1%) |
| Shadowserver dashboard | 45,684 | 12 to 18 Oct 2026 (7-day mean) | MongoDB addresses reachable now, all versions |
Sources: Censys advisory, Shadowserver year in review and Shadowserver dashboard.
The 87,000 figure is Censys’s and the 74,854 figure is Shadowserver’s; they are not interchangeable and they were taken two days apart. The two published counts are also not the same measure as the October 2026 dashboard count, which covers all versions.
Other exposure counts from Censys
- AI and automation tools. Censys reported that AI-exposed hosts rose more than 63% from October 2025 to July 2026. More than 294,000 distinct IP addresses exposed at least one of 43 AI or LLM tools, up from about 183,000 in October 2025. Langflow exposure grew 169% and LiteLLM 97%.
- n8n. Censys counted 113,926 exposed n8n hosts, 76% of them in an affected version range.
- Industrial control systems. About 134,000 exposed ICS hosts in the early 2026 average, up about 4% from about 129,000 in 2024. About 70% sat on consumer and mobile networks. The United States held 32% (over 40,000 hosts); Turkey was second with fewer than 10,000. Europe’s share fell from 36.5% in 2024 to 32%.
Sources: Censys 2026 State of the Internet and Censys 2026 State of the Internet, ICS. Vendor-only.
Shadowserver’s year in review lists further dated exposure counts for specific products, including Cisco ASA and FTD devices (over 48,000 on 29 September 2025), WatchGuard Fireware (over 71,000 on 18 October 2025) and F5 BIG-IP (over 269,000 on 16 October 2025). Each is a snapshot on one date and measures exposure of a product, not exploitation of it.
Edge Devices and the CISA KEV Catalog
Edge devices (firewalls, VPN gateways, routers and similar boundary equipment) are the place where open ports and known exploited vulnerabilities meet. CISA’s KEV catalog lets us count how many exploited vulnerabilities sit in products from network-edge vendors.
CISA’s data feed (version 2026.10.16) lists 1,748 entries. 264 were added in 2026 so far, more than the 245 added in all of 2025, and 361 (20.7%) are marked as used in ransomware campaigns. ScanTitan counted entries by vendor name in the feed.
| Vendor | KEV entries (all years) |
|---|---|
| Microsoft | 390 |
| Cisco | 101 |
| Apple | 95 |
| Adobe | 82 |
| 75 | |
| Oracle | 46 |
| Apache | 41 |
| Ivanti | 36 |
| Fortinet | 32 |
| Linux | 31 |
| Citrix | 27 |
| D-Link | 26 |
| VMware | 26 |
| SonicWall | 19 |
| Synacor | 19 |
Source: CISA KEV feed, version 2026.10.16, counted by ScanTitan. Microsoft, Apple, Adobe and Google entries mostly cover desktop and browser software, not network edge equipment.
To estimate the edge share, ScanTitan grouped 21 vendors that mostly make boundary equipment: Cisco, Fortinet, Palo Alto Networks, Ivanti, Citrix, SonicWall, F5, Juniper, Check Point, Zyxel, D-Link (including one D-Link and TRENDnet entry), TP-Link, MikroTik, NETGEAR, Ubiquiti, WatchGuard, Barracuda, Sophos, Pulse Secure, Array Networks and DrayTek. These vendors hold 335 of 1,748 entries (19.2%).
| Slice | Edge-vendor entries | Share |
|---|---|---|
| All KEV entries | 335 of 1,748 | 19.2% |
| Added in 2025 | 54 of 245 | 22.0% |
| Added in 2026 so far | 61 of 264 | 23.1% |
| Ransomware-linked entries | 73 of 361 | 20.2% |
Source: CISA KEV feed, version 2026.10.16, counted by ScanTitan. This counts entries from selected vendors, not entries confirmed to be edge devices, because some vendors also sell software that does not sit on the boundary.
By vendor within this selection: Cisco 101, Ivanti 36, Fortinet 32, Citrix 27, D-Link 26, SonicWall 19, Palo Alto Networks 16, Zyxel 13, F5 8, Juniper 8, NETGEAR 8, Sophos 7, TP-Link 6 and MikroTik 5.
The edge share of new additions is higher than its share of the whole catalog (22.0% in 2025 and 23.1% in 2026 against 19.2%). That points toward more of the newly exploited flaws sitting in boundary equipment, though the selection method, not just the trend, drives the exact percentages.
VulnCheck: end-of-life devices and the KEV gap
VulnCheck’s 2026 State of Exploitation report on the network edge (vendor-only) found that 42.5% of vulnerabilities exploited in 2025 affected devices that are end of life or likely end of life. Consumer routers and globally distributed networking products accounted for 56% of exploited edge vulnerabilities. Only 23.7% of the identified vulnerabilities appear in CISA’s KEV catalog, and 65% of botnet-exploited vulnerabilities affected end-of-life or likely end-of-life products. Source: VulnCheck.
The last two figures matter together: a count from the KEV catalog, including the one above, understates edge exploitation because most of what VulnCheck found never reached the catalog.
What the 2026 DBIR says about VPNs and edge devices
- Initial-access brokers. Of 876 initial-access-broker offers over four years, 44% were for VPN access, followed closely by remote desktop access (RDP, RDPweb and VNC).
- Small business ransomware. Among small and medium business ransomware victims, 38% were victimized through compromised credentials and 29% through unpatched vulnerabilities in edge devices. About 96% of ransomware victims are small and medium businesses.
- System Intrusion pattern. VPN as a vector stays around 16%, and the two leading initial access vectors, use of stolen credentials and exploitation of vulnerabilities, are both 39%.
- End-of-life routers. The DBIR notes end-of-life internet-facing cellular routers in utilities and mining, with default passwords on exposed management interfaces or unpatched vulnerabilities.
Source: Verizon 2026 DBIR, pages 34, 40, 45 and 98. The 2026 DBIR does not publish an edge-device-specific remediation time, so no 2026 figure is given here.
CISA’s two directives
- BOD 26-02 (5 February 2026) covers end-of-support edge devices at federal agencies, defined as devices on the boundary of an agency network and accessible from the public internet. It requires immediate updates, an inventory within 3 months, decommissioning of listed end-of-support devices within 12 months, all identified ones within 18 months, and continuous discovery with decommissioning by the support end date within 24 months. Source: CISA BOD 26-02.
- BOD 26-04 (10 June 2026) replaces BOD 19-02 and BOD 22-01 with risk-based prioritization using four criteria: asset exposure, KEV status, exploit automation and technical impact. A 3-day deadline appears as an example case, and the directive applies to federal civilian executive branch agencies only. It is not a general 3-day rule for edge devices. Source: CISA BOD 26-04.
Time to Exploit vs Time to Probe vs Time to Patch
Three clocks run at once, and each uses a different unit.
| Clock | Figure | Source |
|---|---|---|
| Time to first probe of an exposed service | Minutes for HTTP(S); often under an hour for SSH; under 7 hours for a relocated SMB port | Censys honeypot experiment (vendor-only) |
| Mean time to exploit | −7 days (estimate, 2025 investigations) | Mandiant M-Trends 2026 |
| Median time to fully remediate KEV vulnerabilities | 43 days (32 days in the prior dataset) | Verizon 2026 DBIR |
Sources: Censys, Google Cloud, M-Trends 2026 and the Verizon 2026 DBIR Executive Summary.
Mandiant’s negative figure means exploitation often began before a patch was available. In the DBIR, only 26% of KEV vulnerabilities were fully remediated, down from 38% in the prior dataset, with a median of 43 days. Exposure is found in hours, exploitation can come before a fix, and remediation takes weeks. The three numbers measure different events and cannot be subtracted.
Open Ports Statistics by Region
Regional splits are available for the Shadowserver service counts and the Censys ICS count. They answer where addresses are registered, not where risk is highest.
| Measure | Largest | Next | Source |
|---|---|---|---|
| RDP addresses | Asia 48.2% | Europe 25.2%, North America 21.8% | Shadowserver, 12 to 18 Oct 2026 |
| SSH addresses | Europe 36.4% | Asia 31.1%, North America 28.3% | Shadowserver, 12 to 18 Oct 2026 |
| Telnet addresses | Asia 53.4% | South America 22.4%, Europe 10.5% | Shadowserver, 12 to 18 Oct 2026 |
| SMB addresses | Asia 41.1% | Europe 31.2%, North America 20.3% | Shadowserver, 12 to 18 Oct 2026 |
| Exposed ICS hosts | United States 32% (over 40,000) | Turkey, fewer than 10,000 | Censys, early 2026 |
Sources: Shadowserver dashboard and Censys. Percentages for Shadowserver are calculated by ScanTitan from the continent counts in the 7-day mean.
Asia leads three of the four remote access services, and Europe’s share of exposed ICS hosts shrank from 36.5% to 32% between 2024 and early 2026. Larger populations of addresses explain part of this, so a high regional count is not evidence of weaker practice.
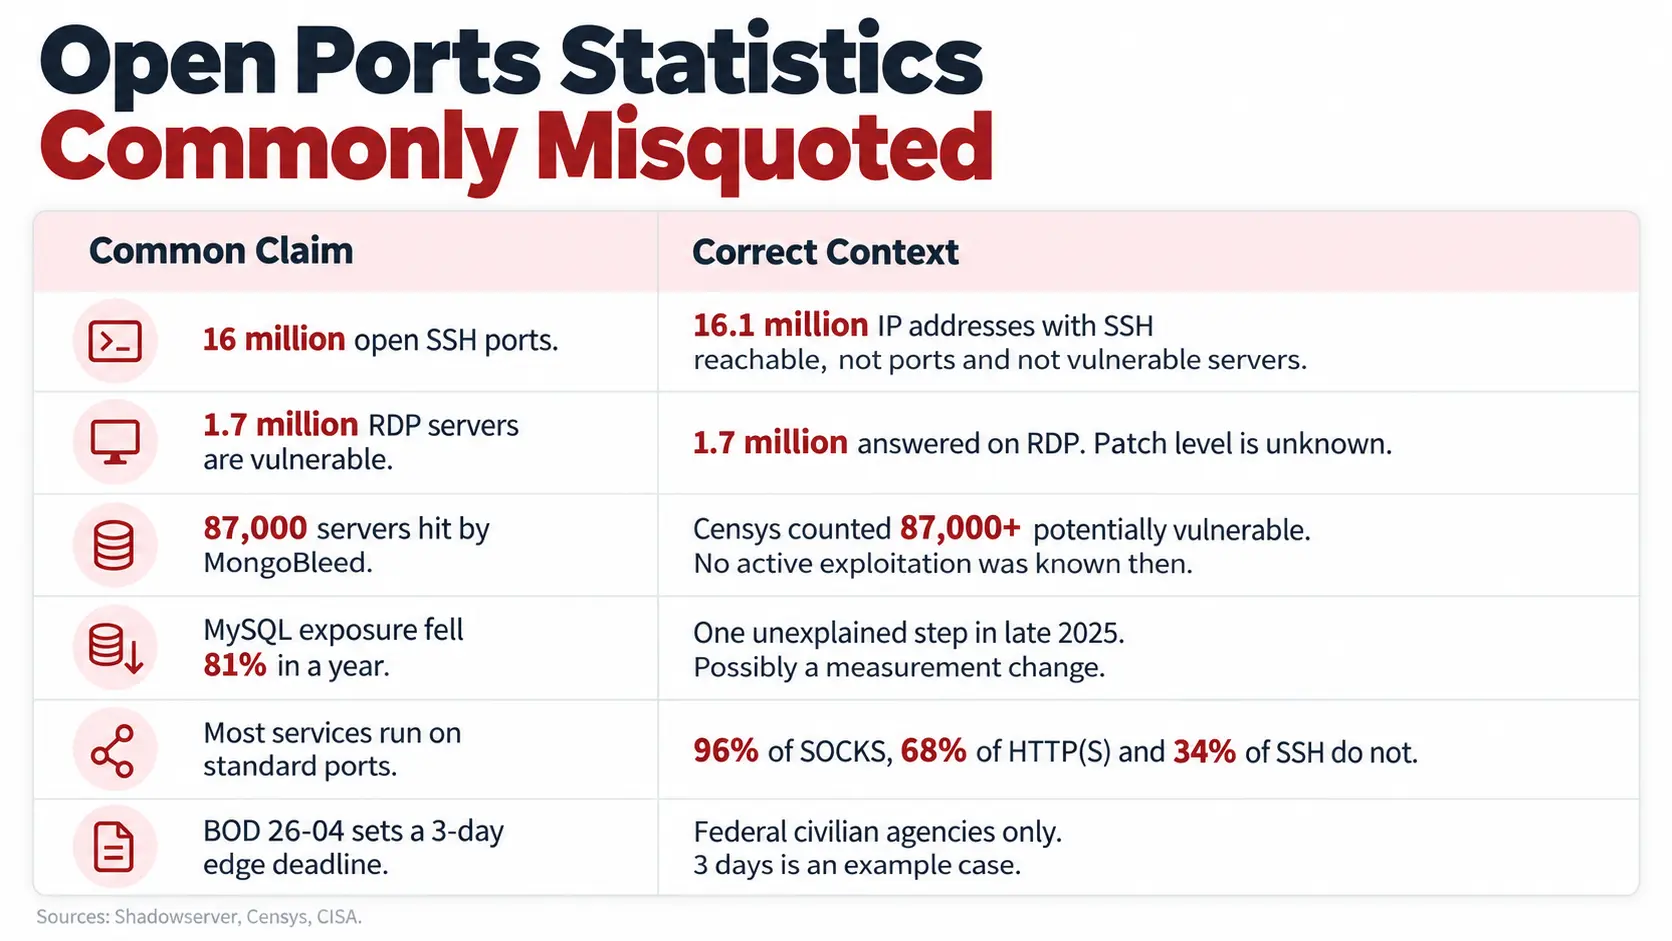
Open Ports Statistics Commonly Misquoted
| Common claim | Correct context |
|---|---|
| “16 million open SSH ports.” | 16.1 million is the 7-day mean of IP addresses with SSH reachable on one day’s scan, not a count of ports and not a count of vulnerable servers. |
| “1.7 million RDP servers are vulnerable.” | 1.7 million addresses answered on RDP. The count says nothing about patch level. |
| “87,000 MongoDB servers were hit by MongoBleed.” | 87,000 is Censys’s count of potentially vulnerable instances on 27 December 2025, and no active exploitation was known at the time. Shadowserver counted 74,854 possibly unpatched of 78,725 exposed on 29 December. |
| “MySQL exposure fell 81% in a year.” | The fall happened in one step in late 2025 that the dashboard does not explain, so it may be a measurement change. |
| “Most services run on standard ports.” | Censys found 96% of SOCKS proxies, 68% of HTTP(S) services and 34% of SSH services on non-standard ports. |
| “A fifth of exploited vulnerabilities are in edge devices.” | 19.2% of KEV entries come from 21 selected edge vendors, a ScanTitan vendor grouping, not a count of devices. |
| “BOD 26-04 sets a 3-day deadline for edge devices.” | BOD 26-04 sets risk-based prioritization for federal civilian agencies. The 3-day figure is an example case. |
| “134,000 exposed ICS hosts are critical infrastructure.” | Censys found about 70% on consumer and mobile networks, so many are small or home installations. |
What the Numbers Mean for a Lean Team
A small security team cannot chase 16 million addresses, but the numbers point to a short list.
- Know what your own perimeter exposes. The only count that matters to you is yours. Start from a list of every internet-facing address and every port that answers, with the service identified by what responds, not by the port number. ScanTitan’s guides to internet-exposed services and open ports risk assessment cover how to build that list.
- Treat RDP, SMB, Telnet and databases as findings, not features. None needs to face the internet. VPN-fronted access or an allow list is the usual fix. A port exposure fix generator helps turn a finding into a firewall change.
- Put edge devices first on the patch list. Boundary devices carry a fifth of the KEV catalog by this count, brokers sell VPN access, and many exploited edge flaws sit in products that no longer get updates. Replace end-of-life devices instead of waiting for a patch that will not come.
- Prioritize by exploitation, not by volume. Use KEV status and exposure together, as CISA’s BOD 26-04 does. A CVE priority checker shows whether a flaw is in KEV.
- Re-scan on a schedule. Exposure changes with every deployment. Continuous network exposure monitoring and an attack surface management process catch new services before a scanner on the internet does. Raw scan output is easier to act on once it is explained, for example with an Nmap output explainer.
For the vulnerabilities that sit behind web-facing services, see ScanTitan’s web application attack statistics, and for the dependency side, the software supply chain attack statistics.
How We Compiled and Verified These Statistics
- Used: Shadowserver’s public dashboard and year in review, Censys reports and advisories, the CISA KEV data feed and directives, Verizon’s 2026 DBIR (full report and executive summary), Mandiant M-Trends 2026 and VulnCheck’s 2026 network edge report. Censys and VulnCheck figures are labeled vendor-only.
- Method: Shadowserver counts are 7-day means of daily unique IP addresses, calculated by ScanTitan from the dashboard’s data for 12 to 18 October 2026 and 14 to 20 October 2025. KEV counts come from feed version 2026.10.16, counted by vendor name and date added.
- Excluded: secondary summaries, figures that could not be traced to a primary source, and unsupported exposure totals quoted from search-engine snapshots. Shadowserver’s scale claims for IPv4 and IPv6 address counts and VulnCheck figures that do not appear on its public pages were also left out.
- Refresh: Reviewed every 90 days. Dashboard counts change daily and lag the current date by about two days; KEV counts change monthly; Verizon, Censys and VulnCheck update on their annual cycles.
How to cite this research. ScanTitan, “Open Ports Statistics 2026: Exposed Services, Vulnerable Hosts & Exploited Flaws,” 20 October 2026. For single figures, cite the primary source beside each number; cite the 7-day means and KEV vendor counts to this page with the date range or catalog version.
Primary Sources
- Shadowserver dashboard, combined statistics and Shadowserver 2025 year in review
- Shadowserver network reporting
- Censys 2026 State of the Internet and ICS edition
- Censys, who’s knocking on your door and Censys advisory CVE-2025-14847
- CISA Known Exploited Vulnerabilities catalog data feed
- CISA BOD 26-02, end-of-support edge devices and BOD 26-04, risk-based prioritization
- Verizon 2026 Data Breach Investigations Report and Executive Summary
- Google Cloud, M-Trends 2026
- VulnCheck, 2026 network edge device report
Frequently Asked Questions
What are the most commonly open ports?
By addresses reachable in Shadowserver’s scans, SSH leads with a 7-day mean of 16,123,849 IP addresses for 12 to 18 October 2026, followed by FTP (4,266,664), RDP (1,724,327) and MySQL (1,329,129). This counts reachable addresses, not vulnerable ones.
How many RDP servers are exposed to the internet?
Shadowserver counted a 7-day mean of 1,724,327 IP addresses with RDP reachable for 12 to 18 October 2026, down 20.6% from 2,172,970 a year earlier. Asia held 48.2% of them.
Which ports should not be open to the internet?
Telnet, SMB (port 445), RDP, and database and cache services such as MySQL, PostgreSQL, MongoDB, Redis and Elasticsearch rarely need to face the internet. Reachable SSH is common, but it should be restricted to key-based login and known source addresses where possible.
Why are open ports risky?
An open port exposes a service to everyone. Attackers can probe it for weak credentials or known flaws. Censys found that a relocated SMB port was probed in under 7 hours. The risk depends on the service and its version, not on the port number alone.
Can I check which ports are open on my own network?
Yes, with a port scan of your own address space. Scan only systems you own or are authorized to test. Identify services by what answers, because Censys found 34% of SSH and 68% of HTTP(S) services on non-standard ports.
Do non-standard ports protect a service?
No. Censys found 34% of SSH services already run on non-standard ports, and a relocated SMB port in its honeypot test was probed in under 7 hours. Moving a port delays discovery by hours at most.
How many open database servers are there?
Shadowserver’s 7-day mean for 12 to 18 October 2026 was 1,329,129 addresses for MySQL, 600,848 for PostgreSQL, 49,991 for MSSQL, 45,684 for MongoDB, 28,730 for Redis and 14,900 for Elasticsearch. The counts say a service answered, not that it lacks a password.
How many MongoDB servers were vulnerable to MongoBleed?
It depends on the scanner. Censys reported over 87,000 potentially vulnerable instances on 27 December 2025. Shadowserver counted 74,854 possibly unpatched of 78,725 publicly exposed servers on 29 December 2025.
What share of exploited vulnerabilities are in edge devices?
ScanTitan counted 335 of 1,748 CISA KEV entries (19.2%) from 21 selected network-edge vendors in feed version 2026.10.16. That is a vendor grouping, not a count of devices, and the share of 2026 additions is higher at 23.1%.
Are VPNs a major way in?
In the 2026 DBIR, 44% of 876 initial-access-broker offers over four years were for VPN access. VPN as a vector in the System Intrusion pattern stays around 16%.
Does CISA require a 3-day patch deadline for edge devices?
No. BOD 26-04 sets risk-based prioritization for federal civilian executive branch agencies, with a 3-day deadline as an example case. BOD 26-02 separately covers end-of-support edge devices, with deadlines from immediate up to 24 months.
How many industrial control systems are exposed?
Censys counted about 134,000 exposed ICS hosts in its early 2026 average, up about 4% from about 129,000 in 2024. About 70% were on consumer and mobile networks, and the United States held 32%.