Software supply chain attack statistics are easy to misread because the largest datasets count different things: malicious packages, confirmed attacks, survey incidents, breaches and costs. Sonatype had logged 1,960,846 malicious open-source packages by the end of Q3 2026, including 149,329 in Q3 alone, but a package detection is not a breach. StepSecurity confirmed 56 distinct attacks in 12 months. Verizon’s 2026 DBIR found third-party involvement in 48% of breaches, up 60% on the prior dataset, and IBM put the average supply chain breach at $4.96 million with a 258-day lifecycle. This report keeps each unit separate, shows the denominator behind every figure, and explains where the sources disagree instead of blending them into one invented “attack rate.” Data last checked: 15 October 2026.
Key Software Supply Chain Attack Statistics for 2026
Executive Benchmark: Software Supply Chain Attack Statistics for 2026
| Metric | Latest figure | Period | Trend / context | Source |
|---|---|---|---|---|
| Cumulative malicious open-source packages | 1,960,846 | Through Q3 2026 | Package telemetry since 2017, not breaches | Sonatype Q3 2026 index |
| Malicious packages logged in the quarter | 149,329 | Q3 2026 | npm was 133,579 of them (89.5%), down from 96.6% in Q2 | Sonatype Q3 2026 index |
| New malicious packages in a full year | 454,600+ | 2025 | Cumulative total then stood at over 1.233 million | Sonatype 2026 State of the Software Supply Chain |
| Packages with overt malicious behavior | 27,618 | Q3 2026 | Sonatype states 74.5% of this subset involved droppers, secrets exfiltration or both | Sonatype Q3 2026 index |
| Confirmed open-source supply chain attacks | 56 | Aug 2025 to Aug 2026 | 6 in the first six months, 50 from February 2026; one source’s corpus, not a world census | StepSecurity |
| Organizations reporting a software supply chain incident | 77% | 12 months to Feb 2026 | Survey of 400 IT, security and application professionals in North America | Docker / Omdia |
| Breaches with third-party involvement | 48% | 2025 data, 2026 DBIR | Up 60% on the prior dataset; broader than software-only attacks | Verizon DBIR 2026 |
| Average cost, supply chain compromise vector | $4.96M | Breaches Mar 2025 to Feb 2026 | Second most common initial vector after phishing; prior year $4.91M | IBM Cost of a Data Breach 2026 |
| Breach lifecycle, supply chain compromise | 258 days | Breaches Mar 2025 to Feb 2026 | 194 days to identify plus 64 days to contain; tied for longest of the vectors listed | IBM Cost of a Data Breach 2026 |
| Cost added by a supply chain breach | +$227,250 | Breaches Mar 2025 to Feb 2026 | Largest cost-increasing factor of those IBM analyzed | IBM Cost of a Data Breach 2026 |
| Mean open-source vulnerabilities per codebase | 581 | Scans Nov 2024 to Oct 2025 | Up 107% from 280; unique vulnerabilities average 237; median is 78 | Black Duck OSSRA 2026 |
| Log4j downloads that were vulnerable versions | 13% | 2025 | Years after fixed versions were released | Sonatype 2026 |
| CISA KEV vulnerabilities fully remediated | 26% | 2025 | Down from 38%; median time to full resolution rose from 32 to 43 days | Verizon DBIR 2026 summary |
| Registry downloads across four ecosystems | 9.8 trillion | 2025 | Maven Central, PyPI, npm and NuGet request volume, not unique projects | Sonatype 2026 |
| EU Cyber Resilience Act reporting | In force | From 11 Sep 2026 | 24-hour early warning, 72-hour notification | European Commission |
Methodology and Source Confidence
This research prioritizes primary reports, official incident disclosures, standards bodies and regulators. Each statistic stays attached to its original unit, period and denominator.
- Malicious package: a package identified as containing or delivering malicious behavior.
- Package version: one published release of a package; one package can have many versions.
- Download or request: a registry retrieval event; automated builds create many of them.
- Attack: a distinct malicious campaign or compromise, counted by each source’s own rules.
- Incident: a security event reported by an organization or survey respondent; it does not always mean data was exposed.
- Breach: confirmed unauthorized access to or disclosure of data.
- Affected organization: a downstream entity impacted by an upstream compromise.
| Source | What it measures | Type | What not to conclude |
|---|---|---|---|
| Sonatype | Malicious packages in registries; registry downloads | Vendor telemetry | Package counts are not victim counts |
| StepSecurity | Confirmed attacks on already-trusted components, each with a published alert | Vendor corpus; excludes CVE analyses and new typosquats | 56 is not a worldwide total |
| ReversingLabs | Malicious open-source detections | Vendor telemetry | Its counts cannot be added to Sonatype’s |
| Docker / Omdia | Self-reported incidents, n=400, North America | Sponsored survey | Not a population-wide breach rate |
| Verizon DBIR | Breaches with third-party involvement; 31,000+ incidents, 22,000+ breaches, 145 countries | Incident dataset | Third-party involvement is wider than software supply chain attacks |
| IBM / Ponemon | Cost and lifecycle of breaches at 602 organizations | Breach-cost sample | Supply chain compromise is IBM’s vector category, not software-only |
| Black Duck OSSRA | Open-source composition of 947 audited codebases | Audit dataset | Vulnerability counts count instances, not attacks |
| CISA, NIST, EU, OWASP | Advisories, standards and regulation | Government / standards | OWASP’s 50% is a survey ranking, not a breach share |
How Common Are Software Supply Chain Attacks?
No defensible single percentage answers “how many software supply chain attacks occur.” The strongest current sources observe different layers of the ecosystem, so each answers a different question.
| Measurement class | 2026 figure | Question it answers | What it does not prove |
|---|---|---|---|
| Malicious-package telemetry | 149,329 in Q3 | How much malicious package activity was detected? | How many organizations were breached |
| Confirmed attack corpus | 56 in 12 months | How many attacks did one provider confirm? | The total worldwide attack count |
| Enterprise survey | 77% reported an incident | How common were incidents among respondents? | Population-wide breach prevalence |
| Breach dataset | 48% third-party involvement | How often were outside parties involved in breaches? | That software was the cause |
| Breach-cost sample | $4.96M | What did breaches that began with supply chain compromise cost? | The cost of a malicious package |
StepSecurity tracked 56 confirmed attacks in 12 months
StepSecurity counted 56 distinct supply chain attacks between August 2025 and August 2026, each backed by a Threat Center alert. Six fell in the first six months (August 2025 to January 2026) and 50 from February 2026 onward, which the report calls more than an 8x increase. Monthly counts it lists include 13 in March, 9 in April, 9 in May, 10 in June and 6 in July. Since March 2026 the report puts the pace at roughly one attack every three days.
The corpus covers npm, PyPI, RubyGems, Composer and crates.io, plus poisoned GitHub Action tags and IDE extensions. It excludes vulnerability disclosures, unconfirmed events and brand-new typosquats, so it counts only attacks on components developers already trusted.
77% of surveyed organizations reported a supply chain incident
Omdia surveyed 400 IT, cybersecurity and application professionals across North America in February 2026 for Docker. 77% said their organization had a software supply chain incident in the prior 12 months, and the most common type (38%) involved exploitation of known vulnerabilities in third-party software. This is self-reported survey evidence, not a confirmed-breach corpus.
Third-party involvement reached 48% of breaches in the 2026 DBIR
Verizon’s 2026 DBIR, built on 31,000+ incidents and 22,000+ confirmed breaches in 145 countries, found third-party involvement in 48% of breaches, up 60% on last year’s dataset. Verizon links the rise to growing reliance on third parties for services and software. It measures any third-party involvement, so it should not be quoted as the share of breaches caused by software supply chain attacks. For the full vendor-risk picture, see ScanTitan’s third-party data breach statistics.
Supply Chain Attacks vs. Malicious Packages vs. Vulnerable Dependencies
These four terms are routinely mixed together even though they describe different risks.
| Term | Meaning | Example |
|---|---|---|
| Malicious package | A package intentionally contains or delivers harmful behavior. | A credential stealer or dropper published to npm or PyPI. |
| Compromised legitimate package | A trusted package or maintainer account is abused to ship a malicious release. | Stolen publishing credentials used to push a poisoned version. |
| Vulnerable dependency | A legitimate package has an exploitable flaw its publisher did not weaponize. | A widely embedded library with a remote code execution flaw. |
| Supply chain attack | An attacker abuses dependency, build, signing, publishing or update trust to reach downstream targets. | A malicious update, compromised CI/CD action or poisoned dependency. |
The distinction matters for incidents such as Log4Shell. A vulnerable third-party dependency can create massive shared exposure without any malicious package campaign, while a self-propagating npm worm is a true supply chain attack even if it never produces a reportable data breach at every installation it touches.
Open-Source Malware Statistics in 2026
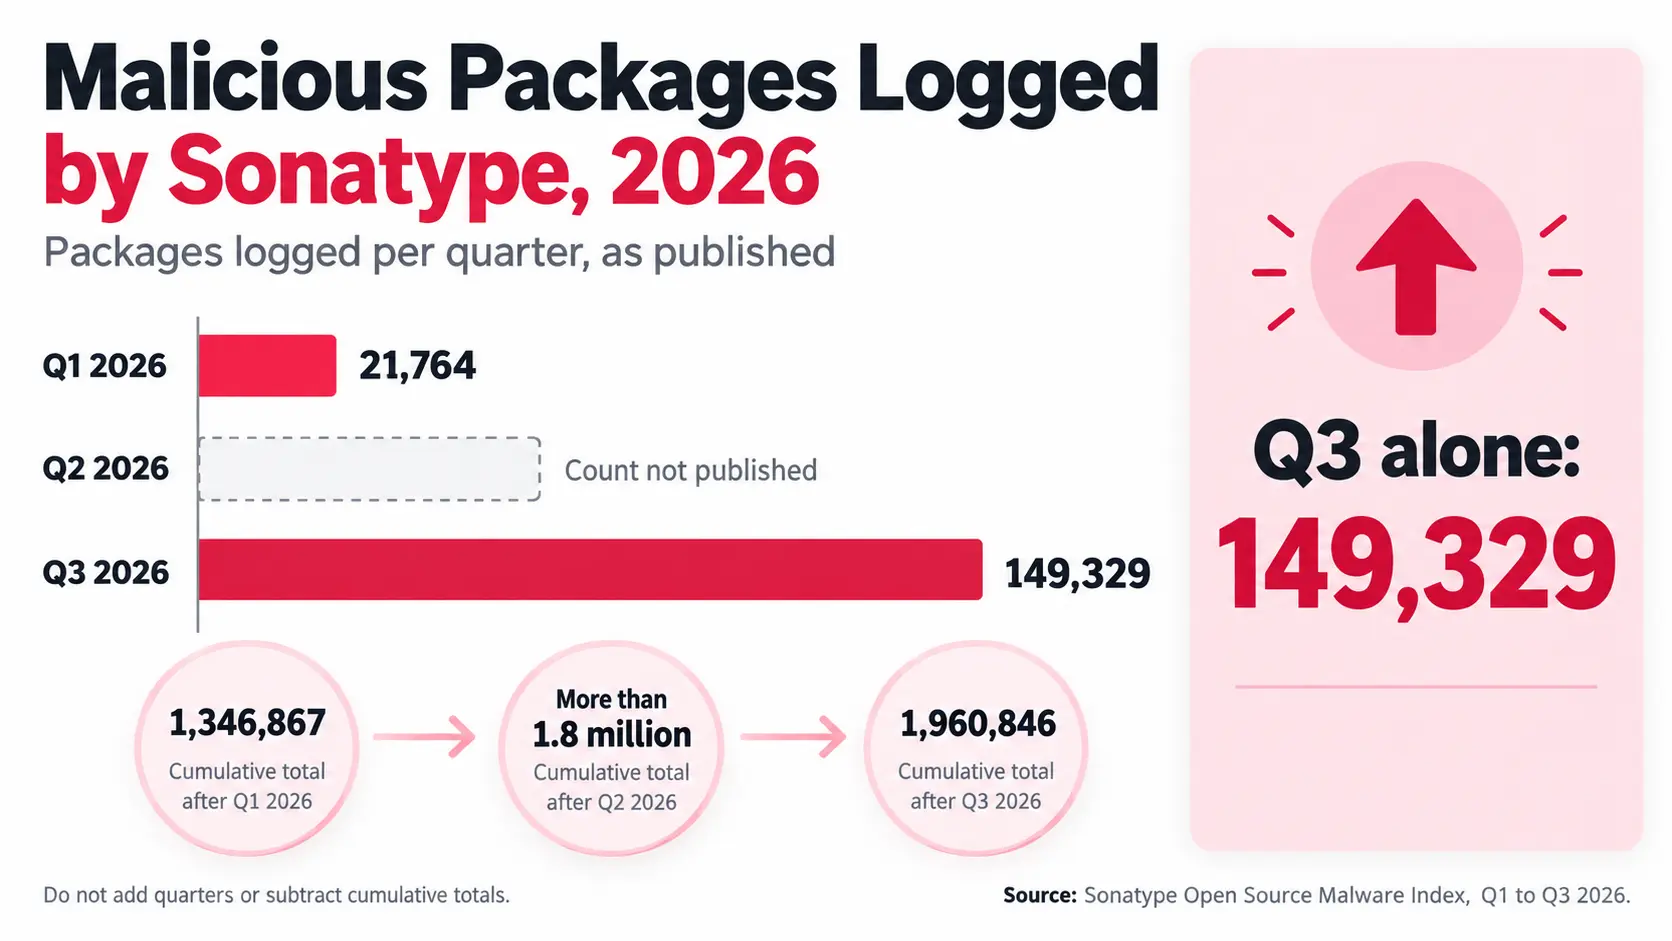
Sonatype’s quarterly indexes give the clearest current view of malicious-package activity. The pattern changed fast during 2026, which makes annualizing a single quarter risky.
| Period | Packages logged in the period | Cumulative total stated | npm share |
|---|---|---|---|
| Full year 2025 | 454,600+ | Over 1.233 million | Over 99% of open-source malware |
| Q1 2026 | 21,764 | 1,346,867 | 75% |
| Q2 2026 | Not published | More than 1.8 million | 96.6% |
| Q3 2026 | 149,329 | 1,960,846 | 89.5% (133,579 packages) |
Q1 2026: 21,764 malicious packages, 75% on npm
Sonatype identified 21,764 malicious packages in Q1 2026, bringing its cumulative total to 1,346,867, and put npm at 75% of the quarter. It described this as one new malicious package every six minutes.
Q2 2026: npm reached 96.6% of malicious-package volume
By the end of Q2 Sonatype’s catalog passed 1.8 million packages and npm represented 96.6% of the quarter. Among non-npm activity, nearly 87% sat in two ecosystems: PyPI (48.5%) and NuGet (38.0%).
Q3 2026: 149,329 packages in one quarter
Sonatype logged 149,329 malicious packages in Q3, taking the cumulative total to 1,960,846. npm held 89.5% (133,579 packages). Of 27,618 packages with at least one overtly malicious behavior, Sonatype states 74.5% involved droppers, secrets exfiltration or both. Its threat-type table lists 14,665 droppers and 9,863 secrets-exfiltration packages and a separate 68.1% figure without a stated denominator, so do not compare the two percentages.
What malicious packages actually do: repository abuse leads 2025
Across all malicious packages Sonatype logged in 2025, 55.9% showed repository abuse such as spam or squatting. The behavior shares it lists are shown below as published.
| 2025 behavior category | Share of logged malicious packages | Note |
|---|---|---|
| Repository abuse | 55.9% | Spam, squatting and similar |
| Potentially unwanted application | 27.5% | Lower-severity category |
| Host information exfiltration | 5.7% | Environment and system data |
| Secrets exfiltration | 3.9% | Tokens, keys and credentials |
| Droppers and loaders | 2.7% | Deliver additional payloads |
| Backdoors | 2.1% | Persistent access |
Source: Sonatype 2026 State of the Software Supply Chain. Categories are reported by Sonatype and may overlap, so do not sum them.
How Large Is the Open-Source Ecosystem?
Software reuse amplifies the attack surface. Sonatype recorded 9.8 trillion downloads or requests in 2025 across Maven Central, PyPI, npm and NuGet. That is registry traffic, not 9.8 trillion unique packages or developers, because automated pipelines repeatedly resolve the same dependencies.
| Ecosystem | 2025 downloads | New components added in 2025 |
|---|---|---|
| npm | 7.97T | 749.7k |
| Maven Central | 839.05B | 260.5k |
| PyPI | 804.97B | 214.8k |
| NuGet | 223.37B | 144.8k |
Sonatype vs. ReversingLabs: Why Package Counts and npm Shares Differ
Sonatype identified 454,600+ malicious packages in 2025. ReversingLabs separately reported a 73% increase in detections of malicious open-source packages in 2025, with npm up more than 100% to 10,819 packages, nearly 90% of its detections across platforms. It also reported malware detected on PyPI and NuGet fell 43% and 60%.
The same gap appears in the npm share. Sonatype’s annual report says over 99% of the open-source malware it logged in 2025 was on npm, while its quarterly shares for 2026 were 75%, 96.6% and 89.5%, and ReversingLabs says nearly 90%. These are different windows and different detection systems.
Which Package Ecosystems Are Most Targeted?
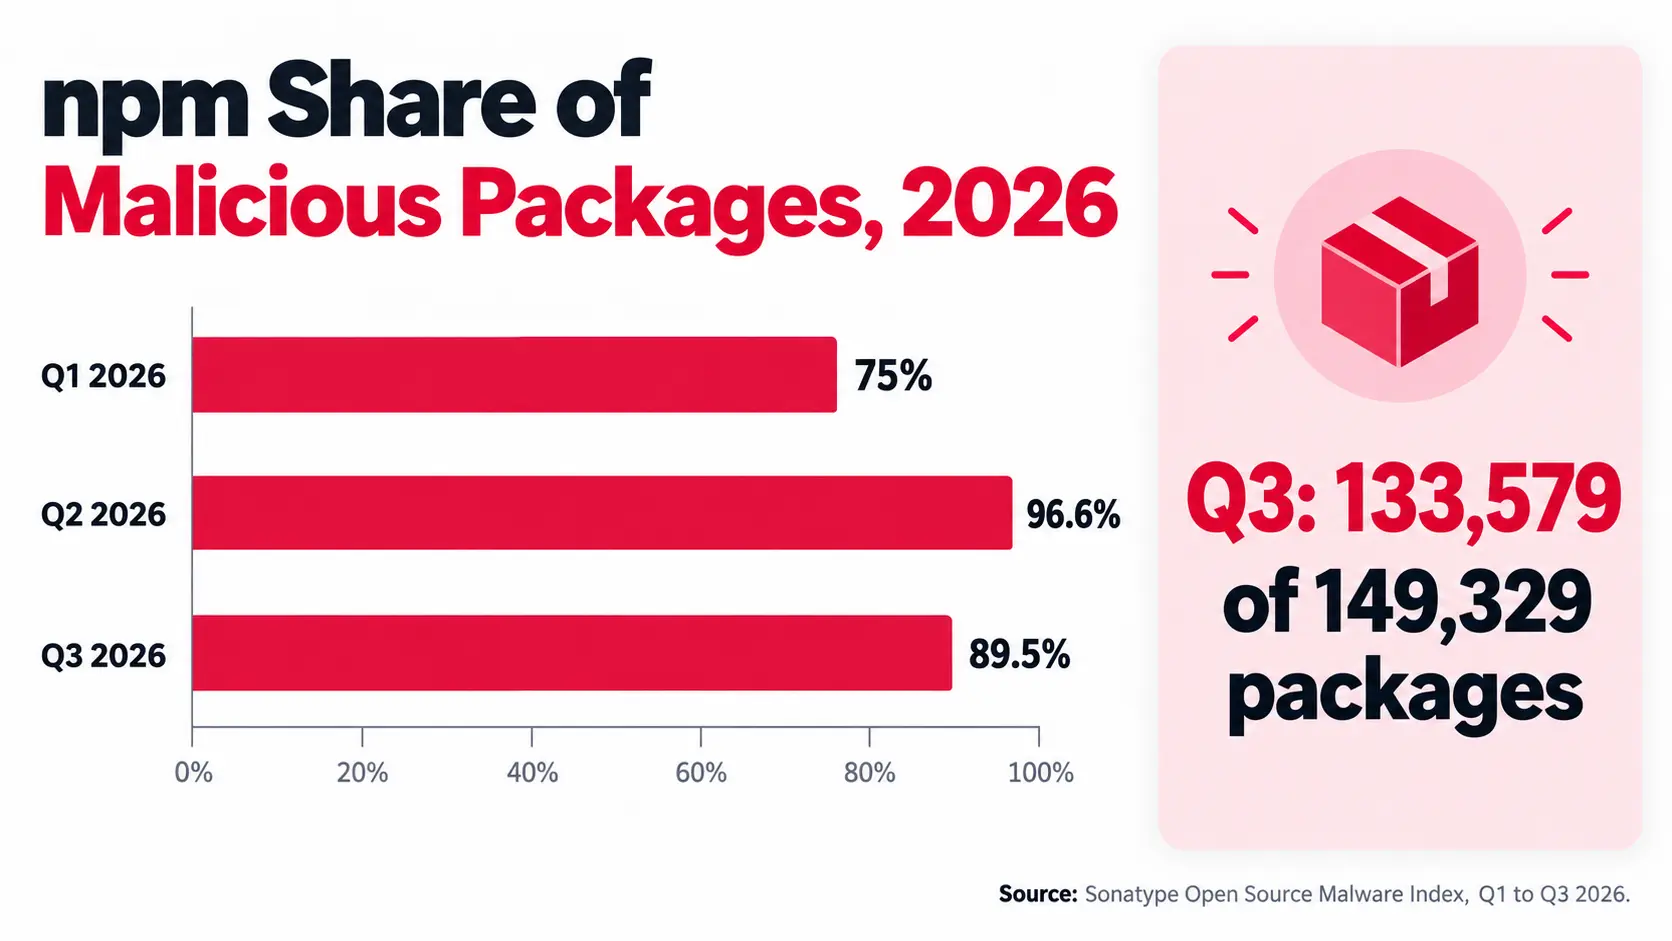
npm is the strongest concentration point in every dataset reviewed. StepSecurity also calls npm the biggest target, and Sonatype’s 2026 shares range from 75% to 96.6% by quarter.
Why npm attracts so much supply chain abuse
Several features make npm attractive: huge package and download volume, automated dependency installation, install-time scripts, deep transitive dependency trees, and developer credentials and registry tokens that live in build environments. The point is concentration of trust, not that npm is uniquely unsafe: a stolen maintainer account or compromised release inherits the original package’s reputation and reach. For the technical mechanics, see ScanTitan’s JavaScript npm supply chain attack guide.
How Software Supply Chain Attacks Happen
Software supply chain compromise is better understood as a taxonomy of attack paths than as one vulnerability class.
1. Maintainer and publisher account takeover
Attackers steal registry, GitHub or developer credentials and use legitimate publishing rights to release malicious versions that keep the package’s name and history.
2. Compromised legitimate packages
A package can keep working while malicious code runs at install or build time, so historical reputation does not prove the exact version being installed is safe.
3. Dependency confusion
Attackers publish public packages that mimic internal dependency names, often with very high version numbers. Sonatype documented a May 2026 campaign of 176 malicious npm packages, many at version 99.99.99, built to win automated resolution races. Their install scripts collected environment variables and CI/CD secrets before fetching a second-stage binary.
4. Typosquatting and brandjacking
Lookalike package names remain a familiar technique, now often combined with credential theft. StepSecurity excludes brand-new typosquats from its confirmed-attack count, which is one reason its total is far below package-level counts.
5. CI/CD and build-system compromise
An attacker who controls a build runner, workflow or release job can weaponize software without obviously altering source code. Build systems hold repository tokens, cloud credentials and registry secrets.
6. Mutable GitHub Actions and build dependencies
GitHub’s Actions security roadmap cites incidents involving tj-actions/changed-files, Nx and trivy-action and describes attackers targeting CI/CD automation itself. Workflows that reference mutable tags can run code that changed after review.
7. Software update and distribution compromise
SolarWinds remains the canonical case: malicious code entered a trusted update path, so customers received it through an expected channel.
8. Double supply chain attacks
In the 3CX case, Mandiant traced the compromise to an employee installing trojanized X_TRADER software on a personal computer, after which attackers reached 3CX’s build environments.
CI/CD and GitHub Actions Supply Chain Attacks
Build systems combine code execution with privileged credentials, which makes CI/CD one of the most important trust boundaries. GitHub’s March 2026 roadmap describes a repeating playbook: untrusted code reaches workflows, malicious workflows run without observability, compromised dependencies spread across repositories, and over-permissioned credentials are stolen through unrestricted network access.
tj-actions/changed-files exposed secrets in workflow logs in March 2025
CISA tracked the compromise as CVE-2025-30066, which allowed information disclosure of secrets. Versions used between 12 March 2025 00:00 UTC and 15 March 2025 12:00 UTC were affected. CISA listed leaked credential types including access keys, GitHub personal access tokens, npm tokens and private RSA keys, noted the payload could hide as double-encoded base64, and added both this CVE and the related reviewdog/action-setup compromise (CVE-2025-30154) to its Known Exploited Vulnerabilities catalog. The patched version is v46.0.1. CISA gives no count of affected repositories or leaked secrets, so none is quoted here.
Useful controls include pinning dependencies to immutable commit SHAs or digests, minimizing token permissions, using short-lived credentials, restricting runner network access, verifying artifacts and keeping an inventory of third-party workflow dependencies.
Self-Propagating Package Malware and Supply Chain Worms
One of the biggest changes in 2025 and 2026 is package malware that uses stolen credentials to compromise more trusted packages. ReversingLabs reported that Shai-Hulud compromised more than 1,000 npm packages across two campaigns and exposed an estimated 25,000 GitHub repositories.
Shai-Hulud Miasma reached 304 components within two days
Sonatype’s 4 June 2026 post cited 281 malicious package versions, and its 5 June update raised the total to 304 impacted components. The malware searched for GitHub access tokens, registry authentication tokens and cloud secrets, checked whether stolen credentials worked, and used maintainer credentials to publish malicious artifacts.
Mini Shai-Hulud: 2,225 component versions tracked in August 2026
After Shai-Hulud re-emerged on 4 August 2026 in the keyv and cacheable ecosystems on npm, Sonatype tracked 2,225 component versions and called the count a current snapshot, not a final tally. The malware runs through a preinstall hook, steals npm, GitHub, cloud, Kubernetes, Vault and CI/CD credentials, then republishes other packages with the same hook.
Vulnerable Open-Source Dependencies: The Larger, Quieter Exposure
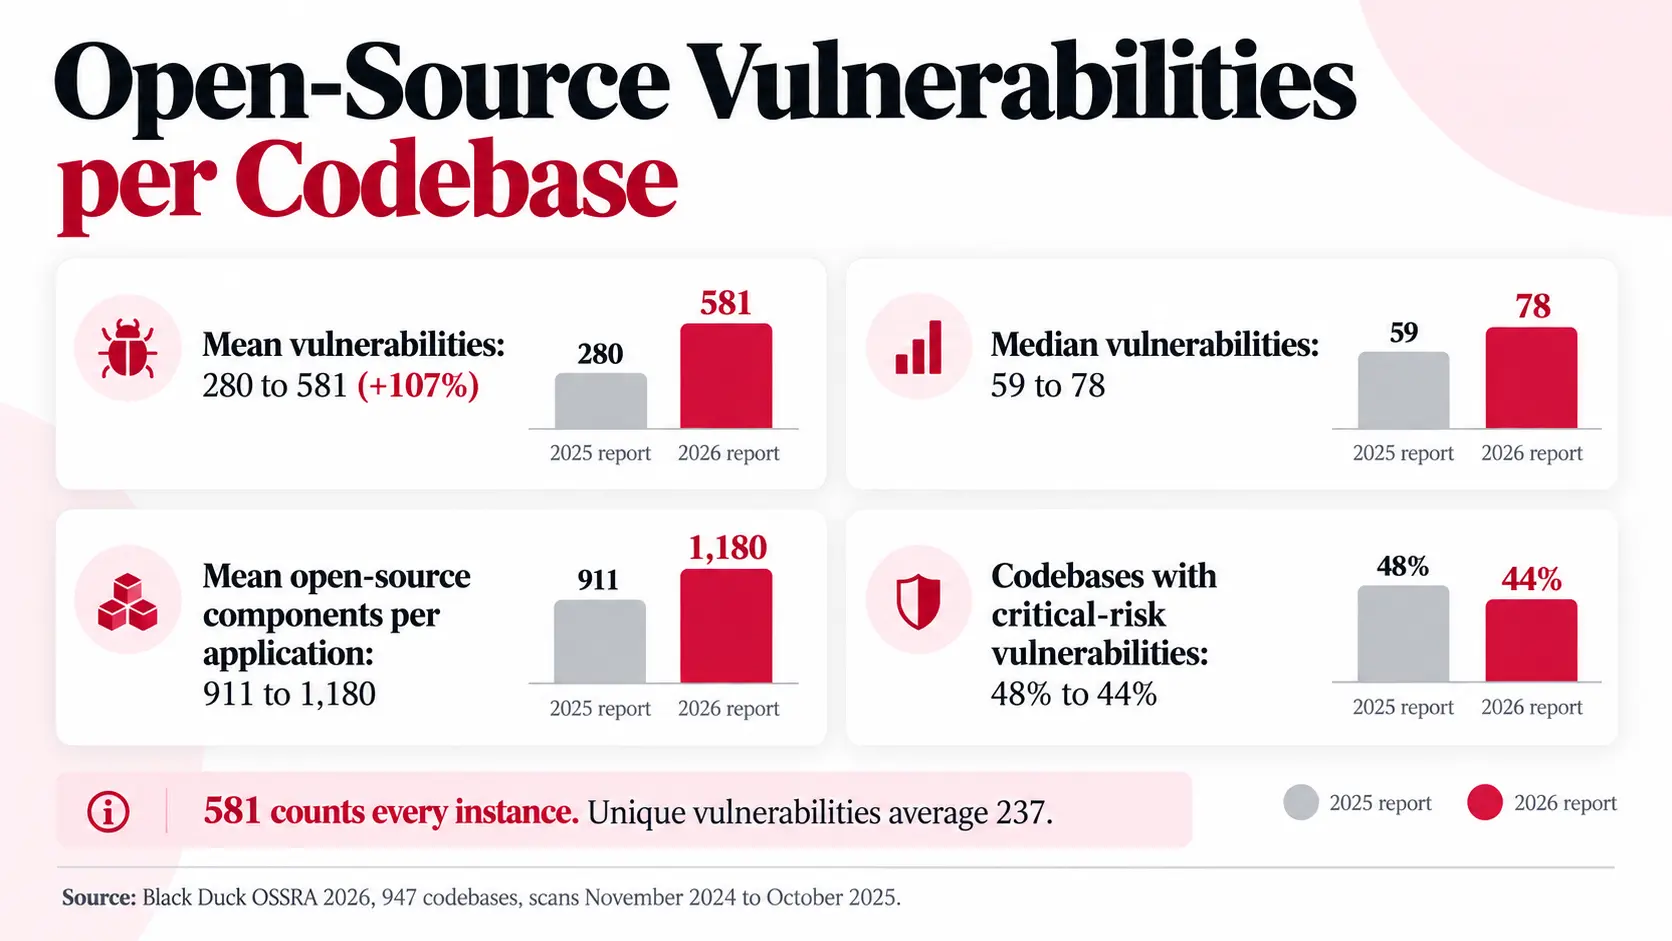
Most dependency risk is not malicious. It is ordinary vulnerabilities in legitimate components that applications inherit. Black Duck’s 2026 OSSRA audited 947 codebases submitted between November 2024 and October 2025.
| Black Duck OSSRA 2026 metric | Latest | Prior report |
|---|---|---|
| Codebases containing open source | 98% | 97% |
| Mean open-source components per application | 1,180 | 911 |
| Codebases with at least one vulnerability | 87% | 86% |
| Mean vulnerabilities per codebase | 581 | 280 (+107%) |
| Median vulnerabilities per codebase | 78 | 59 |
| Codebases with high-risk vulnerabilities | 78% | 81% |
| Codebases with critical-risk vulnerabilities | 44% | 48% |
Source: Black Duck 2026 OSSRA.
Log4j: 13% of 2025 downloads were still vulnerable versions
Sonatype reports that vulnerable Log4j versions made up 13% of all Log4j downloads worldwide in 2025, and that 14% of Log4Shell-affected artifacts are now end of life, representing more than 619 million downloads. Its 2024-edition analysis found about 95% of vulnerable component downloads already had a fix available. Checking whether your own software has reached end of life is a quick first step; ScanTitan’s software end of life checker does that.
About 65% of open-source CVEs had no NVD severity score
Sonatype’s analysis found about 65% of open-source CVEs had no NVD-assigned CVSS score, NVD’s median time to score was 41 days, and Sonatype rated 46% of the unscored CVEs High or Critical. Scanners that depend only on NVD scores can therefore miss severity signals for a long time.
Exploitation and Time to Patch
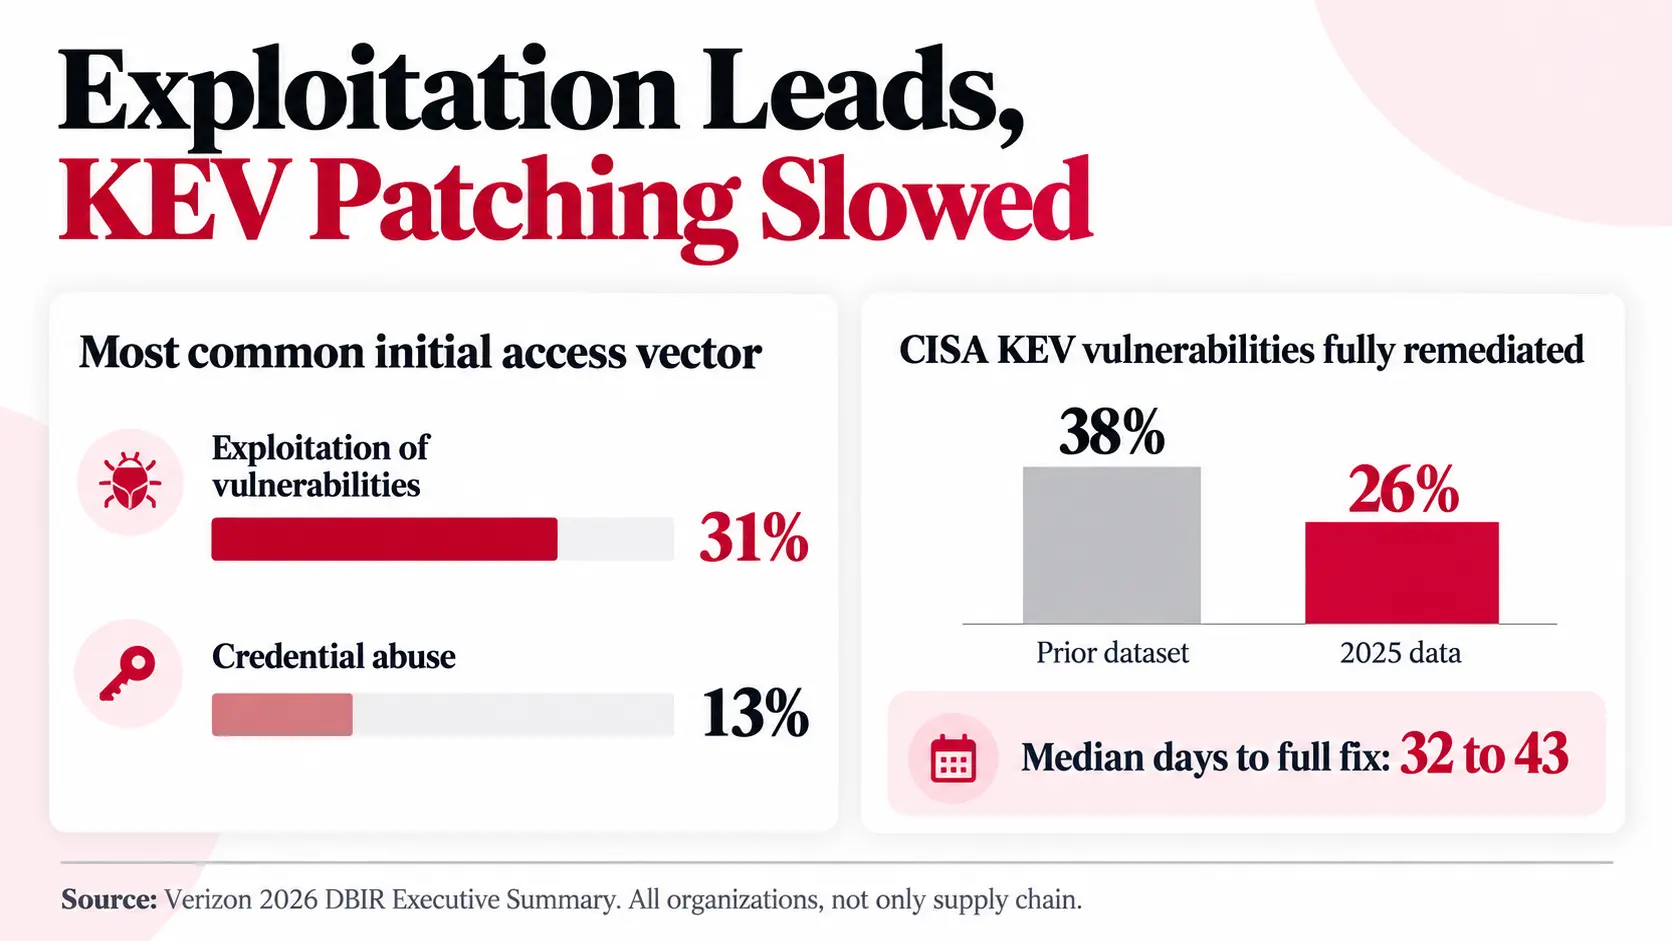
The 2026 DBIR makes the dependency problem concrete. Exploitation of vulnerabilities is now the most common initial access vector for breaches at 31%, ahead of credential abuse at 13%. Phishing stayed at 16% of all breaches and pretexting reached 6%.
| DBIR 2026 patching metric | 2025 data | Prior dataset |
|---|---|---|
| CISA KEV vulnerabilities fully remediated | 26% | 38% |
| Median days to full resolution | 43 days | 32 days |
| Critical vulnerabilities to patch (median case) | 50% more | Baseline |
Source: Verizon 2026 DBIR Executive Summary. These figures cover all organizations and all vulnerabilities in KEV, not only supply chain components.
Prioritizing by exploitation evidence rather than raw CVSS is the practical consequence. ScanTitan’s CVE priority checker is built for that kind of triage.
Third-Party Breach Share by Industry
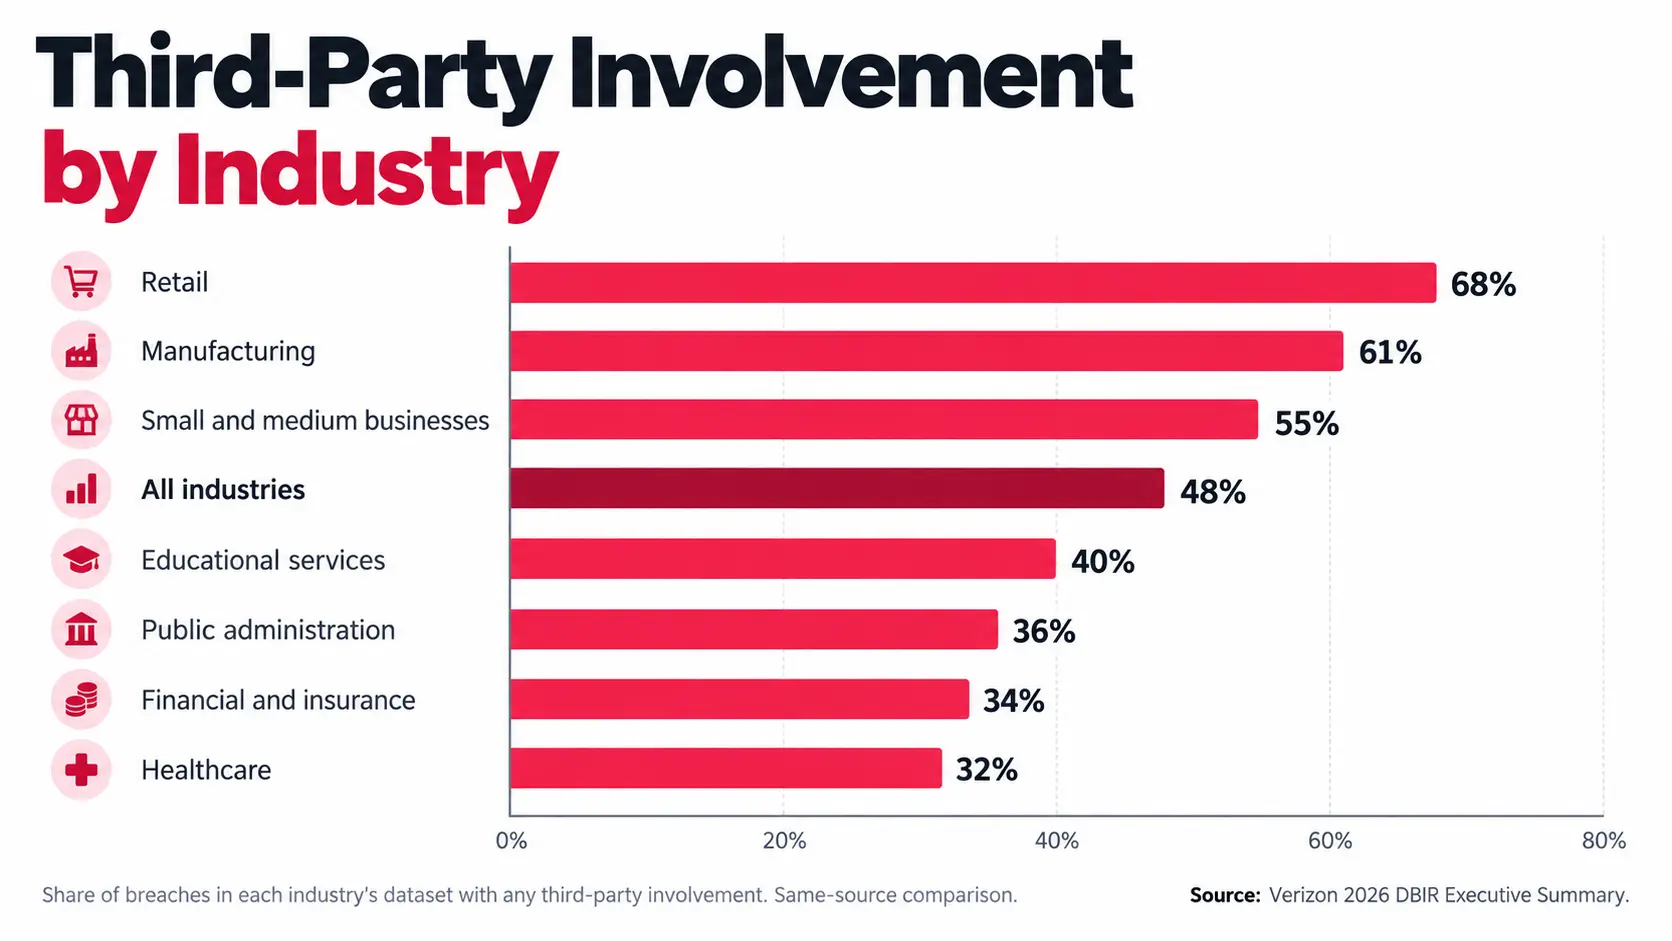
Verizon’s executive summary reports third-party involvement per industry. The shares differ widely, partly because industries rely on outsourced software and services to different degrees.
| Industry (DBIR 2026) | Breaches with third-party involvement |
|---|---|
| Retail | 68% |
| Manufacturing | 61% |
| Small and medium-sized businesses | 55% |
| All industries combined | 48% |
| Educational services | 40% |
| Public administration | 36% |
| Financial and insurance | 34% |
| Healthcare | 32% |
Source: Verizon 2026 DBIR Executive Summary. Each share is within that industry’s breach dataset.
How Much Does a Software Supply Chain Breach Cost?
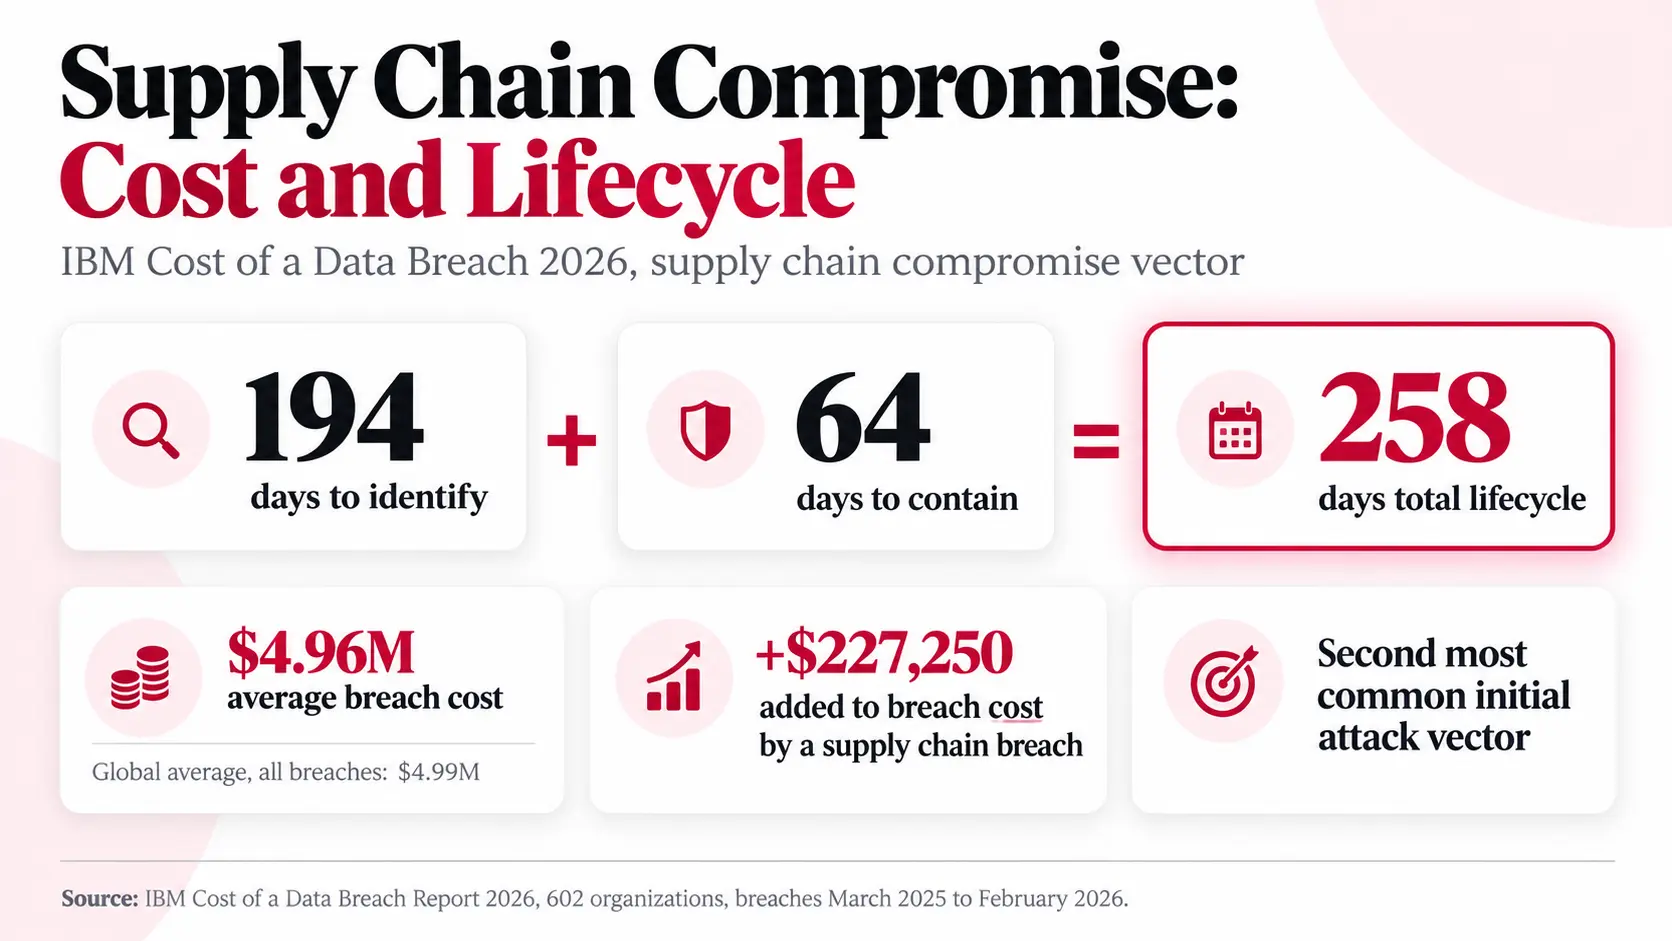
IBM’s Cost of a Data Breach Report 2026 studied 602 breached organizations with breaches between March 2025 and February 2026, conducted by Ponemon Institute. It names supply chain compromise, meaning attacks that use trusted third-party software or other resources, as the second most common initial attack vector, after phishing for the fourth year running.
| IBM benchmark | Value | Correct interpretation |
|---|---|---|
| Average cost, supply chain compromise (2026 report) | $4.96M | Breaches whose initial vector was supply chain compromise; global average across all breaches was $4.99M |
| Mean time to identify | 194 days | Supply chain compromise vector |
| Mean time to contain | 64 days | Supply chain compromise vector |
| Full lifecycle | 258 days | Tied with removable-media replication for longest of the vectors in IBM’s figure |
| Cost added by a supply chain breach (business partner compromise) | +$227,250 | Largest cost-increasing factor of those IBM analyzed |
| Average cost, third-party and supply chain vector (2025 report) | $4.91M | Prior-year figure from IBM’s attack-vector guidance; not directly a 2026 value |
Sources: IBM Cost of a Data Breach Report 2026; IBM, What Is an Attack Vector for the 2025 value.
These are benchmarks for IBM’s supply chain compromise category. They are not the average cost of a malicious npm package or of every software supply chain attack.
Enterprise Software Supply Chain Survey Statistics
The Omdia study sponsored by Docker adds an organizational view that malware telemetry cannot. It surveyed 400 professionals in North America in February 2026.
| Survey finding | Share | Scope |
|---|---|---|
| Had a software supply chain incident in the preceding 12 months | 77% | All respondents |
| Most common attack type: known vulnerabilities in third-party software | 38% | Attack types reported |
| Faced unauthorized access to applications and data | 46% | Reported impact |
| Had SLAs affected by remediation | 37% | Reported impact |
| Had developer credentials, secrets or keys stolen | 35% | Reported impact |
Source: Docker, Omdia 2026 report findings. Percentages describe respondents, not global breach statistics.
SBOM and Software Supply Chain Visibility Statistics
A Software Bill of Materials (SBOM) is an inventory of the components in a software artifact. Its security value is visibility: without it, answering “are we running the compromised version” takes days.
Among Omdia respondents whose organizations generate SBOMs, only 42% do so as a mandatory step for every application, while 55% generate them case by case. Respondents associated SBOMs with these benefits (the survey does not state the base for these three):
- 73%: more efficient vulnerability mitigation
- 72%: implementing security controls and processes
- 68%: meeting compliance requirements
An SBOM does not prove a component is safe. It provides the inventory needed to ask whether this exact component, version or build artifact is affected.
AI and Software Supply Chain Risk
In the Omdia survey, 40% ranked AI technology as the top software supply chain risk, slightly ahead of third-party and open-source code (39%) and software dependencies (38%). That is risk perception, not incident data.
GPT-5 hallucinated 27.8% of component versions in Sonatype’s test
Sonatype analyzed 37,000 AI-driven dependency upgrade recommendations from June to August 2025 and reported that GPT-5 hallucinated 27.8% of component versions and suggested actual malware packages when operating without real-time intelligence. The result applies to that condition and that test, not to AI coding assistants in general, and Sonatype reports its results as point-in-time snapshots.
The concern is speed: AI-assisted development can add dependencies and change build workflows faster than manual review. Dependency verification, provenance and policy enforcement matter more as the pace rises.
Major Software Supply Chain Attacks in 2025 and 2026
| Incident | Year | Mechanism | Confirmed scope / metric | Measurement caution |
|---|---|---|---|---|
| tj-actions/changed-files | 2025 | Compromised GitHub Action | Secrets exposed in workflow logs; CVE-2025-30066; 12 to 15 March 2025 | No public repository count from CISA; exposure is not confirmed theft everywhere |
| Shai-Hulud | 2025 to 2026 | Self-propagating npm compromise | 1,000+ npm packages in two campaigns; ~25,000 GitHub repositories exposed (ReversingLabs) | Packages and repositories are not organizations breached |
| Trivy images | 2026 | Compromised container image tags | aquasec/trivy tags 0.69.4, 0.69.5, 0.69.6 and latest, 19 to 23 March 2026 | Pulling an image creates exposure; impact depends on execution and available secrets |
| Dependency-confusion campaign | 2026 | Dependency confusion | 176 malicious npm packages | Package count, not victim count |
| Shai-Hulud Miasma | 2026 | Credential theft and republishing | 304 impacted components (Sonatype, 5 June) | Snapshot that can grow |
| Mini Shai-Hulud | 2026 | Compromised legitimate packages and propagation | 2,225 component versions (Sonatype, August) | Versions, not organizations |
Trivy: a security scanner became the delivery path
Docker reported that Docker Hub customers who pulled aquasec/trivy tags 0.69.4, 0.69.5, 0.69.6 or latest between 18:24 UTC on 19 March and 01:36 UTC on 23 March 2026 may have exposed CI/CD secrets, cloud credentials, SSH keys and Docker configuration. Docker said its own infrastructure and other images were not compromised and that the issue was isolated to Aqua Security’s images. The last known clean release was 0.69.3. A trusted security tool executing in CI/CD can reach exactly the secrets attackers want.
Most Important Historical Software Supply Chain Attacks
Historical cases are most useful when they show different trust failures, not when ranked by one headline number.
| Incident | Year | Supply chain mechanism | Why it matters |
|---|---|---|---|
| SolarWinds Orion / SUNBURST | 2020 | Compromised build and update path | The canonical malicious-update compromise |
| Codecov Bash Uploader | 2021 | Compromised CI uploader | Exfiltrated environment variables from CI environments |
| Kaseya VSA | 2021 | Zero-day exploitation of remote-management software | Showed downstream amplification through MSP tooling |
| 3CX | 2023 | Double supply chain compromise | A trojanized third-party application led to compromised build environments |
| XZ Utils | 2024 | Malicious code in upstream release tarballs | Showed maintainer-trust risk in critical open source |
SolarWinds: up to 18,000 could have received the update, fewer than 100 were hacked
SolarWinds first reported up to 18,000 customers could have been vulnerable to SUNBURST, based on downloads of the affected Orion versions, and later estimated that fewer than 100 were actually hacked. It said the larger group included customers who never installed the download and those whose servers could not reach the command-and-control server. It is the clearest example of why distribution counts are not compromise counts.
Codecov: CI/CD secrets were the prize
Codecov said attackers modified its Bash Uploader so it extracted git remote origin URLs and environment variables. The root cause was an HMAC key for a Google Cloud Storage service account extracted from an intermediate Docker image layer and used to alter the uploader. Codecov was alerted on 1 April 2021 after a customer noticed a checksum mismatch.
Kaseya: fewer than 60 direct victims, fewer than 1,500 downstream businesses
Kaseya said attackers exploited zero-day vulnerabilities in VSA on-premises to bypass authentication and run arbitrary commands, then used VSA’s own functionality to deploy ransomware. Kaseya reported fewer than 60 directly compromised customers and fewer than 1,500 downstream businesses, and found no evidence its VSA codebase was maliciously modified. The ratio shows how management tooling multiplies reach.
3CX: one supply chain attack caused another
Mandiant found the 3CX compromise began in 2022 when an employee installed trojanized X_TRADER software on a personal computer. The attackers stole the employee’s corporate credentials, reached 3CX through the VPN two days later, and compromised both the Windows and macOS build environments.
XZ Utils: malicious code lived only in the release tarballs
Red Hat documents malicious code in xz upstream tarballs from versions 5.6.0 and 5.6.1, scored CVSS 10 (CVE-2024-3094). The code was in the downloadable tarball and not in the Git source, a reminder that a release artifact can differ from the repository it claims to come from.
Software Supply Chain Regulations and Standards in 2026
| Framework / standard | 2026 relevance | Supply chain focus |
|---|---|---|
| EU Cyber Resilience Act | Manufacturer reporting required from 11 September 2026 | Actively exploited vulnerabilities and severe incidents affecting products with digital elements |
| NIST SP 1326 | Final, July 2026 | Due-diligence assessment for ICT supply chain risk: provenance, resilience, foundational cyber practices, supply chain tiers |
| NIST SP 800-161 Rev. 1 | Basis for SP 1326 | Cybersecurity supply chain risk management practices |
| OWASP Top 10:2025, A03 | Software Supply Chain Failures | Dependencies, build processes and update mechanisms |
CRA reporting started on 11 September 2026
Manufacturers covered by the EU Cyber Resilience Act must now send an early warning within 24 hours and a full notification within 72 hours of becoming aware of an actively exploited vulnerability or severe incident. The final report is due 14 days after a fix for exploited vulnerabilities, or within a month of the 72-hour notice for severe incidents. Obligations for open-source software stewards begin on 11 December 2027.
OWASP ranks supply chain failures third, with 50% of the community survey putting them first
OWASP Top 10:2025 lists Software Supply Chain Failures as A03. In its community survey exactly 50% of respondents ranked the category first. OWASP’s data shows 215,248 occurrences and maps the category to 6 CWEs and 11 CVEs. The 50% measures what practitioners worry about most, not the share of breaches caused by supply chain failures.
Software Supply Chain Statistics Commonly Misquoted
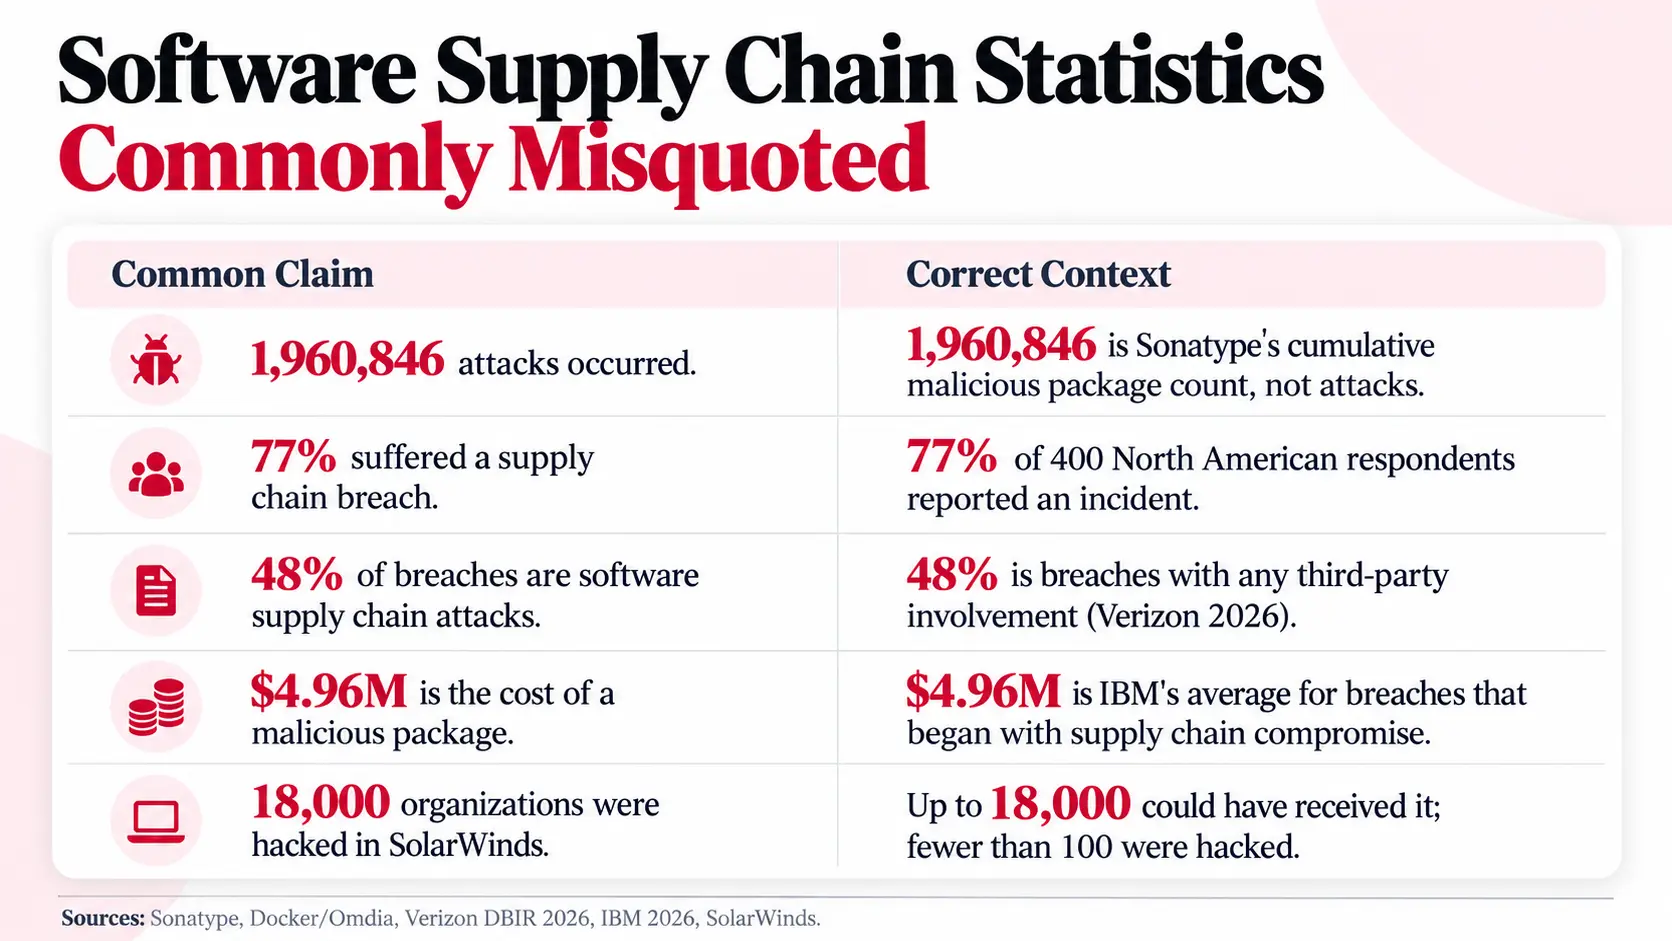
| Common claim | Correct context |
|---|---|
| “1.96 million software supply chain attacks occurred.” | Sonatype logged 1,960,846 malicious packages cumulatively by Q3 2026. Packages are not attack or breach counts. |
| “454,600 breaches occurred in 2025.” | Sonatype identified 454,600+ new malicious packages during 2025. |
| “77% of companies suffered a supply chain breach.” | 77% of 400 Omdia respondents in North America reported a software supply chain incident. |
| “48% of breaches are software supply chain attacks.” | Verizon’s 48% is third-party involvement in breaches, which includes any third-party services and software. |
| “A malicious package costs $4.96 million.” | IBM’s $4.96M is the average cost of breaches whose initial vector was supply chain compromise, not a per-package cost. |
| “9.8 trillion packages were compromised.” | 9.8 trillion is 2025 download and request volume across four registries. |
| “18,000 organizations were hacked through SolarWinds.” | 18,000 customers could have received affected Orion versions; SolarWinds later estimated fewer than 100 were hacked. |
| “581 vulnerabilities means 581 attacks.” | Black Duck’s 581 is the mean number of vulnerability instances per codebase. Unique vulnerabilities average 237. |
| “A vulnerable dependency is a supply chain attack.” | A vulnerability can create shared exposure without anyone compromising the development or distribution chain. |
| “90% of cyber incidents start with phishing.” | No current primary source supports it. Verizon’s 2026 DBIR shows exploitation of vulnerabilities at 31% and phishing at 16%. |
What the Numbers Mean for a Lean Team
For a small IT or security team, the data points to a short list of controls. First, inventory what you run: an SBOM, or at least a list of direct and transitive dependencies per application. Second, treat build systems as production: pin actions and images to immutable digests, give pipeline tokens the minimum permissions and prefer short-lived credentials. Third, patch by exploitation evidence, since only 26% of KEV vulnerabilities were fully remediated in the DBIR dataset and the median fix took 43 days. Fourth, assume a trusted package can ship a bad version and add checks that look at the exact version and its behavior.
Most of these controls live in your code and pipelines. For the internet-facing side, ScanTitan’s JavaScript vulnerability scanner checks the JavaScript your public sites serve, and ScanTitan’s website security statistics cover internet-facing application exposure. They do not replace dependency scanning, SBOM generation or CI/CD hardening, and broader vulnerability data is in ScanTitan’s vulnerability statistics.
How We Compiled and Verified These Statistics
Every figure on this page was checked against the named source on 15 October 2026. Vendor telemetry (Sonatype, ReversingLabs, StepSecurity, Black Duck) is reported as that vendor’s own measurement, in its own unit, and never combined with another vendor’s. Where a source gives a figure without a stated denominator, the text says so.
- Used: vendor and publisher primary pages, Verizon’s DBIR 2026 executive summary and news release, IBM’s 2026 report, CISA, NIST, the European Commission, OWASP and the original incident disclosures.
- Excluded: third-party summaries of other companies’ research, forecasts (including Gartner and Cybersecurity Ventures projections), and the 267-day and 15% IBM figures that circulate for 2025, because they could not be confirmed in IBM’s own pages.
- Superseded: IBM’s 2025 report is shown only as a prior-year reference now that the 2026 report is published.
- Refresh: Sonatype publishes quarterly, so this page is reviewed every 90 days, with the next check due in January 2027.
Primary Sources
- Sonatype, Q3 2026 Open Source Malware Index
- Sonatype, Q2 2026 Open Source Malware Index
- Sonatype, Q1 2026 Open Source Malware Index
- Sonatype, 2026 State of the Software Supply Chain: Open Source Malware
- Sonatype, 2026 Software Infrastructure Growth
- Sonatype, 2026 Vulnerability Management
- Sonatype, 2026 report press release (AI recommendations)
- Sonatype, 176-package dependency-confusion campaign
- Sonatype, Shai-Hulud Miasma
- Sonatype, Mini Shai-Hulud
- StepSecurity, State of Open Source Supply Chain Attacks
- Docker / Omdia, 2026 Software Supply Chain Security Report
- Docker, Omdia 2026 report findings
- ReversingLabs, 2026 report press release
- ReversingLabs, 2026 report takeaways
- Black Duck, 2026 OSSRA
- Verizon, 2026 DBIR news release
- Verizon, 2026 DBIR Executive Summary
- IBM, Cost of a Data Breach Report 2026
- IBM, What Is an Attack Vector
- OWASP Top 10:2025, A03 Software Supply Chain Failures
- GitHub, Actions 2026 Security Roadmap
- CISA, tj-actions/changed-files compromise (CVE-2025-30066)
- Docker, Trivy supply chain compromise
- Codecov, April 2021 post-mortem
- Kaseya, VSA incident overview
- 3CX, Mandiant initial intrusion vector
- Red Hat, CVE-2024-3094 (XZ Utils)
- SolarWinds, investigative update on SUNBURST
- European Commission, Cyber Resilience Act reporting obligations
- NIST SP 1326, C-SCRM Due Diligence Assessment Quick-Start Guide
Frequently Asked Questions
How many software supply chain attacks occur each year?
StepSecurity confirmed 56 open-source supply chain attacks between August 2025 and August 2026, but that is one provider’s corpus, not a worldwide census. Malicious-package vendors report far larger numbers because a package detection is not a distinct attack.
How many malicious open-source packages have been found?
Sonatype had logged 1,960,846 malicious open-source packages by the end of Q3 2026, including 149,329 in Q3 alone. These are package detections, not confirmed enterprise breaches.
Which package ecosystem is most targeted?
npm. It accounted for 89.5% of Sonatype’s Q3 2026 malicious packages and 96.6% in Q2, and ReversingLabs reported npm at nearly 90% of its 2025 detections. The two vendors use different datasets, so compare the direction, not the totals.
What is a software supply chain attack?
It is an attack that abuses trust in how software is created or delivered. Attackers may compromise maintainers, dependencies, registries, build systems, CI/CD workflows, signing processes or updates to reach downstream users.
Is every vulnerable dependency a supply chain attack?
No. Black Duck found a mean of 581 vulnerability instances per audited codebase in 2026, but a vulnerable component is an ordinary flaw unless an attacker abuses upstream trust, as in a poisoned release or compromised build.
What percentage of breaches involve third parties?
Verizon’s 2026 DBIR found third-party involvement in 48% of breaches, up 60% from the prior dataset. The measure covers any third-party involvement, so it is wider than software supply chain attacks.
How much does a software supply chain breach cost?
IBM’s 2026 report puts breaches that began with supply chain compromise at an average of $4.96 million and 258 days to identify and contain. This is IBM’s vector category, not the cost of a malicious package.
Where do 90% of all cyber incidents begin?
No current primary source supports a 90% single origin. Verizon’s 2026 DBIR lists exploitation of vulnerabilities as the most common initial access vector at 31%, with phishing at 16% and credential abuse at 13%.
What are some famous software supply chain attacks?
SolarWinds (2020), Codecov (2021), Kaseya VSA (2021), 3CX (2023), XZ Utils (2024) and tj-actions/changed-files (2025) are the best documented. SolarWinds said fewer than 100 customers were hacked out of up to 18,000 that could have received the update.
Why are CI/CD systems attractive targets?
CISA’s tj-actions alert shows why: a compromised Action exposed access keys, GitHub tokens, npm tokens and private keys through workflow logs. Runners combine code execution with credentials, so one compromised step can expose them.
What is dependency confusion?
An attacker publishes a public package with the name of an internal dependency, often at a very high version number. Sonatype documented 176 such npm packages in May 2026, many at version 99.99.99, to win automated resolution against private packages.
What is an SBOM and how widely is it used?
An SBOM is a machine-readable inventory of the components in an application. Among Omdia respondents who generate SBOMs, 42% make it mandatory for every application and 55% generate them case by case.
How fast are exploited vulnerabilities fixed?
Verizon’s 2026 DBIR found only 26% of CISA KEV vulnerabilities were fully remediated in 2025, down from 38%, and the median time to full resolution rose from 32 to 43 days.
How can organizations reduce software supply chain risk?
Keep a dependency inventory or SBOM, pin dependencies and actions to immutable digests, limit CI/CD token permissions, use short-lived credentials, verify provenance, monitor package behavior and patch by exploitation evidence. Only 42% of SBOM-generating Omdia respondents make SBOMs mandatory for every application.