
Attack surface management statistics describe what organizations expose without fully knowing it, and the numbers come in five different units that cannot be added together. Verizon’s 2026 DBIR found third-party involvement in 48% of breaches, up from 30%. Palo Alto Networks, Siemens and Idaho National Laboratory counted nearly 20 million fingerprinted industrial devices on the internet in 2024, which is vendor-only research. A university study confirmed 10,351 subdomains under the Tranco Top 1M domains as vulnerable to takeover. GitGuardian found that 64% of secrets valid in 2022 were still valid in January 2026. Unit 42 saw 43% of attacks span four or more attack surfaces. An exposed device, a vulnerable domain, a live secret, a third-party breach and a multi-surface attack are five different units. This research keeps each unit separate, dates every count, labels vendor data as vendor-only, and says plainly where the public data is old or thin. Data last checked: 1 November 2026.
Key Attack Surface Management Statistics for 2026
Executive Benchmark: Attack Surface Management Statistics for 2026
| Metric | Latest figure | Period | Trend / context | Source |
|---|---|---|---|---|
| Breaches with third-party involvement | 48% | 2026 DBIR | 30% in the previous report | Verizon 2026 DBIR |
| Third-party cloud MFA issues fully remediated | About 23% | 2026 DBIR (n=7,513) | Half resolved in about a month; about 32% still lingering | Verizon 2026 DBIR |
| Organizations with an admin account lacking MFA on IaaS | 37% | 2026 DBIR snapshot | 14% on Snowflake | Verizon 2026 DBIR |
| Exposed industrial devices, fingerprinted | Nearly 20 million | 2024 | Vendor reports a 332% surge from 2023; vendor-only | Palo Alto Networks |
| Exposed OT device observations | More than 110 million | 2024 | Up 138% on the prior year; vendor-only | Palo Alto Networks |
| Services on non-standard ports | 96% of SOCKS, 68% of HTTP(S), 34% of SSH | Censys 2026 State of the Internet | Vendor-only scan data | Censys |
| Exposed n8n hosts | 113,926 | Censys 2026 State of the Internet | 76% in an affected version range; vendor-only | Censys |
| Subdomains confirmed vulnerable to takeover | 10,351 | Dec 2021 to Jul 2022 | About 114,000 domains hosted on vulnerable services | APNIC summary of the SIGMETRICS 2023 paper |
| Secrets still valid four years later | 64% | Retested Jan 2026 | 28.65 million new secrets reached public GitHub in 2025, up 34%; vendor-only | GitGuardian |
| Attacks spanning four or more attack surfaces | 43% | Unit 42 cases, 2025 | 87% spanned two or more; vendor-only | Unit 42 |
| Time to exfiltration, fastest quarter | 72 minutes | 2025 | 285 minutes in 2024; vendor-only | Unit 42 |
| Average eCrime breakout time | 29 minutes | 2025 | Fastest observed 27 seconds; vendor-only | CrowdStrike |
| Global median dwell time | 14 days | 2025 investigations | 11 days in 2024 | Google Cloud, M-Trends 2026 |
| Mean time to exploit | −7 days (estimate) | 2025 investigations | Exploitation often starts before a patch exists | Google Cloud, M-Trends 2026 |
Methodology: What Counts as an Attack Surface?
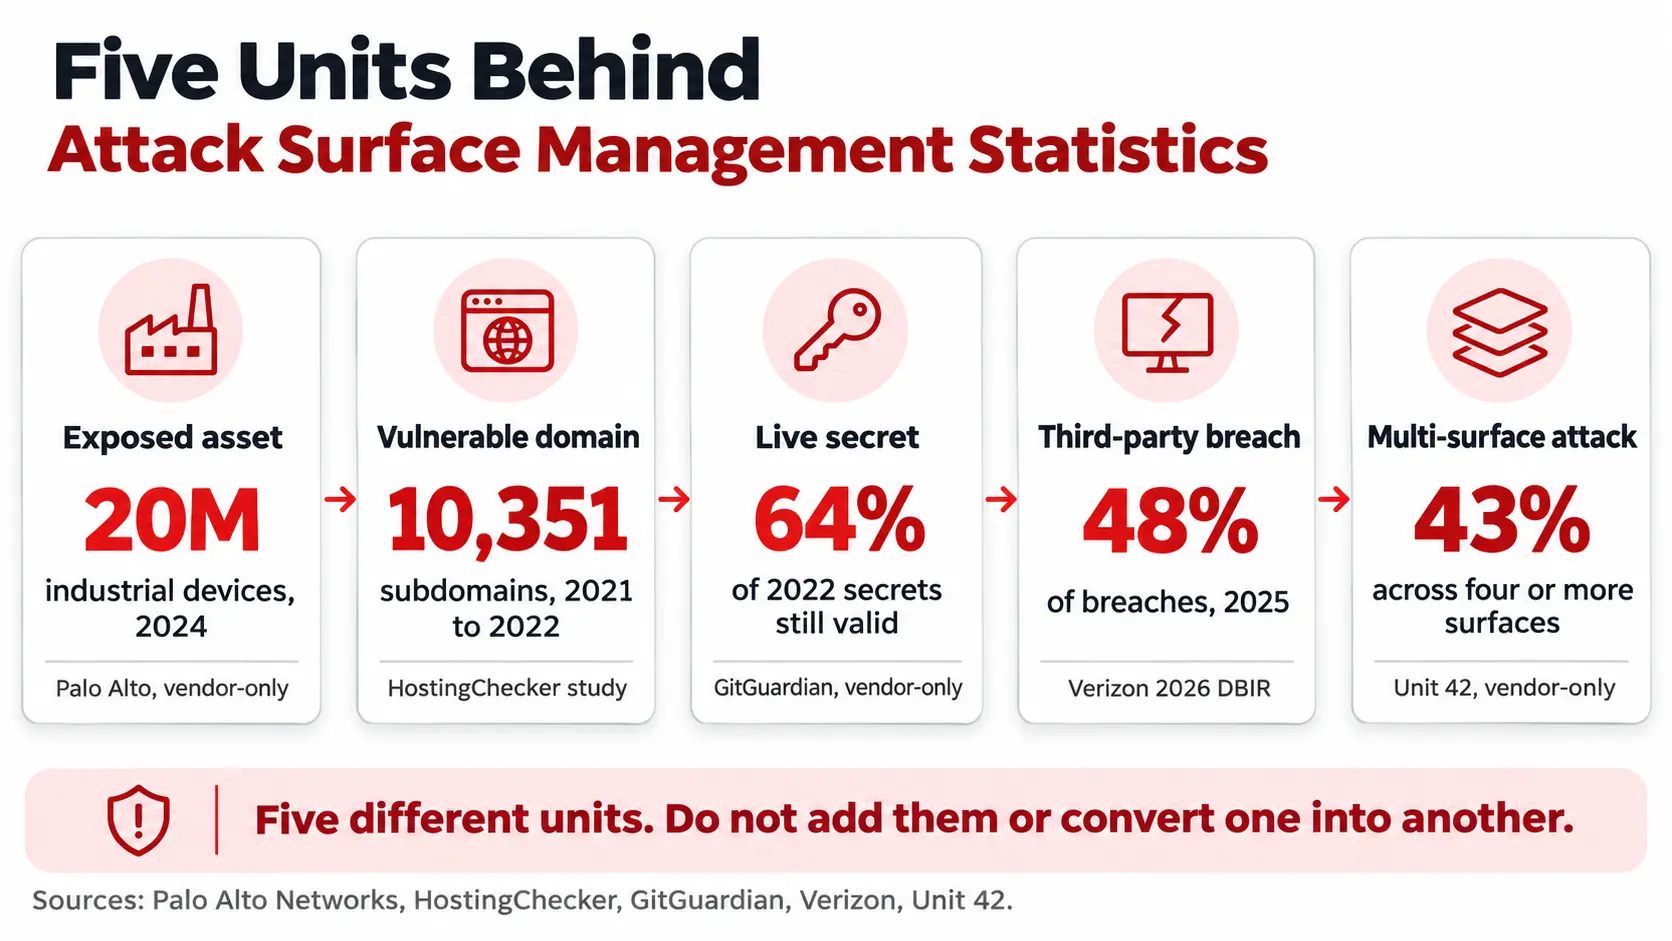
“Attack surface management statistics” is used for five different measurements. Each answers a different question, comes from a different kind of source, and can be wrong in a different way.
| Unit | What it counts | Example 2026 figure | Source type | What it cannot tell you |
|---|---|---|---|---|
| Exposed asset | A device or service reachable from the internet | Nearly 20 million industrial devices (Palo Alto Networks) | Vendor scan telemetry | Who owns it, or whether it is vulnerable |
| Vulnerable domain | A domain or subdomain pointing at a resource that can be claimed | 10,351 subdomains (HostingChecker) | Academic measurement | How many were actually taken over |
| Live secret | A leaked key or password that still works | 64% of 2022 secrets still valid (GitGuardian) | Vendor retest | Which were abused |
| Third-party breach | A breach where a vendor or partner was involved | 48% (Verizon) | Contributed incident data | Which asset the attacker found first |
| Multi-surface attack | An incident with activity on several attack surfaces | 43% across four or more (Unit 42) | Vendor incident response cases | How common it is outside Unit 42’s customers |
Source confidence. Verizon’s DBIR is a contributed incident corpus. Mandiant’s M-Trends reports its own investigations. Everything attributed to Palo Alto Networks, Censys, GitGuardian, CrowdStrike and Unit 42 is vendor research, which describes that vendor’s scanning or customers. The HostingChecker study is peer-reviewed but covers 2021 and 2022. There is no public, neutral count of how many internet-facing assets an average organization has, so this report does not give one.
Counting rules used here. Every figure carries its period. Asset counts are never converted into vulnerability or breach counts. Where the same ecosystem is counted by two sources, both are shown with their definitions.
How Big Is the Unknown Attack Surface?
No neutral source publishes the average number of internet-facing assets per organization. What the public data shows is where services hide, and how fast new kinds of exposure appear.
Services outside the default ports
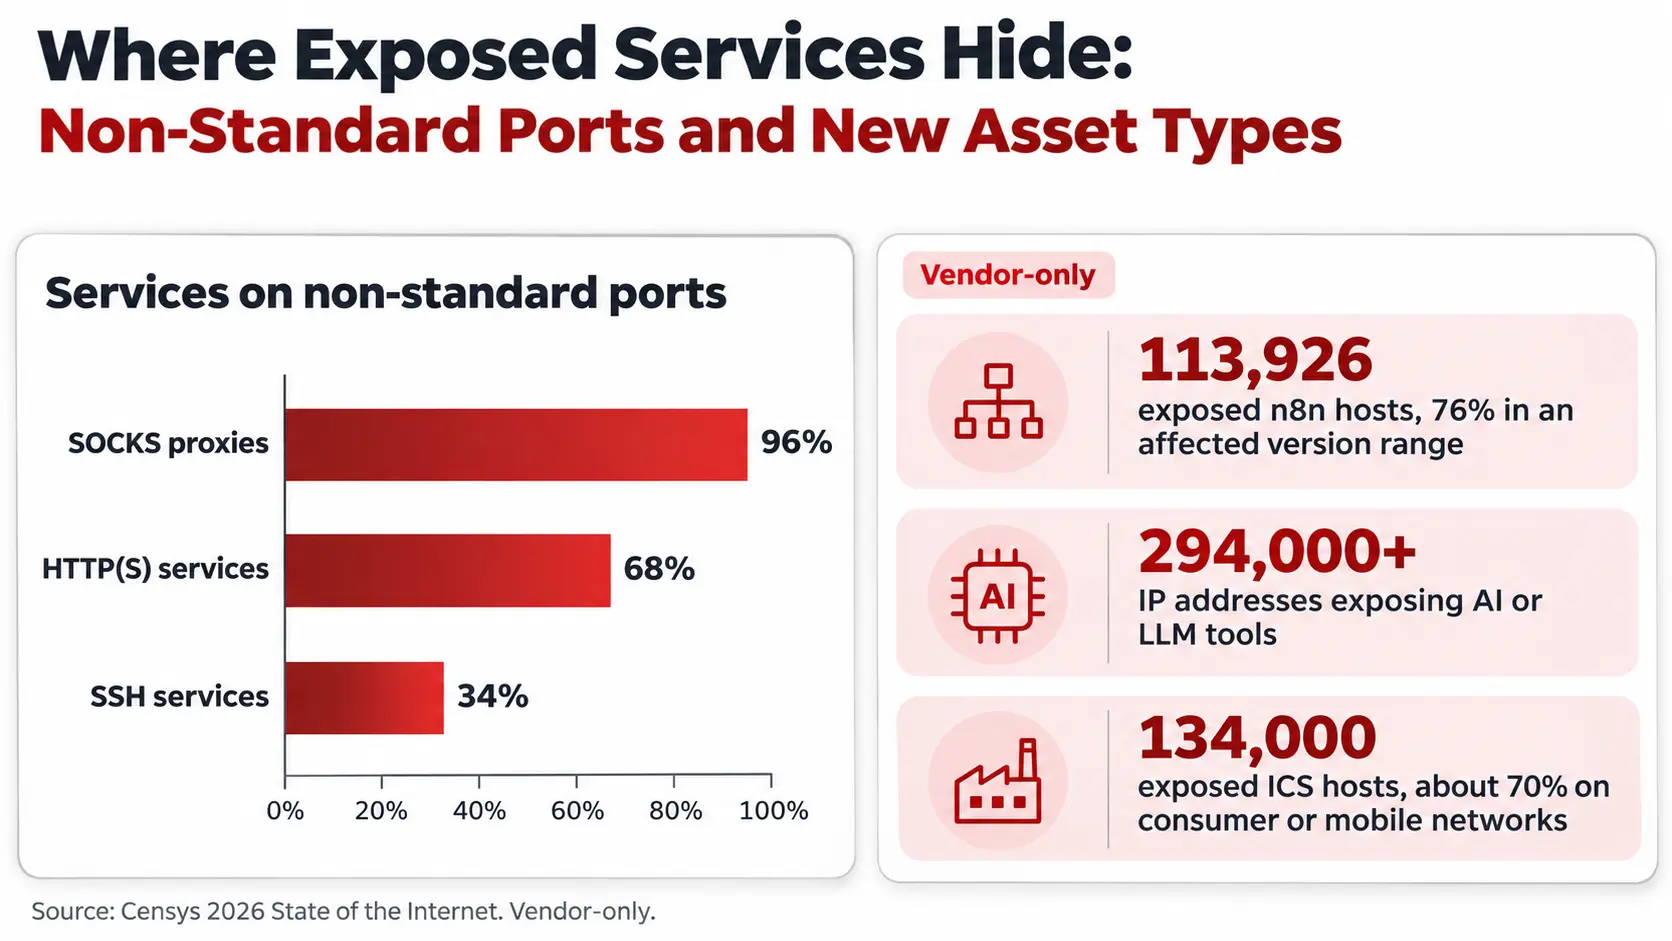
Censys’s 2026 State of the Internet found that 96% of SOCKS proxies, 68% of HTTP(S) services and 34% of SSH services run on non-standard ports. An asset list built from default port numbers misses a large share of what is exposed. Source: Censys, vendor-only.
New kinds of assets: AI and automation tools
Censys reported that hosts exposing AI-related services rose more than 63% from October 2025 to July 2026. More than 294,000 distinct IP addresses exposed at least one of 43 AI or LLM tools, up from about 183,000 in October 2025. It counted 113,926 exposed n8n hosts, 76% of them in an affected version range. Source: Censys, vendor-only.
Industrial and operational technology
Palo Alto Networks, Siemens and Idaho National Laboratory reported that fingerprinted industrial devices on the internet grew from 6 million in 2023 to 20 million in 2024, which the vendor describes as a 332% surge. Cortex Xpanse recorded more than 110 million observations of exposed OT devices in 2024, up 138%. Separately, Censys counted about 134,000 exposed industrial control systems, about 70% of them on consumer or mobile networks. Sources: Palo Alto Networks and Censys, both vendor-only.
For counts of exposed ports and services by type, see ScanTitan’s open ports statistics.
Third-Party and Vendor-Hosted Assets
Verizon’s 2026 DBIR put third-party involvement in 48% of breaches, up from 30% in the previous report, a 60% increase after the metric had already doubled the year before. Verizon counts three relationships: a vendor in the software supply chain, a vendor hosting the organization’s data, and a vendor with a connection into the organization’s environment. Breaches increasingly combine two or all three.
How long third-party exposures stay open
For the first time Verizon had data from inside third-party cloud environments, not only outside scans.
| Third-party cloud finding | 2026 value |
|---|---|
| Organizations that fully remediated MFA issues | About 23% (n=7,513) |
| Time for half of MFA findings to be resolved | Roughly one month |
| MFA findings still lingering | About 32% |
| Full remediation of weak passwords and excessive permissions | 31%, taking almost eight months |
| Organizations with an admin account lacking MFA on an IaaS platform | 37% |
| Organizations with an admin account lacking MFA on Snowflake | 14% |
Source: Verizon 2026 DBIR, pages 20 to 22. Verizon read the lower Snowflake figure as a sign that customers responded to the 2024 credential campaign. For other cloud settings that expose assets, see common cloud misconfigurations.
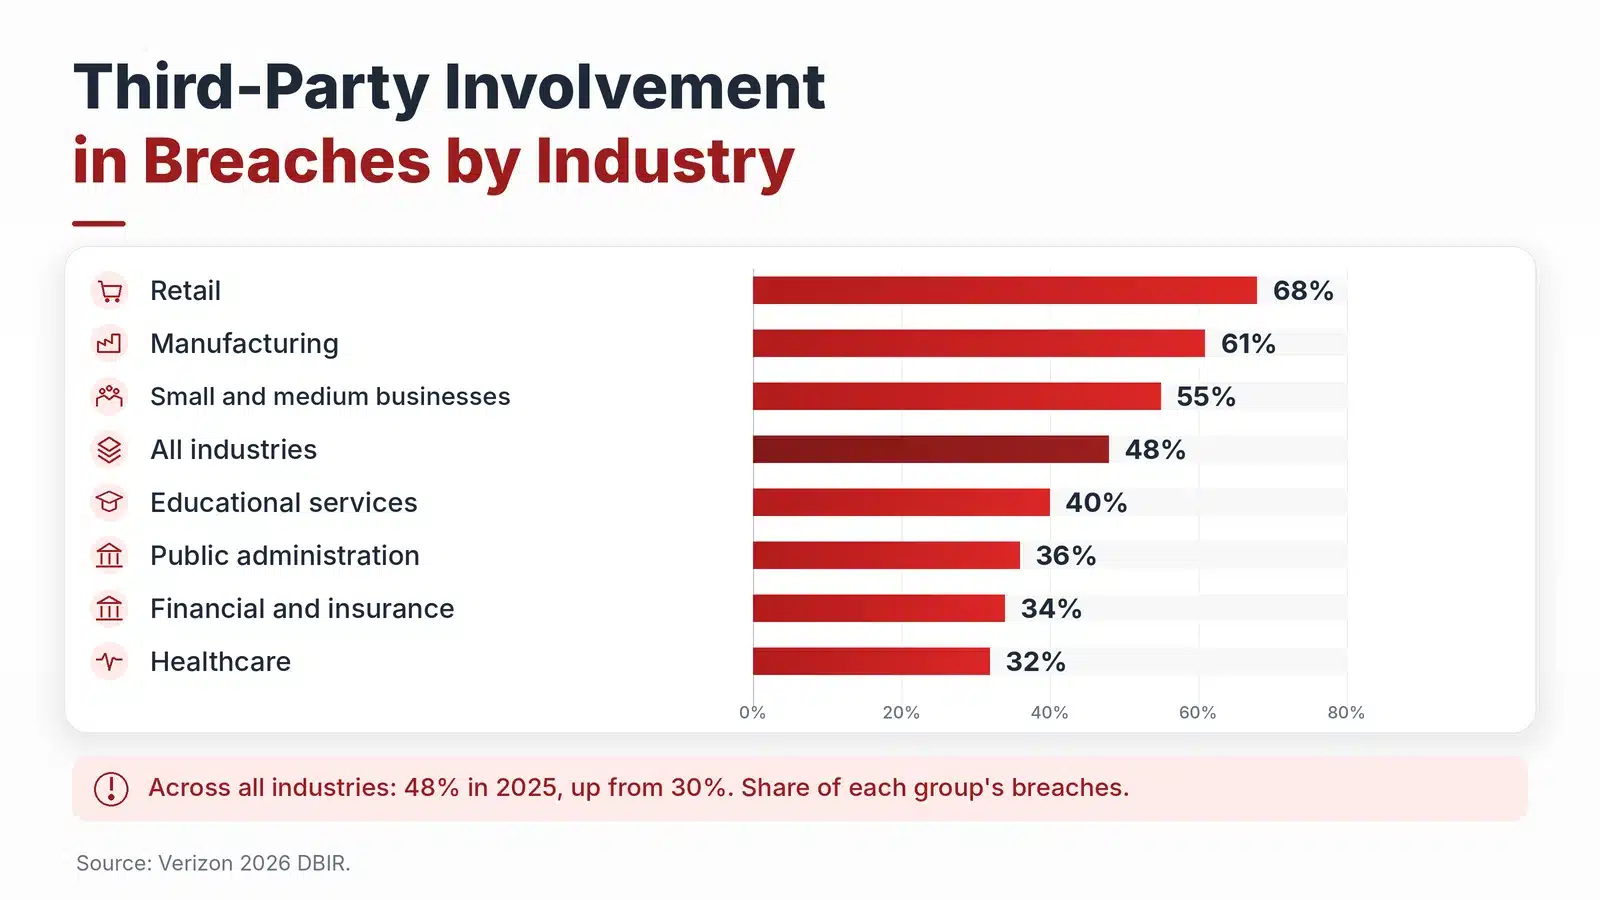
Third-party involvement by industry
| Industry or size | Breaches with third-party involvement |
|---|---|
| Retail | 68% |
| Manufacturing | 61% |
| Small and medium businesses | 55% |
| All industries | 48% |
| Educational services | 40% |
| Public administration | 36% |
| Financial and insurance | 34% |
| Healthcare | 32% |
Source: Verizon 2026 DBIR, industry pages. Each percentage is a share of that group’s breaches in the dataset, so it is not a ranking of attack frequency. For the supply chain side, see ScanTitan’s third-party data breach statistics.
DNS and Subdomain Takeover
A dangling DNS record points a subdomain at a cloud or hosting resource that has been deleted. An attacker can claim the freed resource and serve content under the organization’s own domain. The best public measurement is the HostingChecker study, published at ACM SIGMETRICS in 2023.
| HostingChecker finding | Value |
|---|---|
| Hosting services identified | 165, with 65 found vulnerable |
| Domains hosted on vulnerable services | About 114,000 |
| Subdomains under the Tranco Top 1M confirmed vulnerable | 10,351 |
| New vulnerable domains emerging | Over 200 per week |
| Data collection period | December 2021 to July 2022 |
Source: APNIC, unravelling the threat of hosting-based domain takeovers, summarizing the authors’ SIGMETRICS 2023 paper. The passive DNS dataset processed about 600 billion queries a day.
The figures are real but dated. They show that the problem exists at scale and that it is easy to create, not how large it is in 2026. No newer public measurement of comparable scope was found. The affected services included cloud storage, content delivery networks and website builders from large providers.
Secrets and Credentials Tied to Assets
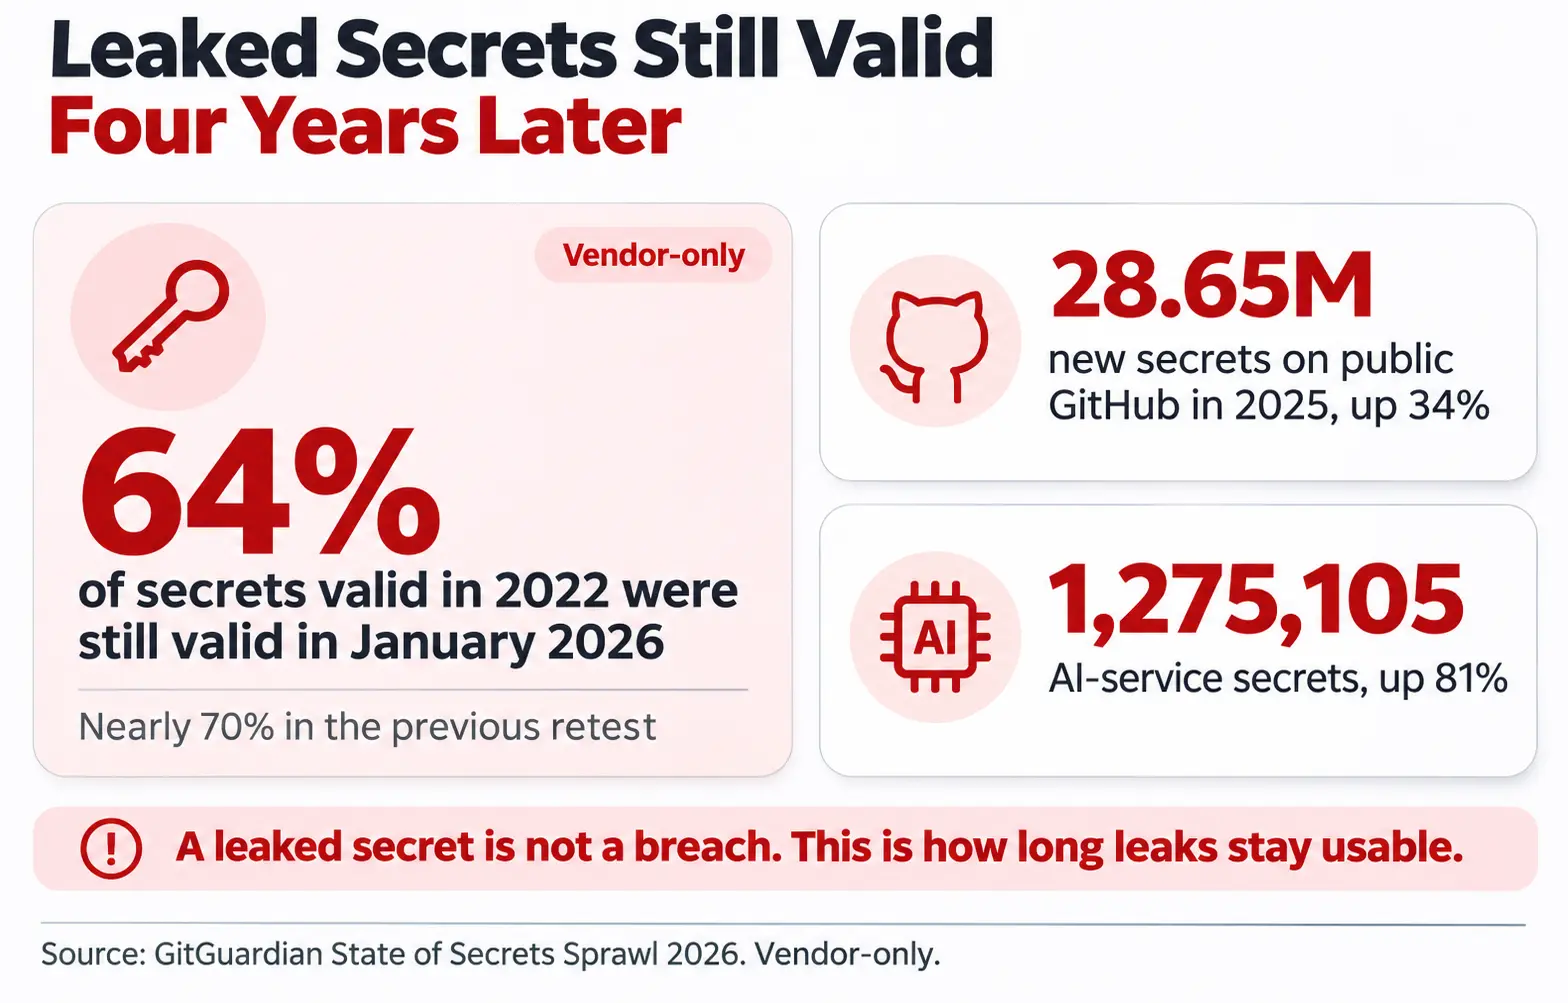
Every exposed asset has an identity behind it, and those identities leak. GitGuardian’s 2026 report found 28.65 million new hardcoded secrets in public GitHub commits in 2025, up 34%. Secrets tied to AI services reached 1,275,105, up 81%. When it retested secrets that were valid in 2022, 64% were still valid in January 2026, down from nearly 70% in the earlier retest. Source: GitGuardian, vendor-only.
Verizon’s 2026 data shows why this matters at the perimeter. Credential abuse was the first step in 13% of breaches and appeared at any step in 39%, and use of stolen credentials was recorded in 36% of breaches. For how those figures are counted, and for infostealer and session theft data, see ScanTitan’s credential theft statistics.
Exposure Duration and Attacker Speed
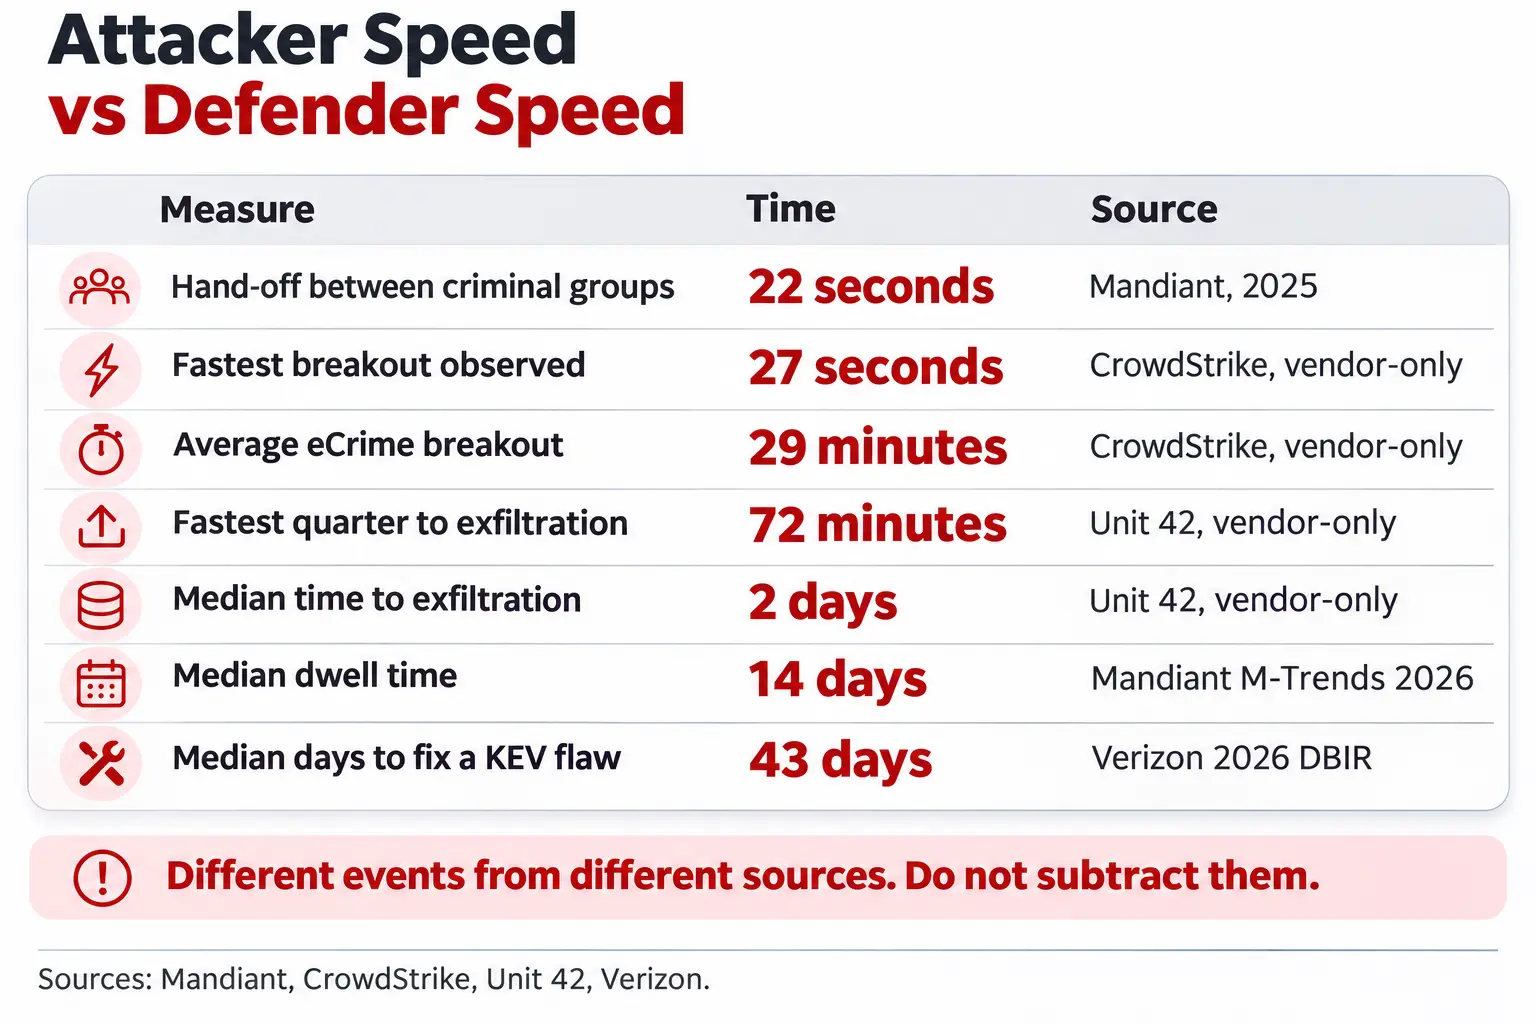
An attack surface is only as risky as the time between exposure and discovery. Several sources measure different parts of that clock.
| Clock | Figure | Source |
|---|---|---|
| Time to first probe of a new exposed service | Within minutes for HTTP(S); often under an hour for SSH; under 7 hours for a relocated SMB port | Censys honeypot experiment, vendor-only |
| Hand-off from initial access to a second group | 22 seconds in 2025; more than 8 hours in 2022 | Mandiant M-Trends 2026 |
| Average eCrime breakout time | 29 minutes in 2025; fastest observed 27 seconds | CrowdStrike, vendor-only |
| Fastest quarter, access to exfiltration | 72 minutes in 2025; 285 minutes in 2024 | Unit 42, vendor-only |
| Median time to exfiltration, all cases | 2 days | Unit 42, vendor-only |
| Global median dwell time | 14 days in 2025; 11 days in 2024 | Mandiant M-Trends 2026 |
| Mean time to exploit | −7 days (estimate) | Mandiant M-Trends 2026 |
| KEV vulnerabilities fully remediated | 26%; median 43 days to fix | Verizon 2026 DBIR |
Sources: Censys, Google Cloud, M-Trends 2026, CrowdStrike, Unit 42 and the Verizon 2026 DBIR Executive Summary.
Mandiant also reported that, across all 2025 investigations, organizations first detected malicious activity internally 52% of the time, up from 43% in 2024. It singled out unmonitored edge devices, where a backdoor family reached dwell times of nearly 400 days, and noted that standard 90-day log retention leaves defenders blind to the original access.
Exposure is found in minutes, exploitation can come before a patch, and remediation takes weeks. These figures measure different events, so they cannot be subtracted from one another. For the scanning and edge device data behind the first rows, see the open ports statistics linked above, and for time to exploit across all vulnerabilities, ScanTitan’s vulnerability statistics.
Attacks Across Several Surfaces
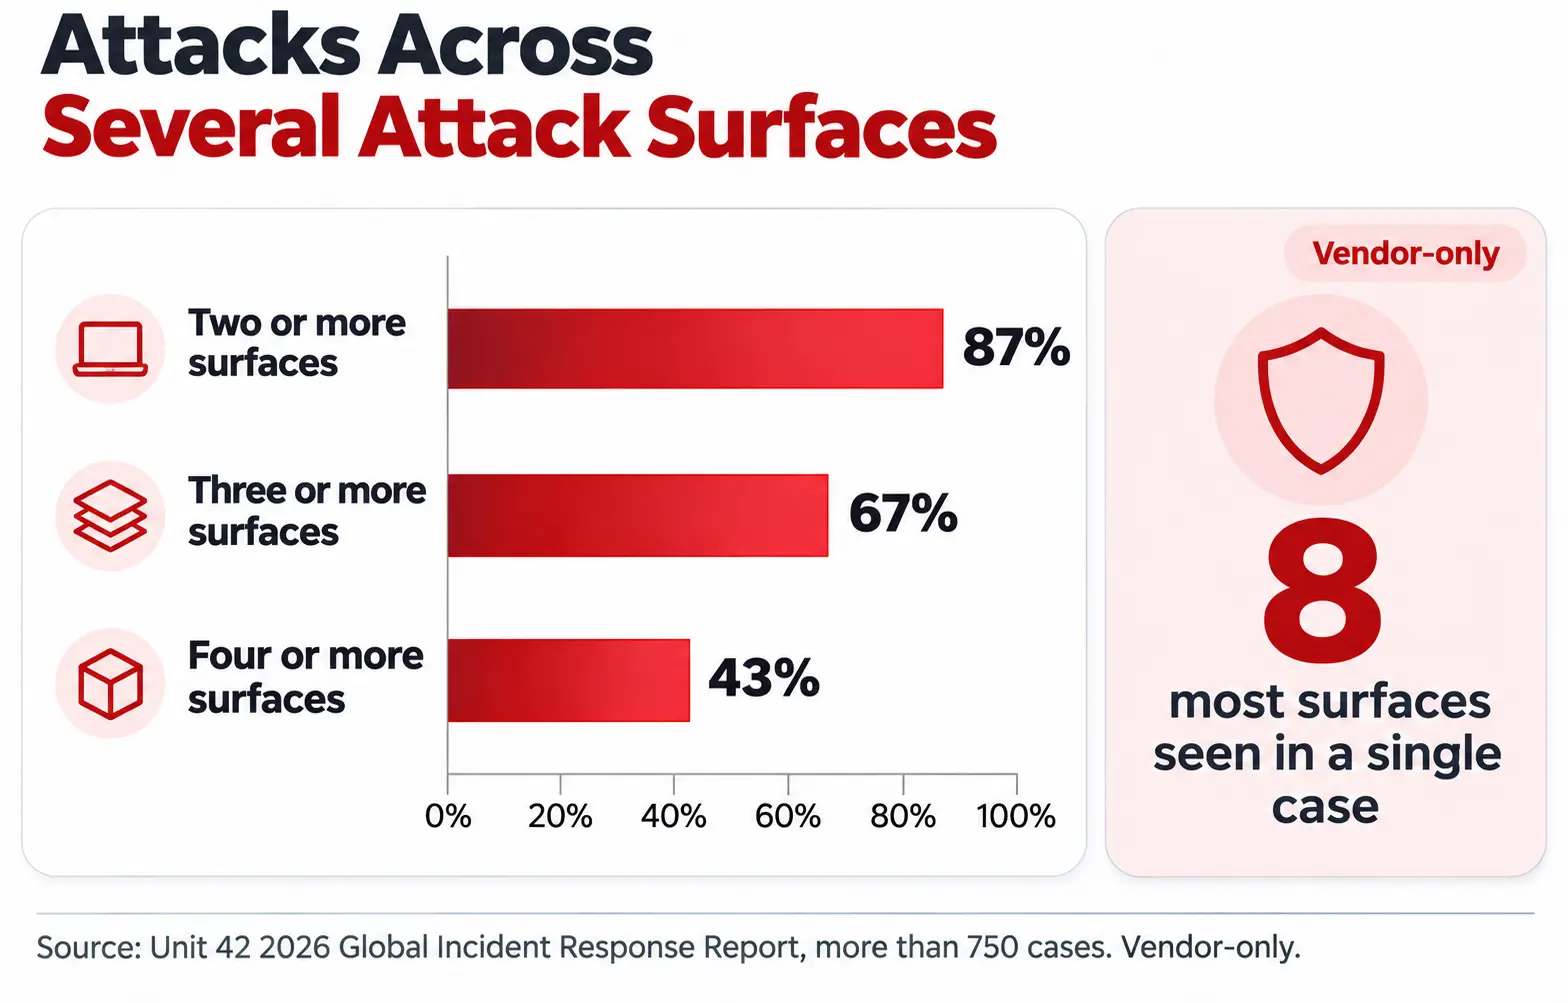
Unit 42 tracks how many attack surfaces an intrusion touches, for example endpoint, cloud, identity and the browser. In its 2026 report, covering more than 750 cases from October 2024 to September 2025:
| Unit 42 finding | Share of attacks |
|---|---|
| Activity across two or more attack surfaces | 87% |
| Activity across three or more attack surfaces | 67% |
| Activity across four or more attack surfaces | 43% |
| Maximum surfaces observed in a case | Eight |
Source: Unit 42 2026 Global Incident Response Report, vendor-only. The sample is Unit 42’s own incident response customers, so it describes serious incidents, not all attacks.
The point for exposure management is that an attacker rarely stays on the surface where they entered. A forgotten asset on one surface can be the first step toward several others.
Attack Surface Management Statistics Commonly Misquoted
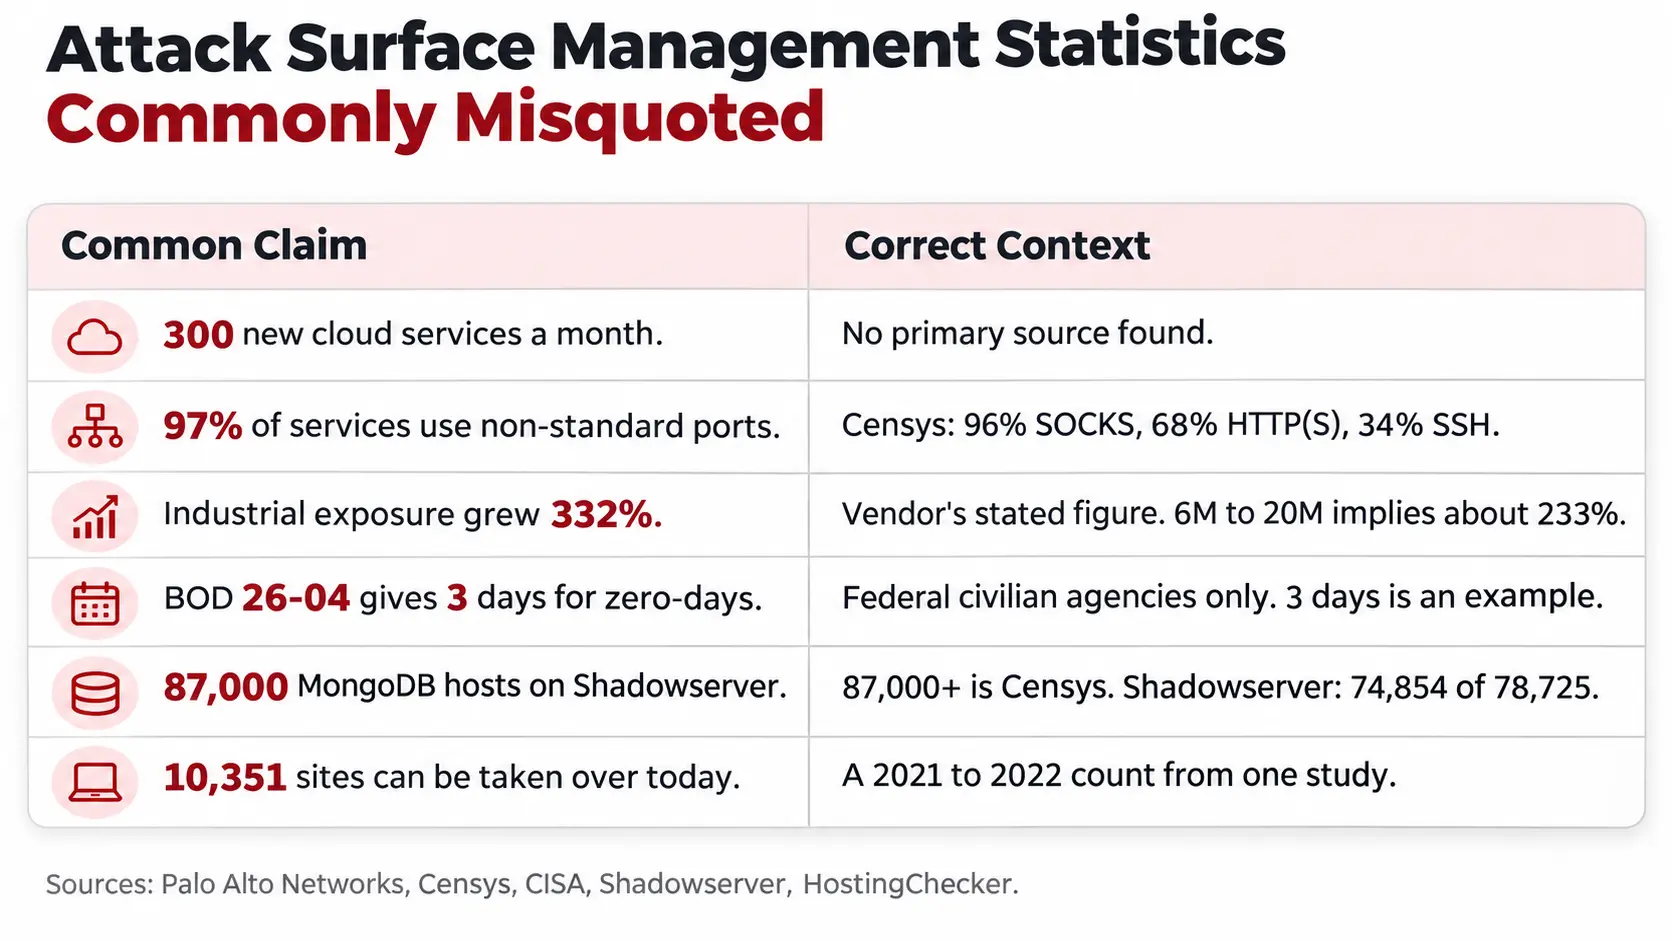
| Common claim | Correct context |
|---|---|
| “The average company adds 300 cloud services a month.” | No primary source for this was found, so it is not used. |
| “97% of services run on non-standard ports.” | Censys 2026: 96% of SOCKS, 68% of HTTP(S) and 34% of SSH services run on non-standard ports. |
| “Security teams test only 32% of their attack surface.” | No primary source was found for this figure, so it is not used. |
| “Industrial exposure grew 332%.” | That is Palo Alto’s stated figure for fingerprinted devices from 2023 to 2024. Its rounded counts, 6M to 20M, imply about 233%. |
| “BOD 26-04 gives 3 days for zero-days on internet-facing systems.” | BOD 26-04 sets risk-based prioritization for federal civilian agencies. The 3-day figure is an example case. |
| “87,000 MongoDB servers on Shadowserver.” | 87,000+ is Censys’s count on 27 December 2025. Shadowserver counted 74,854 possibly unpatched of 78,725 exposed on 29 December. |
| “Subdomain takeover affects 10,351 sites today.” | 10,351 is a December 2021 to July 2022 count from a research study. |
| “Credential abuse is 13% of attacks.” | 13% is credential abuse as the first step in breaches; it is 39% at any step. |
What the Numbers Mean for a Lean Team
You cannot manage what you cannot list, and the public data shows the list is always incomplete. A short order of work:
- Start from what an outsider sees. Build the asset list from DNS, certificate and scan data, not from your CMDB. Services on non-standard ports and AI tools show up here first. ScanTitan’s internet-exposed services guide shows what an attacker can see on a public IP, and an IP vulnerability scanner tests it from outside.
- Delete DNS records when you delete resources. Dangling records are created by deprovisioning without cleanup. Put the DNS step in the same ticket or pipeline as the teardown.
- Ask vendors about their exposure, not their paperwork. Verizon found weak passwords and excess permissions in third-party clouds took almost eight months to fix.
- Rotate and revoke secrets after exposure. Six in ten leaked secrets were still valid four years on.
- Put edge devices and management planes on the monitored list. Mandiant tied dwell times of nearly 400 days to unmonitored edge devices.
- Re-scan on a schedule. The first probe of a new service can arrive within minutes, so an annual review is too slow. ScanTitan’s attack surface management page describes continuous discovery.
How We Compiled and Verified These Statistics
- Used: Verizon’s 2026 DBIR (full report), Google Cloud’s M-Trends 2026, Palo Alto Networks and Unit 42 reports, Censys reports, the ACM SIGMETRICS HostingChecker study through APNIC’s summary, GitGuardian’s 2026 report and CrowdStrike’s 2026 Global Threat Report. Vendor figures are labeled vendor-only.
- Method: Figures were read from the primary page or report and tied to their period and unit. The Mandiant, Palo Alto OT, APNIC and Verizon figures were read on their own pages. GitGuardian, Unit 42 and CrowdStrike figures were confirmed through the vendors’ published pages and search listings.
- Excluded: Figures that could not be traced to a primary source, including claimed monthly asset growth, attack surface testing coverage, remediation half-lives and dangling record lifetimes quoted without a named report.
- Refresh: Reviewed every 90 days. Vendor reports update on their own cycles, and Verizon and Mandiant annually.
How to cite this research. ScanTitan, “Attack Surface Management Statistics 2026: Unknown Assets, Exposure & Risk,” 1 November 2026. For single figures, cite the primary source beside each number.
Primary Sources
- Verizon 2026 Data Breach Investigations Report and Executive Summary
- Google Cloud, M-Trends 2026
- Palo Alto Networks, Operational Technology and the Public Internet
- Unit 42 2026 Global Incident Response Report and report summary
- Censys 2026 State of the Internet and ICS edition
- Censys, who’s knocking on your door
- APNIC, hosting-based domain takeovers
- GitGuardian, State of Secrets Sprawl 2026
- CrowdStrike 2026 Global Threat Report
- CISA BOD 26-04
Frequently Asked Questions
What is attack surface management?
It is the continuous process of discovering every internet-facing asset an organization owns or depends on, and monitoring each for exposure. It covers known assets, forgotten ones and those run by vendors.
How many breaches involve third parties?
Verizon’s 2026 DBIR found third-party involvement in 48% of breaches, up from 30% in the previous report. It was highest in retail (68%) and manufacturing (61%).
How many internet-facing assets does a company have?
No neutral public source publishes an average. Vendor tools report their customers’ counts, but those are not comparable. Treat any single number quoted for “the average organization” with caution.
Do non-standard ports hide services?
No. Censys found 96% of SOCKS proxies, 68% of HTTP(S) services and 34% of SSH services already run on non-standard ports, and internet-wide scanners identify services by how they answer.
How many industrial devices are exposed to the internet?
Palo Alto Networks, Siemens and Idaho National Laboratory fingerprinted nearly 20 million in 2024, with a stated 332% surge from 2023. Censys separately counted about 134,000 exposed industrial control systems. Both are vendor-only.
What is a dangling DNS record?
It is a DNS record that still points at a cloud or hosting resource that has been deleted. An attacker can claim that resource and serve content on the organization’s subdomain.
How common is subdomain takeover?
A 2023 research study confirmed 10,351 vulnerable subdomains under the Tranco Top 1M domains in data from December 2021 to July 2022, with over 200 new vulnerable domains emerging weekly. There is no newer public measurement of comparable scope.
How long do leaked secrets stay valid?
GitGuardian found that 64% of secrets valid in 2022 were still valid in January 2026. That is a vendor figure for secrets detected in public repositories.
How fast do attackers move after getting in?
CrowdStrike reported an average eCrime breakout time of 29 minutes in 2025. Unit 42 found the fastest quarter of intrusions reached data exfiltration in 72 minutes, down from 285 minutes in 2024. Both are vendor-only.
What is the median dwell time?
Mandiant’s M-Trends 2026 reported a global median dwell time of 14 days in 2025, up from 11 days, driven partly by espionage and North Korean IT worker cases, where it was 122 days.
How many attacks span several attack surfaces?
In Unit 42’s 2026 report, 87% of attacks involved two or more attack surfaces, 67% three or more and 43% four or more, with up to eight in one case.
How long do third-party cloud exposures take to fix?
In Verizon’s 2026 DBIR, half of third-party cloud MFA findings were resolved in about a month, but only about 23% were fully remediated. Weak passwords and excessive permissions took almost eight months.