
Web application attack statistics are easy to misread because the biggest numbers count three different things: vulnerabilities found in applications, attack attempts seen at the edge, and confirmed data breaches. OWASP recorded 1,839,701 broken access control occurrences in data from more than 2.8 million tested applications. Akamai counted 311 billion web attacks in 2024. Verizon’s 2026 DBIR attributed 2,281 confirmed breaches, about 10% of all breaches in its dataset, to its Basic Web Application Attacks pattern, and found that exploitation of vulnerabilities, at 31%, overtook credential abuse, at 13%, as the most common way in. None of those numbers converts into another. This research keeps each unit separate, states the denominator behind every figure, marks vendor traffic data as vendor-only, and explains where sources appear to disagree. Data last checked: 15 October 2026.
Key Web Application Attack Statistics for 2026
Executive Benchmark: Web Application Attack Statistics for 2026
| Metric | Latest figure | Period | Trend / context | Source |
|---|---|---|---|---|
| Applications behind OWASP Top 10:2025 | Over 2.8 million | Contributor data starting 2021 | 8 of 10 categories come from data, 2 from a community survey | OWASP Top 10:2025 |
| Broken access control occurrences | 1,839,701 | OWASP 2025 dataset | Highest of the 10 categories; 40 mapped CWEs | OWASP A01 |
| Injection mapped CVEs | 62,445 | OWASP 2025 dataset | Cross-site scripting over 30,000 and SQL injection over 14,000 of them | OWASP A05 |
| CWE Top 25 first and second | XSS 60.38; SQL injection 28.72 | CVEs published 1 Jun 2024 to 1 Jun 2025 | 39,080 CVE records analyzed | MITRE CWE Top 25 |
| CISA KEV catalog size | 1,745 | Catalog version 2026.10.14 | 261 added in 2026 so far vs 245 in all of 2025 | CISA KEV feed, counted by ScanTitan |
| KEV entries tagged with a web weakness | 633 (36%) | Catalog version 2026.10.14 | 127 of the 261 additions in 2026 (48.7%) vs 103 of 245 in 2025 (42.0%); ScanTitan’s selection of 18 CWEs | CISA KEV feed, counted by ScanTitan |
| Basic Web Application Attacks pattern | 2,281 confirmed breaches; 10% of breaches | 2026 DBIR (2025 data) | 18% in the previous report, 9% in 2024 | Verizon 2026 DBIR |
| Actions inside that pattern | Stolen credentials 56%; exploited vulnerabilities 53% | 2026 DBIR, n=2,193 breaches | A breach can involve several actions | Verizon 2026 DBIR, p. 54 |
| Initial access vector | Exploitation 31%; credential abuse 13% | 2026 DBIR | Exploitation is now the leading vector | Verizon 2026 DBIR Executive Summary |
| KEV vulnerabilities fully remediated | 26%; median 43 days | 2025 | 38% and 32 days in the prior dataset | Verizon 2026 DBIR Executive Summary |
| Average breach cost, public-facing application exploitation | $4.68M | Breaches Mar 2025 to Feb 2026 | Lowest of the 8 initial vectors IBM charts; global average $4.99M | IBM Cost of a Data Breach 2026 |
| Mean time to exploit | −7 days (estimate) | 2025 investigations | Exploits were 32% of intrusions | Google Cloud, M-Trends 2026 |
| Web attacks counted by Akamai | 311 billion | 2024 | Up 33%; vendor-only | Akamai |
| API attacks per enterprise per day | 258 | 2025 | Up 113% from 121; vendor-only | Akamai 2026 report |
Methodology: What Counts as a Web Application Attack?
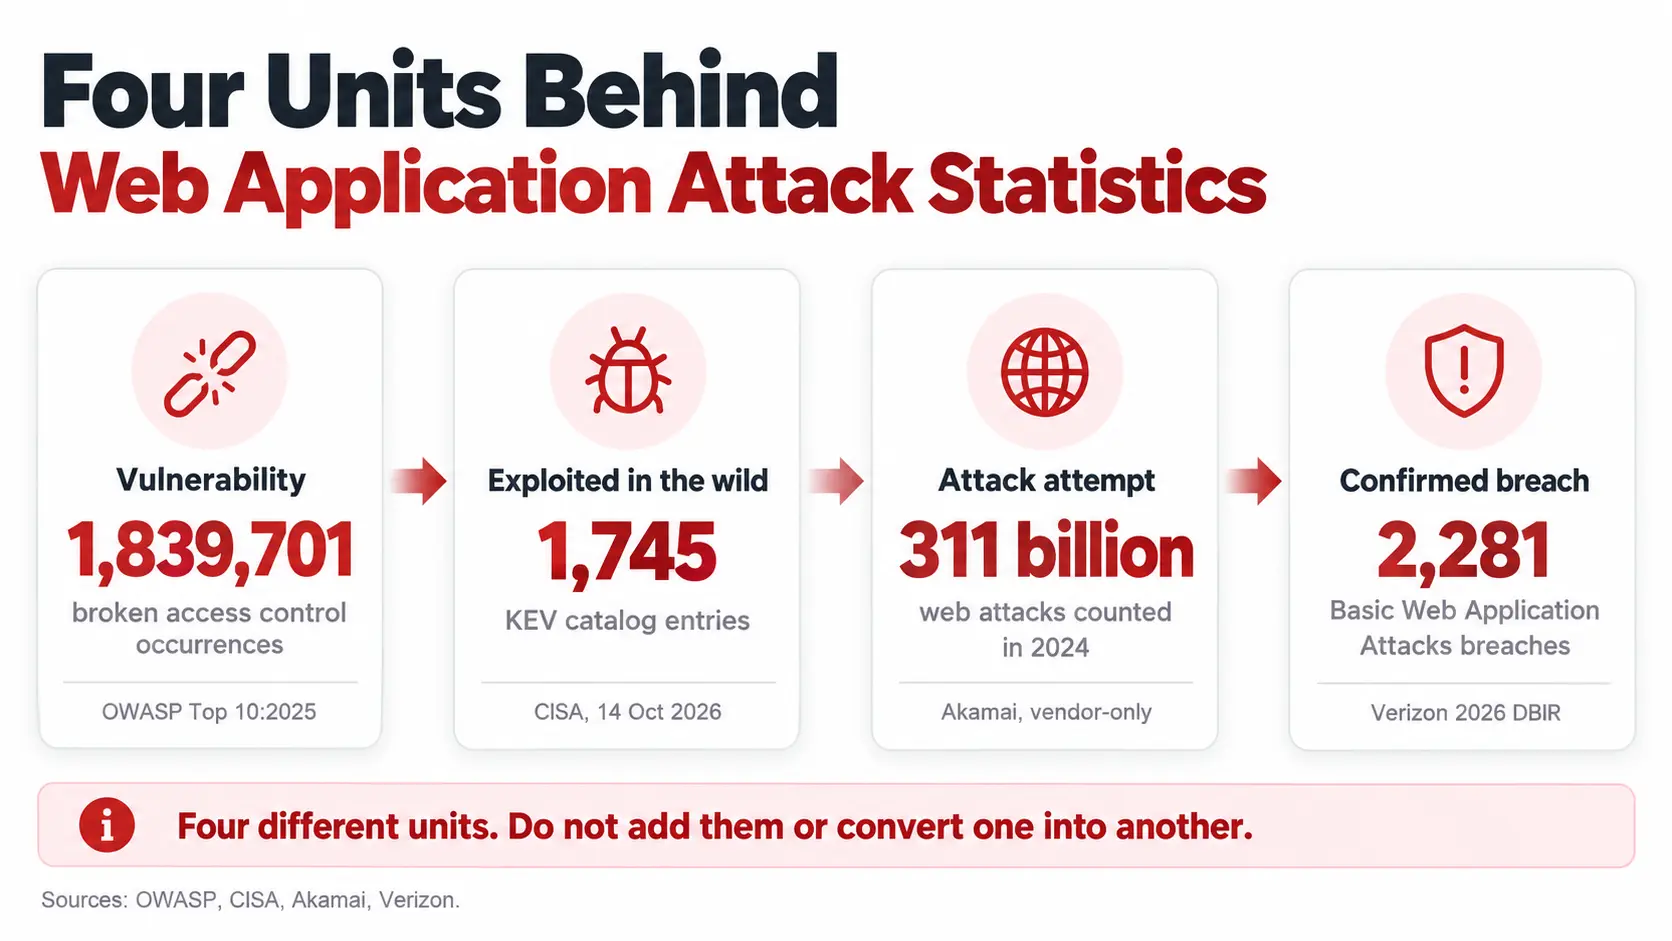
“Web application attack” is used for four different measurements. Each answers a different question, comes from a different kind of source, and can be wrong in a different way.
| Unit | What it counts | Example 2026 figure | Source type | What it cannot tell you |
|---|---|---|---|---|
| Vulnerability | Weaknesses found in tested applications or published as CVEs | 1,839,701 broken access control occurrences (OWASP) | Contributed testing data | How many were exploited, or how many attacks occurred |
| Exploited in the wild | Vulnerabilities with evidence of real exploitation | 1,745 KEV entries; 633 tagged with a web weakness | CISA catalog | How many organizations were attacked |
| Attack attempt | Requests observed or blocked at the edge | 311 billion web attacks (Akamai, 2024) | Vendor telemetry | Breaches, or intent: blocked traffic includes bots and scans |
| Confirmed breach | Incidents with confirmed data disclosure | 2,281 Basic Web Application Attacks breaches (Verizon) | Contributed incident data | Prevalence beyond the contributor base |
Source confidence. OWASP’s rankings combine incidence rate (the share of tested applications with at least one instance of a weakness), coverage, exploit and impact scores from CVE data, and total occurrences; two of the ten categories were added by community survey. MITRE’s CWE Top 25 scores weaknesses by how often they appear in NVD records and their average CVSS severity. CISA’s catalog lists vulnerabilities with reliable evidence of exploitation, which is a floor, not a census. Verizon’s DBIR is a contributed corpus: its regional chapter says visibility depends on disclosure laws and where contributors work. Vendor telemetry (Akamai, Cloudflare, Edgescan) describes that vendor’s customers and tests.
Web Application Vulnerability Statistics: OWASP Top 10:2025
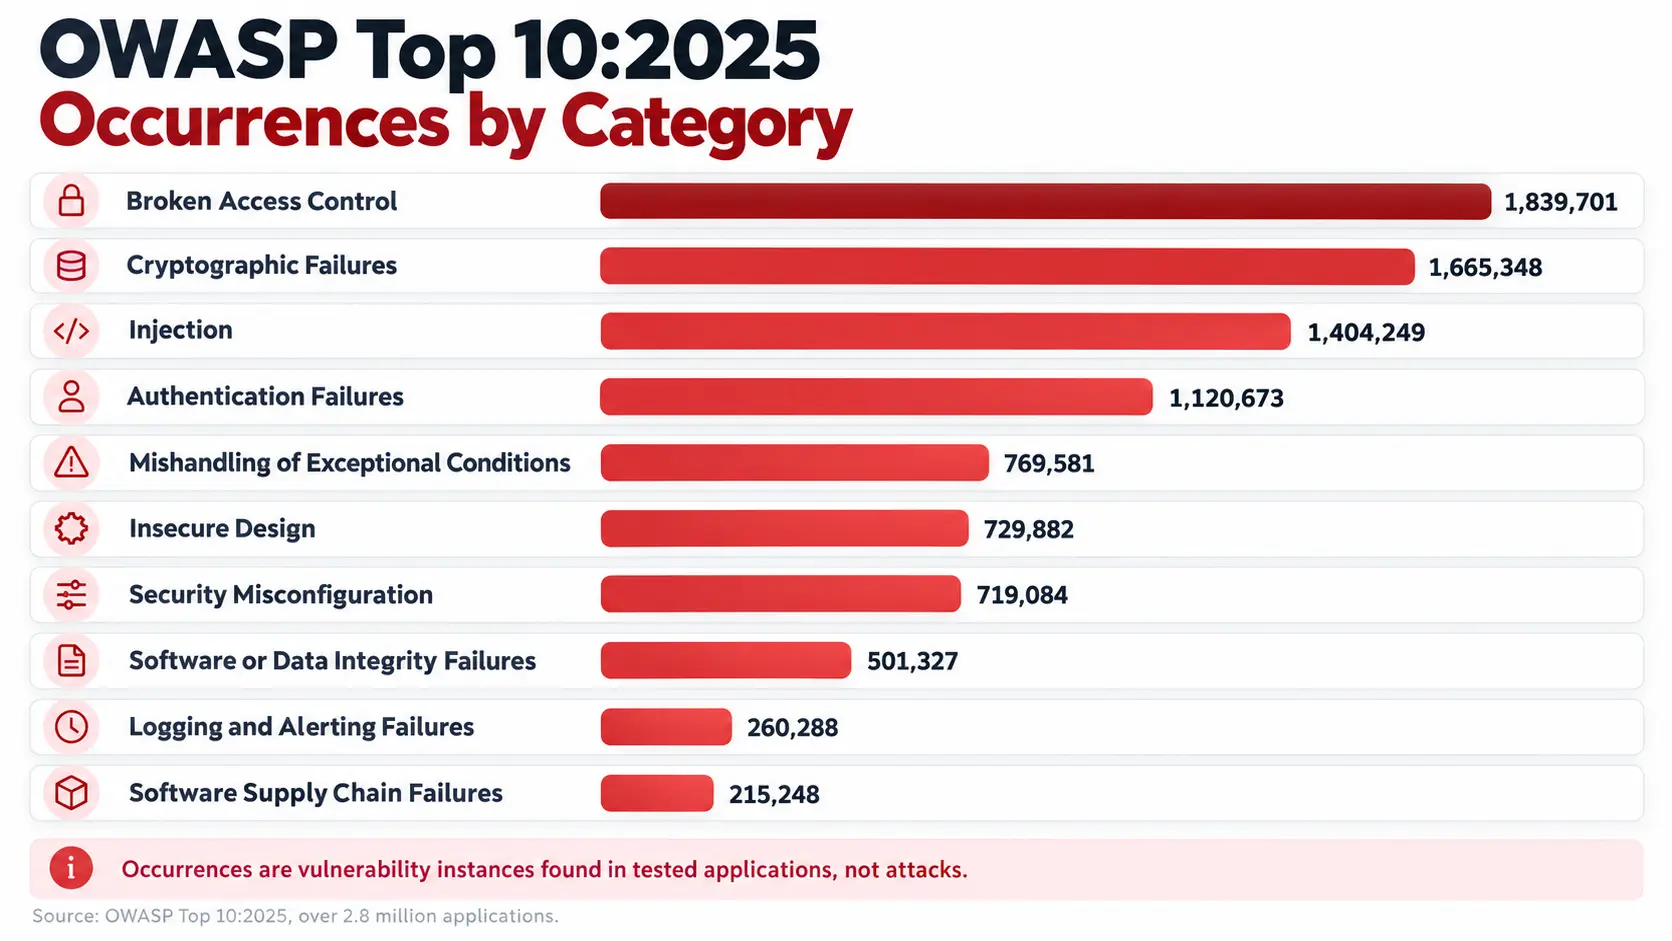
The OWASP Top 10:2025 draws on data from more than 2.8 million applications reported by contributors including Bugcrowd, Contrast Security, Semgrep, Sonar, Veracode and Wallarm. OWASP extracted about 220,000 CVEs from OWASP Dependency Check data, mapped about 175,000 of them to CWEs, and used them for exploit and impact scores.
Broken access control leads with 1,839,701 occurrences
A01:2025 Broken Access Control keeps first place with 1,839,701 occurrences, 32,654 mapped CVEs and 40 mapped CWEs. Its average incidence rate is 3.74% and its maximum is 20.15%. OWASP folds server-side request forgery (CWE-918) into this category; for how that attack works, see ScanTitan’s guide to server-side request forgery.
Injection maps to the most CVEs, 62,445
A05:2025 Injection has 62,445 mapped CVEs, the most of any category, across 37 CWEs. OWASP puts cross-site scripting at more than 30,000 of them and SQL injection at more than 14,000. Injection has 1,404,249 occurrences, third by that measure, with an average incidence of 3.08%.
Security misconfiguration has the highest maximum incidence, 27.70%
A02:2025 Security Misconfiguration reaches a maximum incidence of 27.70%, the highest of the ten, though its average is 3.00%. It has 719,084 occurrences and 1,375 mapped CVEs.
Software supply chain failures have the fewest occurrences
A03:2025 Software Supply Chain Failures has 215,248 occurrences, the fewest, and only 11 mapped CVEs. OWASP ranks it third because it was top-ranked in the community survey, with exactly 50% of respondents placing it first, and because of its exploit and impact scores. Note that OWASP’s page gives the average incidence as 5.72% in its score table and 5.19% in its background text, so this report quotes neither. For the package, build-pipeline and dependency numbers behind this category, see ScanTitan’s software supply chain attack statistics.
Full OWASP Top 10:2025 data
| Category | Mapped CWEs | Max incidence | Avg incidence | Avg coverage | Occurrences | Mapped CVEs |
|---|---|---|---|---|---|---|
| A01 Broken Access Control | 40 | 20.15% | 3.74% | 42.93% | 1,839,701 | 32,654 |
| A02 Security Misconfiguration | 16 | 27.70% | 3.00% | 52.35% | 719,084 | 1,375 |
| A03 Software Supply Chain Failures | 6 | 9.56% | see note | 27.47% | 215,248 | 11 |
| A04 Cryptographic Failures | 32 | 13.77% | 3.80% | 47.74% | 1,665,348 | 2,185 |
| A05 Injection | 37 | 13.77% | 3.08% | 42.93% | 1,404,249 | 62,445 |
| A06 Insecure Design | 39 | 22.18% | 1.86% | 35.18% | 729,882 | 7,647 |
| A07 Authentication Failures | 36 | 15.80% | 2.92% | 37.14% | 1,120,673 | 7,147 |
| A08 Software or Data Integrity Failures | 14 | 8.98% | 2.75% | 45.49% | 501,327 | 3,331 |
| A09 Security Logging and Alerting Failures | 5 | 11.33% | 3.91% | 46.48% | 260,288 | 723 |
| A10 Mishandling of Exceptional Conditions | 24 | 20.67% | 2.95% | 37.95% | 769,581 | 3,416 |
Source: OWASP Top 10:2025 category pages, read 15 October 2026. A03’s average incidence is omitted because OWASP’s page gives two different values.
Why the three OWASP rankings differ
Sorted by occurrences, cryptographic failures is second. Sorted by CVEs, injection is first by a wide margin and cryptographic failures drops to seventh. Sorted by average incidence, security logging and alerting failures (3.91%) leads the categories whose average is unambiguous. OWASP’s own ranking blends incidence, coverage, exploit and impact and total occurrences, so no single column reproduces it.
CWE Top 25: Cross-Site Scripting and SQL Injection Still Lead
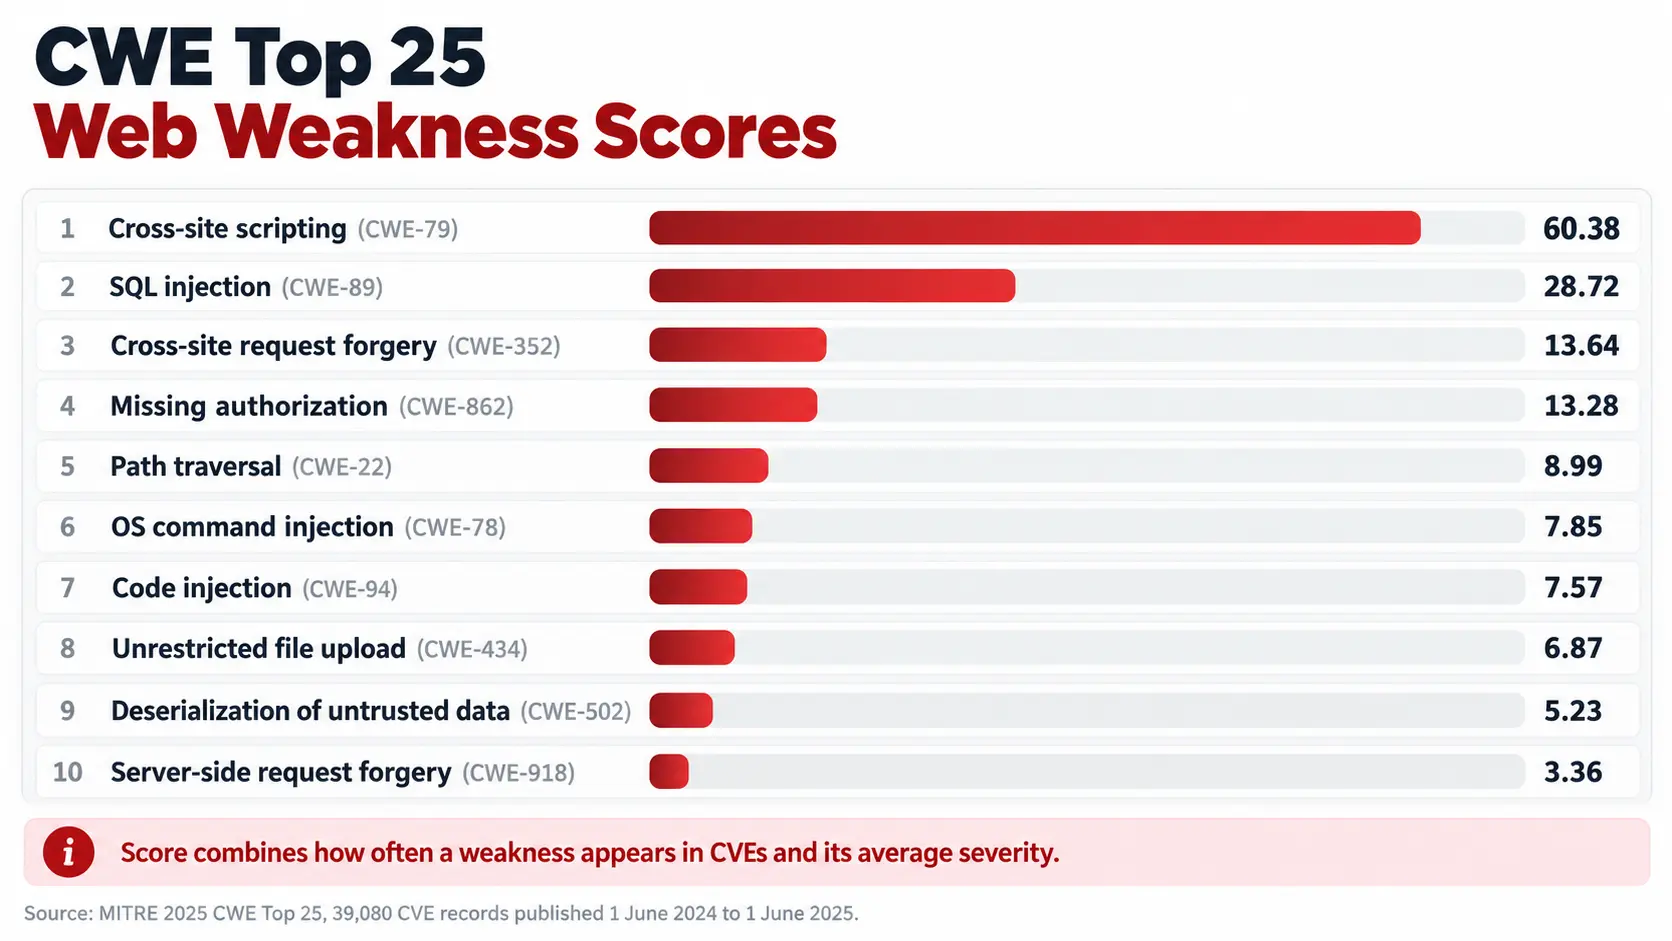
MITRE’s 2025 CWE Top 25 analyzed 39,080 CVE records published from 1 June 2024 to 1 June 2025. Its score multiplies how often a weakness is mapped to a CVE in the NVD by the average CVSS severity of those CVEs. The page reports a KEV count for each weakness alongside the score.
| Rank | CWE | Weakness | Score | KEV CVEs in window | Change vs 2024 |
|---|---|---|---|---|---|
| 1 | CWE-79 | Cross-site scripting | 60.38 | 7 | 0 |
| 2 | CWE-89 | SQL injection | 28.72 | 4 | +1 |
| 3 | CWE-352 | Cross-site request forgery | 13.64 | 0 | +1 |
| 4 | CWE-862 | Missing authorization | 13.28 | 0 | +5 |
| 6 | CWE-22 | Path traversal | 8.99 | 10 | −1 |
| 9 | CWE-78 | OS command injection | 7.85 | 20 | −2 |
| 10 | CWE-94 | Code injection | 7.57 | 7 | +1 |
| 12 | CWE-434 | Unrestricted file upload | 6.87 | 4 | −2 |
| 15 | CWE-502 | Deserialization of untrusted data | 5.23 | 11 | +1 |
| 22 | CWE-918 | Server-side request forgery | 3.36 | 0 | −3 |
| 23 | CWE-77 | Command injection | 3.15 | 2 | −10 |
| 24 | CWE-639 | Authorization bypass through user-controlled key | 2.62 | 0 | +6 |
Source: MITRE 2025 CWE Top 25 and methodology. Memory-safety weaknesses, such as out-of-bounds write at rank 5, are omitted because they are mostly not web application issues.
Three details matter for interpretation. Cross-site scripting leads the list on volume, but only 7 of its CVEs in this window were in the KEV catalog, so volume and exploitation point at different weaknesses. Cross-site request forgery is third with no KEV entries in the window. And authorization bypass through a user-controlled key, the weakness behind insecure direct object reference flaws, rose six places to 24th.
Exploited in the Wild: CISA KEV Entries by Web Weakness
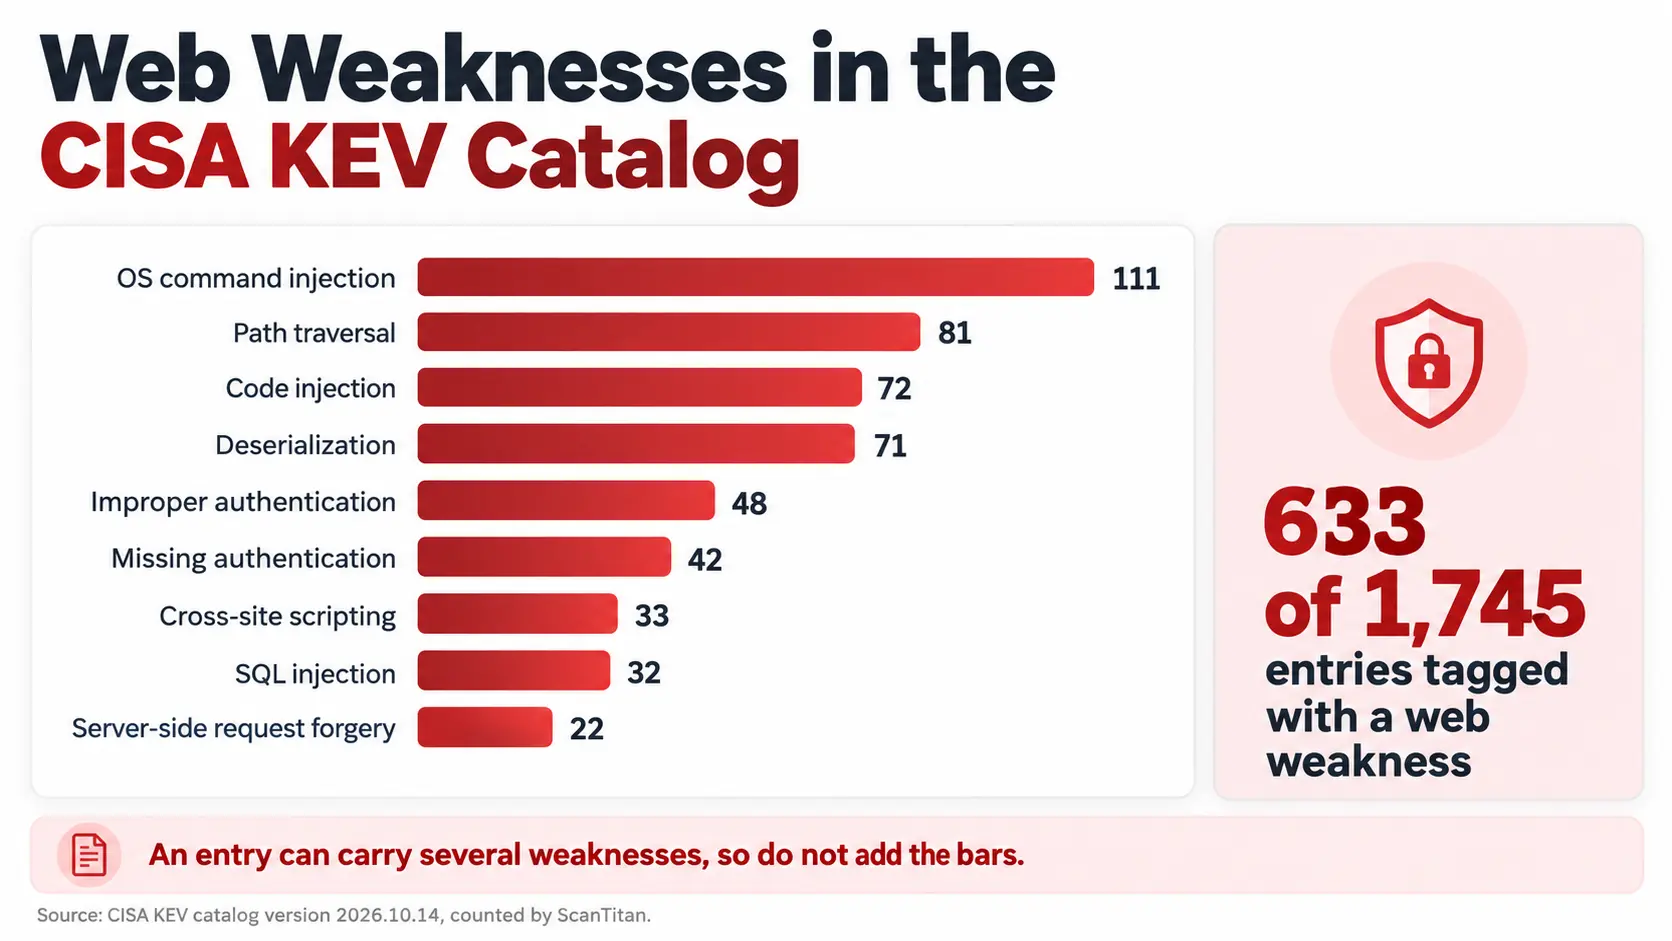
CISA’s Known Exploited Vulnerabilities catalog listed 1,745 entries in version 2026.10.14, released 14 October 2026. 261 were added in 2026 so far, more than the 245 added in all of 2025. Of the 1,745 entries, 361 (20.7%) are marked as used in ransomware campaigns, a figure that covers all weaknesses, not only web ones. ScanTitan counted the catalog’s CWE tags directly from CISA’s data feed.
| CWE | Weakness | KEV entries (all years) |
|---|---|---|
| CWE-78 | OS command injection | 111 |
| CWE-22 | Path traversal | 81 |
| CWE-94 | Code injection | 72 |
| CWE-502 | Deserialization of untrusted data | 71 |
| CWE-287 | Improper authentication | 48 |
| CWE-306 | Missing authentication for a critical function | 42 |
| CWE-284 | Improper access control | 37 |
| CWE-79 | Cross-site scripting | 33 |
| CWE-77 | Command injection | 33 |
| CWE-89 | SQL injection | 32 |
| CWE-434 | Unrestricted file upload | 23 |
| CWE-918 | Server-side request forgery | 22 |
| CWE-863 | Incorrect authorization | 18 |
| CWE-862 | Missing authorization | 12 |
| CWE-611 | XML external entity | 8 |
| CWE-352 | Cross-site request forgery | 6 |
| CWE-639 | Authorization bypass through user-controlled key | 1 |
| CWE-601 | Open redirect | 1 |
Counting rules: catalog version 2026.10.14; 1,570 of the 1,745 entries list at least one CWE; an entry can carry several CWEs, so the rows overlap and must not be summed; the list of 18 CWEs is ScanTitan’s selection of web-relevant weaknesses. Entries with at least one of those CWEs number 633, or 36% of the catalog.
By year, the web-tagged share of additions rose from 42.0% (103 of 245) in 2025 to 48.7% (127 of 261) in 2026. OS command injection is the most frequent of the 18 web-relevant weaknesses counted here; for how it works, see ScanTitan’s guide to OS command injection. For the wider KEV and CVE picture, see ScanTitan’s vulnerability statistics.
Web Application Attack Statistics by Year
No single source tracks web application attacks across years, so this section shows three separate series. They share a calendar, not a unit.
Exploited vulnerabilities added to CISA’s catalog, by calendar year
| Year | KEV entries added |
|---|---|
| 2021 | 311 |
| 2022 | 555 |
| 2023 | 187 |
| 2024 | 186 |
| 2025 | 245 |
| 2026 (to 14 Oct) | 261 |
Basic Web Application Attacks as a share of confirmed breaches, by DBIR edition
| DBIR edition | Share of breaches |
|---|---|
| 2024 | 9% |
| 2025 | 18% |
| 2026 | 10% |
Akamai web attack counts (vendor-only)
| Report | Data year | Figure |
|---|---|---|
| State of Apps and API Security 2025 | 2024 | 311 billion web attacks, up 33% year over year |
| State of the Internet 2026 | 2025 | 258 API attacks per enterprise per day, up 113% from 121 in 2024 |
The DBIR share fell from 18% to 10% in the same edition in which exploitation of vulnerabilities, as an action, doubled to 32% of all breaches from 18%. Verizon’s own reading is that the pattern is trending down in favor of the more complicated System Intrusion pattern, which suggests either that defenders are raising the bar or that attackers use their initial access for more complex objectives.
Confirmed Breaches: What the DBIR Shows About Web Application Attacks
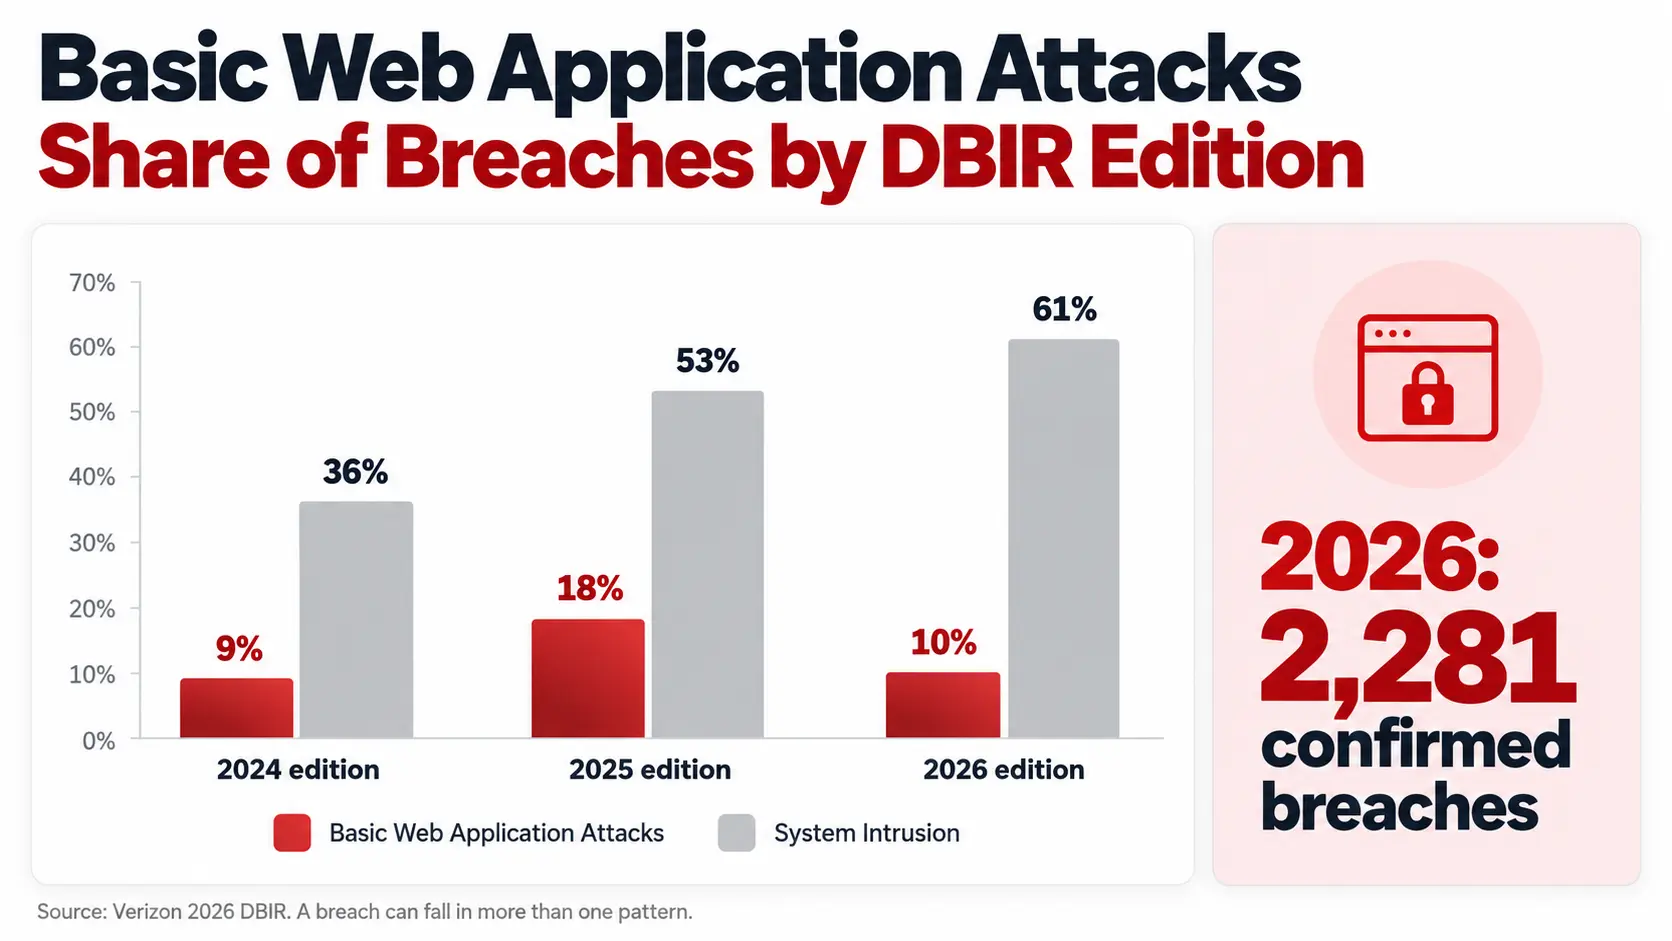
Verizon’s 2026 DBIR covers more than 31,000 incidents and more than 22,000 confirmed breaches in 145 countries; the pattern figures use a dataset of 22,624 breaches. Its Basic Web Application Attacks pattern, described as the “door left open” end of the attack spectrum, covers 3,217 incidents, 2,281 with confirmed data disclosure.
Basic Web Application Attacks are 10% of breaches, down from 18%
Across the three most recent editions, the pattern’s share of breaches was 9%, 18% and 10%, while System Intrusion rose from 36% to 53% to 61%.
| Pattern | 2026 edition | 2025 edition | 2024 edition |
|---|---|---|---|
| System Intrusion | 61% | 53% | 36% |
| Social Engineering | 17% | 17% | 22% |
| Basic Web Application Attacks | 10% | 18% | 9% |
| Miscellaneous Errors | 8% | 12% | 25% |
| Privilege Misuse | 3% | 7% | 8% |
Source: Verizon 2026 DBIR Executive Summary. The 2025 column sums to 107%, so patterns are not mutually exclusive.
Stolen credentials 56%, exploited vulnerabilities 53%
Inside the pattern, the top actions in the 2,193 analyzed breaches were:
| Action | Share of pattern breaches |
|---|---|
| Use of stolen credentials | 56% |
| Exploit vulnerability | 53% |
| Other | 30% |
| Password dumper | 21% |
| Brute force | 19% |
| Backdoor or C2 | 17% |
Threat actors were external in 100% of these breaches. Motives were financial in 74%, espionage in 23% and ideology in 3%. Credentials were compromised in 52% of the breaches, internal data in 48%, other data in 33% and secrets in 15%. A breach can involve several actions, so the shares overlap.
Five measures of “exploitation,” five denominators
Exploitation appears in at least five figures from three publishers. They are not interchangeable:
| Figure | Share | What it measures | Denominator |
|---|---|---|---|
| Initial access vector: exploitation of vulnerabilities | 31% | How attackers first got in | Known initial access vectors in non-error, non-misuse breaches (n=19,905) |
| Action: exploitation of vulnerabilities | 32% | Whether exploitation occurred anywhere in the breach | All breaches (n=22,624), up from 18% |
| Exploit vulnerability inside Basic Web Application Attacks | 53% | Actions in one pattern | 2,193 pattern breaches |
| IBM X-Force: vulnerability exploitation | 40% | IBM’s leading cause of attacks in 2025 | Incidents X-Force observed |
| Mandiant: exploits as initial infection vector | 32% | Intrusions Mandiant investigated | Mandiant’s 2025 investigations |
Sources: Verizon 2026 DBIR; IBM X-Force 2026 release; Google Cloud, M-Trends 2026. IBM separately reports a 44% increase in attacks that began with exploitation of public-facing applications; that is a growth rate, not a share.
Initial access: exploitation 31%, credential abuse 13%
Exploitation of vulnerabilities is now the most common initial access vector in the DBIR, rising to 31% while credential abuse, the previous leader, fell to 13%. The use of stolen credentials as an action held steady at 36% of all breaches, which is why credentials still matter inside breaches even as exploitation leads on entry.
Web Application Attack Statistics by Industry and Company Size
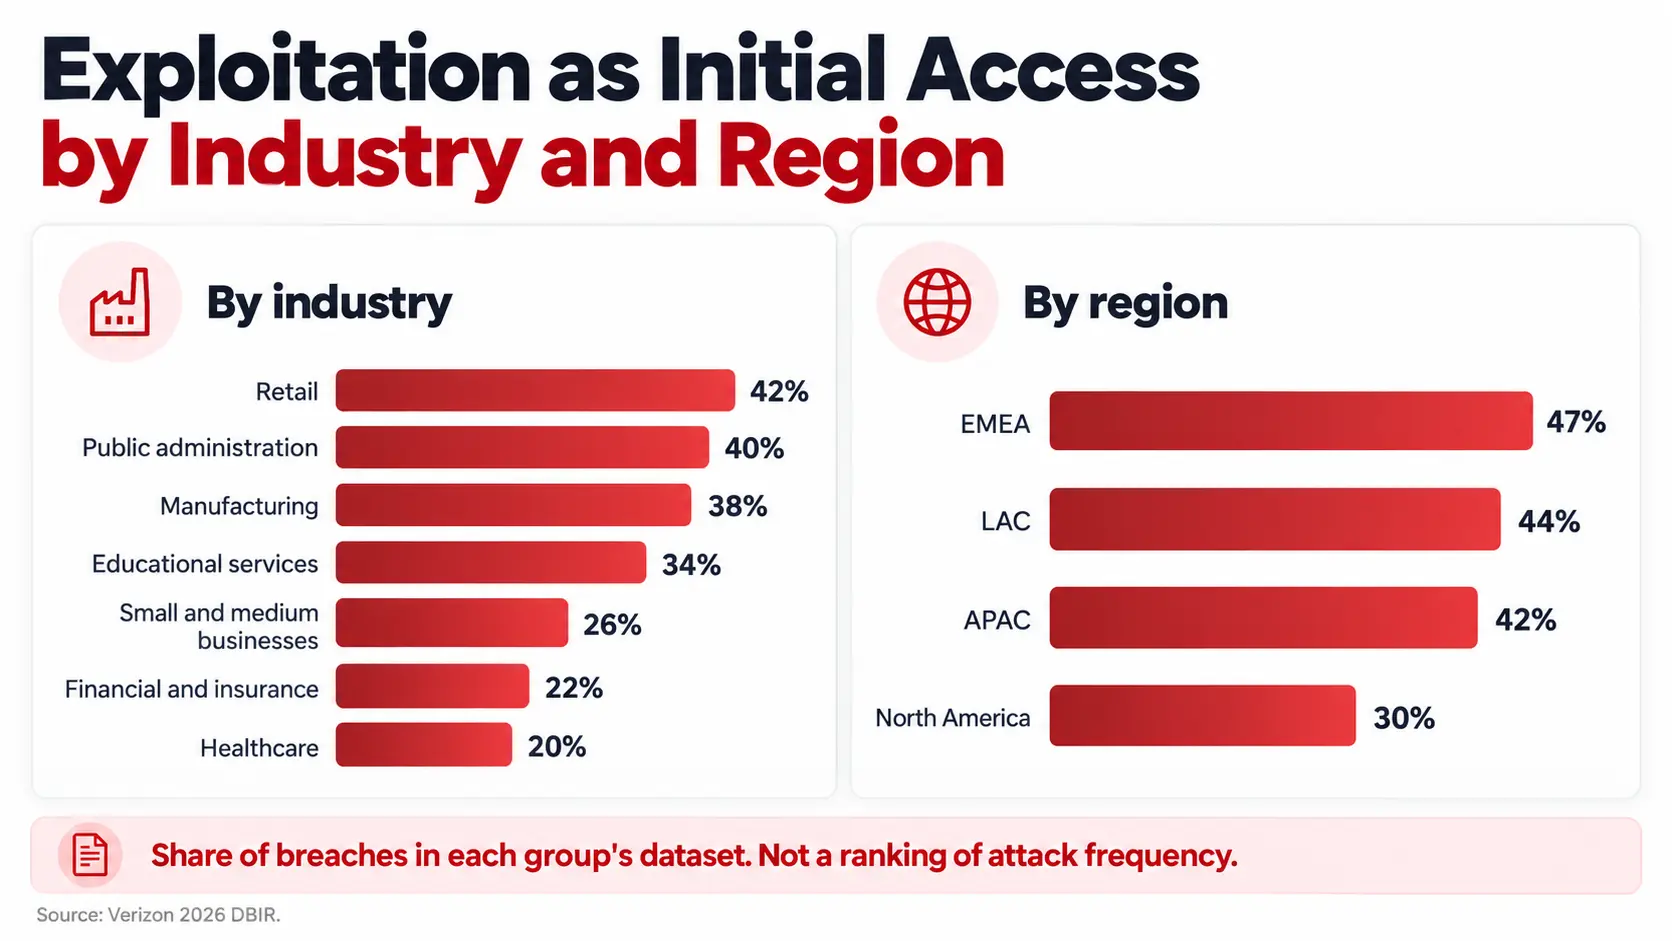
Exploitation of vulnerabilities as an initial access vector varies widely by industry.
| Industry (DBIR 2026) | Exploitation as initial access |
|---|---|
| Retail | 42% |
| Public administration | 40% |
| Manufacturing | 38% |
| Educational services | 34% |
| Small and medium-sized businesses | 26% |
| Financial and insurance | 22% |
| Healthcare | 20% |
Source: Verizon 2026 DBIR Executive Summary. Each share is within that industry’s breach dataset.
Basic Web Application Attacks sit among the three leading patterns, together with System Intrusion and Social Engineering, for retail (95% of breaches), manufacturing (91%) and small and medium-sized businesses (100%). In public administration the pattern dropped out of the top group this year, and in healthcare and education it is not in the top three.
Web Application Attack Statistics by Region
Verizon splits its 2026 dataset into four regions. Regional shares reflect who contributes data, not only where attacks occur.
| Region | Incidents (confirmed breaches) | Exploitation as initial access | Credential abuse | Phishing |
|---|---|---|---|---|
| APAC | 5,229 (2,855) | 42% | 25% | 15% |
| EMEA | 8,245 (6,060) | 47% | 6% | 28% |
| LAC | 813 (718) | 44% | 5% | 20% |
| North America | 12,371 (8,426) | 30% | 20% | 12% |
Source: Verizon 2026 DBIR, Table 5. In APAC, Basic Web Application Attacks doubled from the previous report to 22% of breaches. In EMEA the top three patterns are System Intrusion, Social Engineering and Miscellaneous Errors, so the pattern is outside the leading group there.
Akamai’s vendor-only telemetry shows the same regional unevenness in attack volume: in Asia-Pacific and Japan, web attacks rose 73% from 29 billion in 2023 to 51 billion in 2024, and in EMEA 37% of 116 billion web attacks targeted APIs. These are counts of attack attempts against Akamai’s customers.
Attack Traffic Statistics (Vendor-Only)
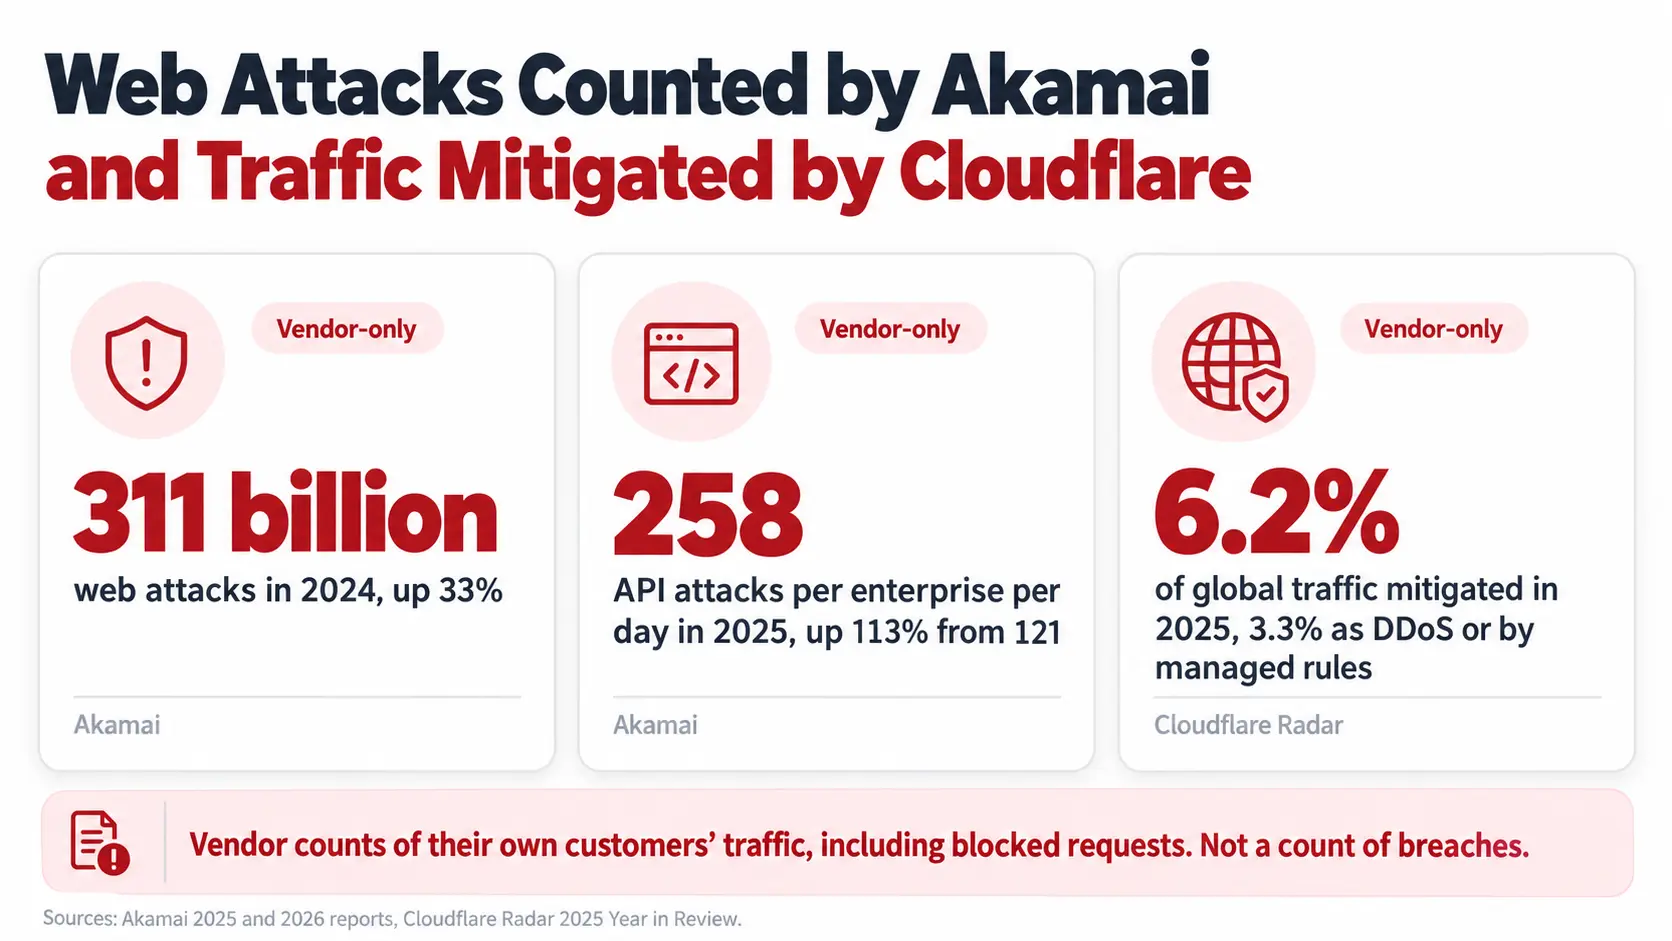
Edge vendors see requests, not breaches. These figures describe their own customer traffic, include blocked and automated requests, and are not a census of the internet.
Akamai, State of Apps and API Security 2025 (2024 data). Akamai reported 311 billion web attacks in 2024, up 33% year over year. Web attacks rose 65% between Q1 2023 and Q4 2024, from 14 billion to more than 29 billion, and Layer 7 DDoS attacks grew 94%, from just over 500 billion to more than 1.1 trillion monthly. Commerce was the most attacked industry, with more than 230 billion web attacks, nearly triple the count for high technology. Akamai also documented 150 billion API attacks from January 2023 through December 2024.
Cloudflare Radar 2025 Year in Review (1 January to 2 December 2025). 6.2% of global traffic on Cloudflare’s network was mitigated, a quarter of a point lower than 2024, and 3.3% was mitigated as a DDoS attack or by managed rules. Cloudflare notes that “mitigated” includes traffic customers chose to block for non-security reasons, so 6.2% is not an attack rate.
Web Application vs API Attacks
APIs are the fastest-growing part of the attack telemetry. Akamai’s 2026 report says the average number of API attacks per enterprise per day was 258 in 2025, up 113% from 121 in 2024, and that about 61% of API attacks in 2025 involved unauthorized workflows and abnormal activity, up from 30% in 2024. Akamai describes APIs as the dominant attack surface for modern enterprises; that is the vendor’s conclusion from its customers’ traffic.
| Measure | Web applications | APIs | Source |
|---|---|---|---|
| Attack volume, 2024 | 311 billion web attacks (Akamai’s count) | 150 billion API attacks, January 2023 to December 2024 | Akamai 2025 report |
| Growth in attack volume | 65%, Q1 2023 to Q4 2024 | 113% in average daily API attacks per enterprise, 2024 to 2025 | Akamai 2025 and 2026 reports |
| Regional note | APJ web attacks up 73% | 37% of 116 billion EMEA web attacks targeted APIs | Akamai 2025 report |
| Attack character | Mostly known web attack vectors | 61% unauthorized workflows and abnormal activity | Akamai 2026 report |
The two periods do not line up: the 150 billion API figure covers 24 months, while the 311 billion web figure covers 2024 alone, so do not subtract one from the other. For the API-specific risk list, see ScanTitan’s guide to the OWASP API Security Top 10.
Time to Exploit vs Time to Patch
| Measure | Figure | Period | Source |
|---|---|---|---|
| Mean time to exploit | −7 days (estimate) | 2025 investigations | Mandiant M-Trends 2026 |
| Exploits as share of intrusions | 32% | 2025 investigations | Mandiant M-Trends 2026 |
| KEV vulnerabilities fully remediated | 26% (38% before) | 2025 | Verizon 2026 DBIR |
| Median time to full KEV remediation | 43 days (32 before) | 2025, 13,000+ organizations | Verizon 2026 DBIR |
| Critical vulnerabilities to patch in the median case | 50% more than the prior dataset | 2025 | Verizon 2026 DBIR |
| Attacks beginning with public-facing application exploitation | +44% | 2025 | IBM X-Force 2026 |
| Average mean time to remediate | 54.81 days | 2025 assessments | Edgescan (vendor-only) |
Sources: Mandiant; Verizon; IBM; Edgescan.
A negative mean time to exploit means exploitation typically begins before a patch is released. Mandiant calls it an estimate, based on its own 2025 investigations. The population behind each row differs, so each figure is meaningful only against its own baseline. Prioritizing by exploitation evidence rather than raw severity is the practical consequence; ScanTitan’s CVE priority checker is built for that kind of triage.
IBM adds a cost angle: in its 2026 report, breaches that began by exploiting a public-facing application averaged $4.68 million, the lowest of the eight initial attack vectors it charts and below the $4.99 million global average. IBM’s study covers 602 breached organizations, with breaches between March 2025 and February 2026.
Notable Incident: MOVEit Transfer SQL Injection
CISA’s advisory AA23-158A, published 7 June 2023 and updated 16 June 2023, describes the MOVEit Transfer compromise as exploitation of a previously unknown SQL injection vulnerability, tracked as CVE-2023-34362. Per open-source information cited by CISA, the CL0P ransomware group, also known as TA505, began exploiting it on 27 May 2023. The group dropped a web shell first seen as human2.aspx, named to look like the legitimate human.aspx file in MOVEit Transfer, and CISA calls the malware LEMURLOOT.
CISA’s advisory gives no victim count for the MOVEit campaign, and this report does not quote one. Larger totals for affected organizations and individuals circulate elsewhere, but they do not come from CISA and this report does not quote them. A victim count is a different unit from the vulnerability and the attack, and should always name its source.
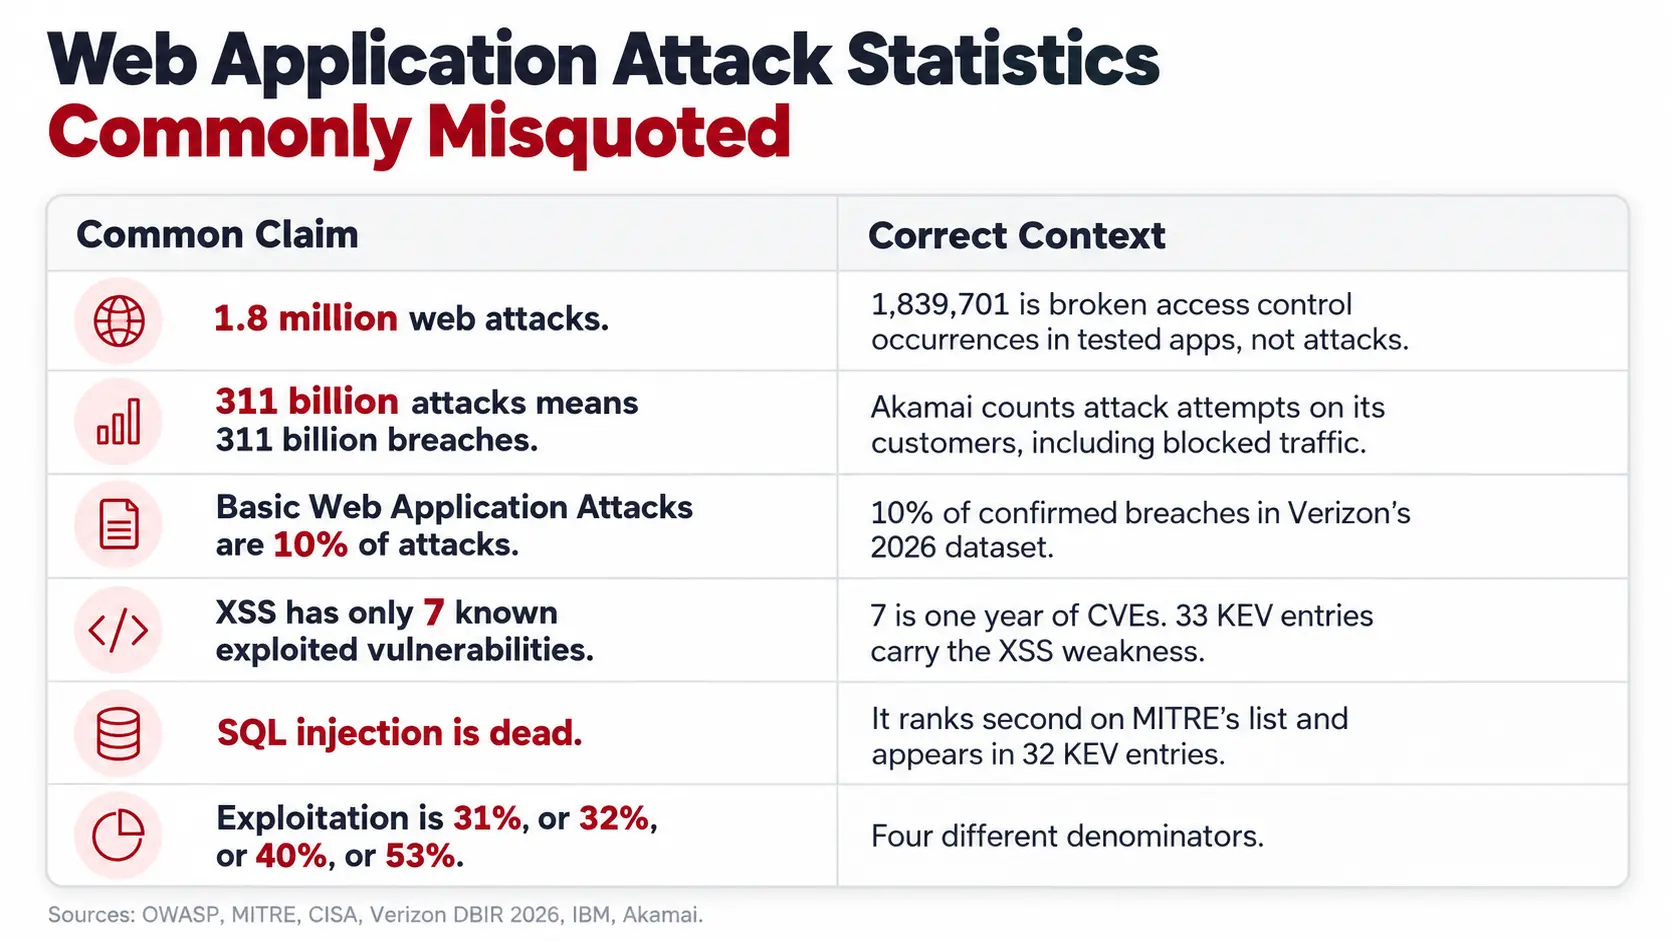
Web Application Attack Statistics Commonly Misquoted
| Common claim | Correct context |
|---|---|
| “OWASP found 1.8 million web attacks.” | 1,839,701 is the number of broken access control occurrences found in tested applications. It counts vulnerability instances, not attacks. |
| “311 billion web attacks means 311 billion breaches.” | Akamai counts web attacks against its customers in 2024, including blocked and automated traffic. Verizon counted 2,281 confirmed Basic Web Application Attacks breaches in its dataset. |
| “Basic Web Application Attacks are 10% of attacks.” | 10% is the pattern’s share of confirmed breaches in Verizon’s 2026 dataset, not of attacks. It was 18% in the 2025 edition. |
| “Cross-site scripting has only 7 known exploited vulnerabilities.” | 7 is MITRE’s count for CVEs published 1 June 2024 to 1 June 2025. Across the whole CISA catalog, 33 entries carry the cross-site scripting weakness. |
| “SQL injection is dead.” | It is second on MITRE’s 2025 list (score 28.72), has more than 14,000 CVEs in OWASP’s injection data, and appears in 32 CISA KEV entries. |
| “Exploitation is 31%, or 32%, or 40%, or 53%.” | These are four different denominators: initial access vector, any action in a breach, IBM’s incidents, and actions inside one pattern. |
| “IBM says 40% of incidents were public-facing application exploits.” | IBM’s release says vulnerability exploitation caused 40% of incidents X-Force observed in 2025; it separately reports a 44% rise in attacks that began with exploitation of public-facing applications. |
| “80% of cyber incidents are web application attacks.” | We found no primary 2026 source for this. The verified figure for the Basic Web Application Attacks pattern is 10% of breaches, and definitions of “web application” differ by dataset. |
What the Numbers Mean for a Lean Team
For a small team, the data points to four priorities. First, authorization: broken access control tops OWASP, missing authorization rose five places in the CWE Top 25 to fourth, and these flaws appear only when someone tests who can do what. Second, credentials: stolen credentials were used in 56% of Basic Web Application Attacks breaches, so strong authentication and rapid credential revocation matter as much as patching. Third, exploitation evidence: only 26% of CISA KEV vulnerabilities were fully remediated, and exploitation often begins before a patch, so internet-facing software should be patched by whether it is being exploited, not by label. Fourth, visibility: you cannot fix web flaws you have not found.
ScanTitan’s website vulnerability scanner checks internet-facing sites for known weaknesses. It does not replace authenticated testing of access control, code review, or patch management, and none of the figures in this report depend on any ScanTitan product.
How We Compiled and Verified These Statistics
Every figure was checked against the named source on 15 October 2026. OWASP figures come from each category page. The CWE Top 25 table was read from MITRE. The KEV counts were computed by ScanTitan from CISA’s published data feed (version 2026.10.14); the list of web-relevant CWEs is ScanTitan’s selection, shown in full in the KEV section. The DBIR figures come from the full 2026 report (pattern page 54, regional chapter page 100) and the executive summary. Charts in the DBIR were read directly where the text did not give the value.
- Used: OWASP, MITRE, CISA, Verizon, IBM, Google Cloud (Mandiant), and vendor primary reports from Akamai, Cloudflare and Edgescan, labeled vendor-only.
- Excluded: secondary summaries, vendor marketing pages, and figures that could not be traced to a primary source, including claimed victim totals for MOVEit, the 80% share of incidents attributed to web applications, and several fix-time figures behind registration forms.
- Refresh: Reviewed every 90 days. KEV counts change monthly; OWASP, MITRE, Verizon and IBM update on their annual cycles.
How to cite this research. ScanTitan, “Web Application Attack Statistics 2026: Vulnerabilities, Attacks & Breaches,” 15 October 2026. For single figures, cite the primary source listed beside each number; cite the KEV class counts to this page with the catalog version date.
Primary Sources
- OWASP Top 10:2025 and its introduction and data summary
- OWASP category pages: A01, A02, A03, A04, A05, A06, A07, A08, A09, A10
- MITRE 2025 CWE Top 25 and methodology
- CISA Known Exploited Vulnerabilities catalog data feed
- CISA advisory AA23-158A, MOVEit Transfer
- Verizon 2026 Data Breach Investigations Report
- Verizon 2026 DBIR Executive Summary
- IBM Cost of a Data Breach Report 2026
- IBM 2026 X-Force Threat Intelligence Index release and IBM Think summary
- Google Cloud, M-Trends 2026
- Akamai, State of Apps and API Security 2025 press release and blog summary
- Akamai, Apps, APIs and DDoS 2026 report
- Cloudflare Radar 2025 Year in Review
- Edgescan 2026 Vulnerability Statistics Report summary
Frequently Asked Questions
What are the most common web application attacks?
By weakness volume, cross-site scripting (score 60.38) and SQL injection (28.72) lead MITRE’s 2025 CWE Top 25. Inside Verizon’s Basic Web Application Attacks breaches, the most common actions were use of stolen credentials (56%) and exploitation of vulnerabilities (53%).
How many web application attacks happen each year?
There is no census. Akamai counted 311 billion web attacks against its customers in 2024, up 33%, but that includes blocked and automated requests and is vendor-only.
What percentage of breaches involve web application attacks?
In Verizon’s 2026 DBIR, the Basic Web Application Attacks pattern was 10% of breaches, 2,281 confirmed breaches, down from 18% in the previous edition. The percentage depends on the definition, so check the denominator before quoting it.
What is the number one web application vulnerability?
Broken access control. It tops the OWASP Top 10:2025 with 1,839,701 occurrences, an average incidence of 3.74% and 32,654 mapped CVEs.
Is SQL injection still common?
Yes. It is second on MITRE’s 2025 CWE Top 25 with a score of 28.72, has more than 14,000 CVEs in OWASP’s injection data, and appears in 32 entries of CISA’s known-exploited catalog.
How fast do attackers exploit new web vulnerabilities?
Mandiant estimated a mean time to exploit of minus 7 days in 2025, meaning exploitation typically starts before a patch is available.
How long does it take to fix web application vulnerabilities?
Verizon found a median of 43 days to fully remediate CISA KEV vulnerabilities in 2025, with only 26% fully remediated. Edgescan reported an average mean time to remediate of 54.81 days from its 2025 assessments.
What is the difference between a vulnerability, an attack and a breach?
A vulnerability is a flaw, such as OWASP’s 1,839,701 broken access control occurrences. An attack is an attempt to exploit one, such as Akamai’s 311 billion counted web attacks. A breach is a confirmed data compromise, such as Verizon’s 2,281 Basic Web Application Attacks breaches.
How many web application vulnerabilities are in the CISA KEV catalog?
Of 1,745 entries in version 2026.10.14, ScanTitan counted 633 (36%) that carry at least one of 18 web-relevant weaknesses. Entries can carry several CWEs, so the counts by weakness overlap.
How much does a web application breach cost?
IBM’s 2026 report put the average cost of breaches that began with exploitation of a public-facing application at $4.68 million, the lowest of its eight initial vectors and below the $4.99 million global average.
How fast are API attacks growing?
Akamai reported an average of 258 API attacks per enterprise per day in 2025, up 113% from 121 in 2024, and that 61% of API attacks involved unauthorized workflows and abnormal activity. These are vendor-only figures.
Do most web application breaches start with stolen credentials?
Stolen credentials were used in 56% of Basic Web Application Attacks breaches, just ahead of exploited vulnerabilities at 53%. Across all breaches, exploitation of vulnerabilities (31%) now leads credential abuse (13%) as the initial access vector.