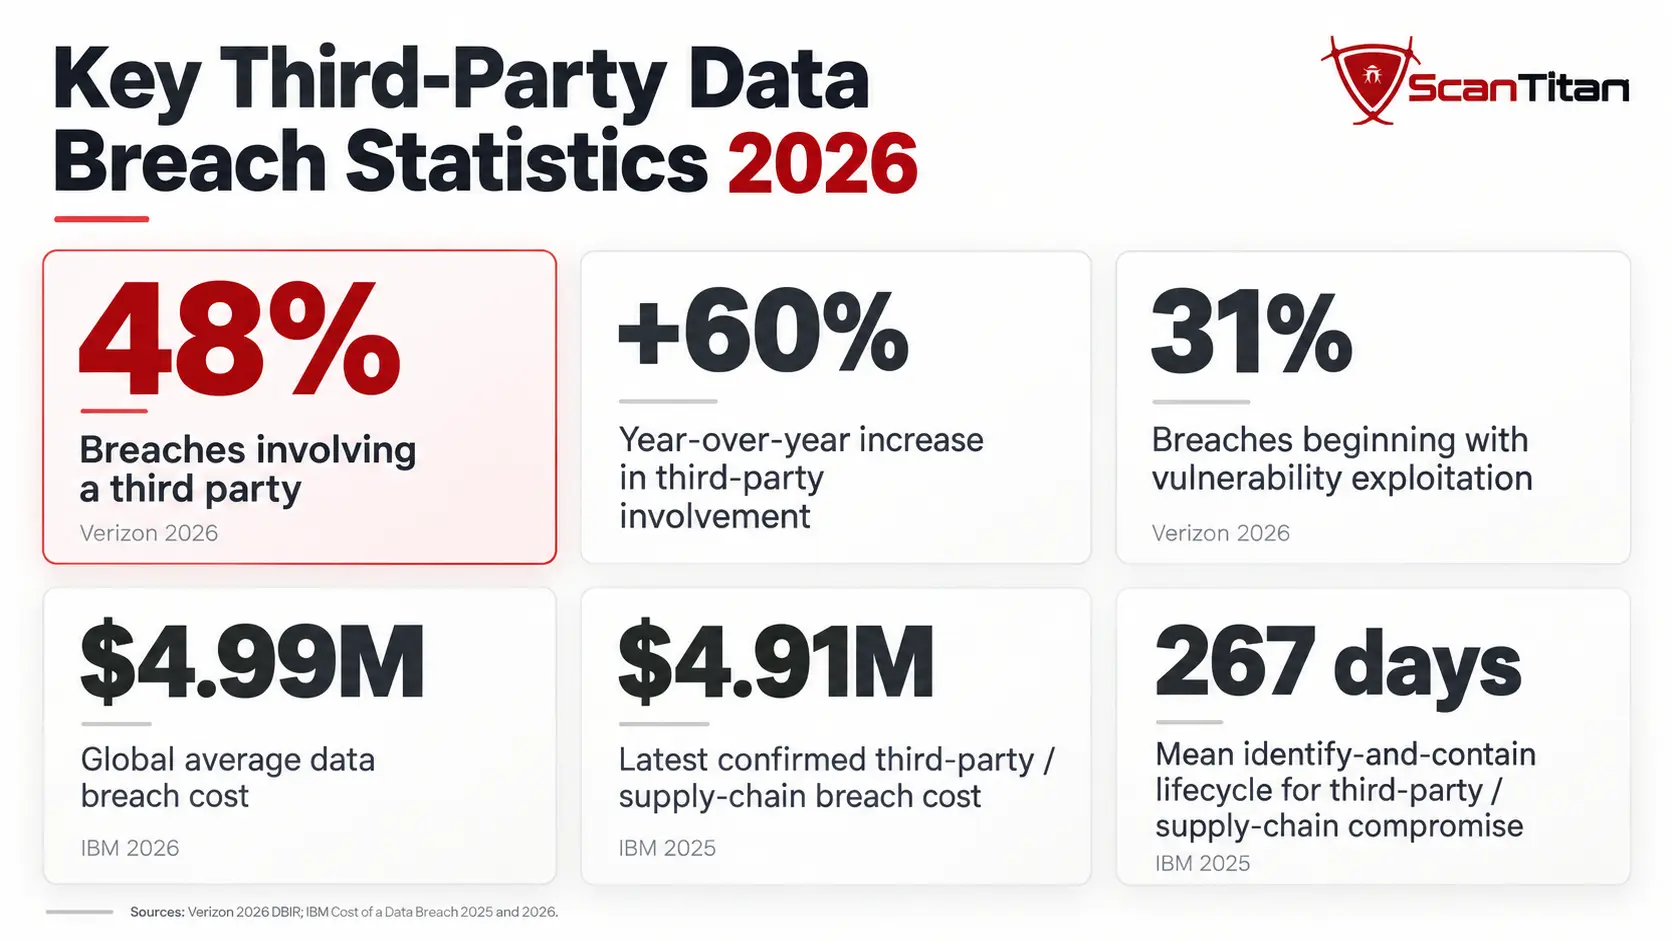
Third-party involvement reached 48% of breaches in Verizon’s 2026 Data Breach Investigations Report (DBIR), up from 30% in the previous edition. The change shows how often modern breaches now intersect with vendors, commercial software, SaaS platforms, cloud services, managed providers, APIs and other external dependencies.
Third-party risk is broader than the classic scenario of an attacker breaching a supplier and pivoting into a customer. It can also include vulnerable commercial software, compromised support systems, OAuth integrations, third-party JavaScript, data processors and other trusted connections. That distinction matters because a breach that involves a third party is not necessarily a breach that started inside the vendor’s network.
For that reason, this research keeps different measurement units separate: upstream compromises, downstream customer organizations, regulatory notices, affected individuals, malicious package detections and confirmed data breaches are not interchangeable. The goal is to show the scale of third-party exposure without inflating breach counts.
Research note
The Verizon DBIR is a contributed breach corpus, not a worldwide census. The 2026 edition covers incidents occurring from November 1, 2024 through October 31, 2025. Percentages in this article describe the relevant source dataset, not the probability that any individual organization will be breached.
Key Third-Party Data Breach Statistics for 2026
| Statistic | Value | Dataset / scope |
|---|---|---|
| Breaches involving a third party | 48% | Verizon 2026 DBIR |
| Third-party involvement in previous DBIR | 30% | Verizon 2025 DBIR |
| Third-party involvement in 2024 | 15% | Verizon 2024 DBIR |
| Vulnerability exploitation as initial access | 31% | Verizon 2026 global breach corpus |
| Credential abuse as initial access | 13% | Verizon 2026 global breach corpus |
| CISA KEV vulnerabilities fully remediated | 26% | Verizon 2026 remediation analysis |
| Median time to full vulnerability resolution | 43 days | Verizon 2026 remediation analysis |
| Global average data breach cost | $4.99M | IBM Cost of a Data Breach 2026 |
| Third-party vendor / supply-chain compromise cost | $4.91M | IBM Cost of a Data Breach 2025 |
| Third-party vendor / supply-chain lifecycle | 267 days | IBM 2025: 196 days to identify + 71 days to contain |
| Breaches linked to third-party access | 35.5% | SecurityScorecard analysis of 1,000 breaches from 2024 |
| Ransomware/extortion incidents with a third-party nexus | 41.4% | SecurityScorecard 2024 breach sample |
| New malicious open-source packages identified in 2025 | 454,600+ | Sonatype 2026 software supply-chain research |
How Common Are Third-Party Data Breaches?
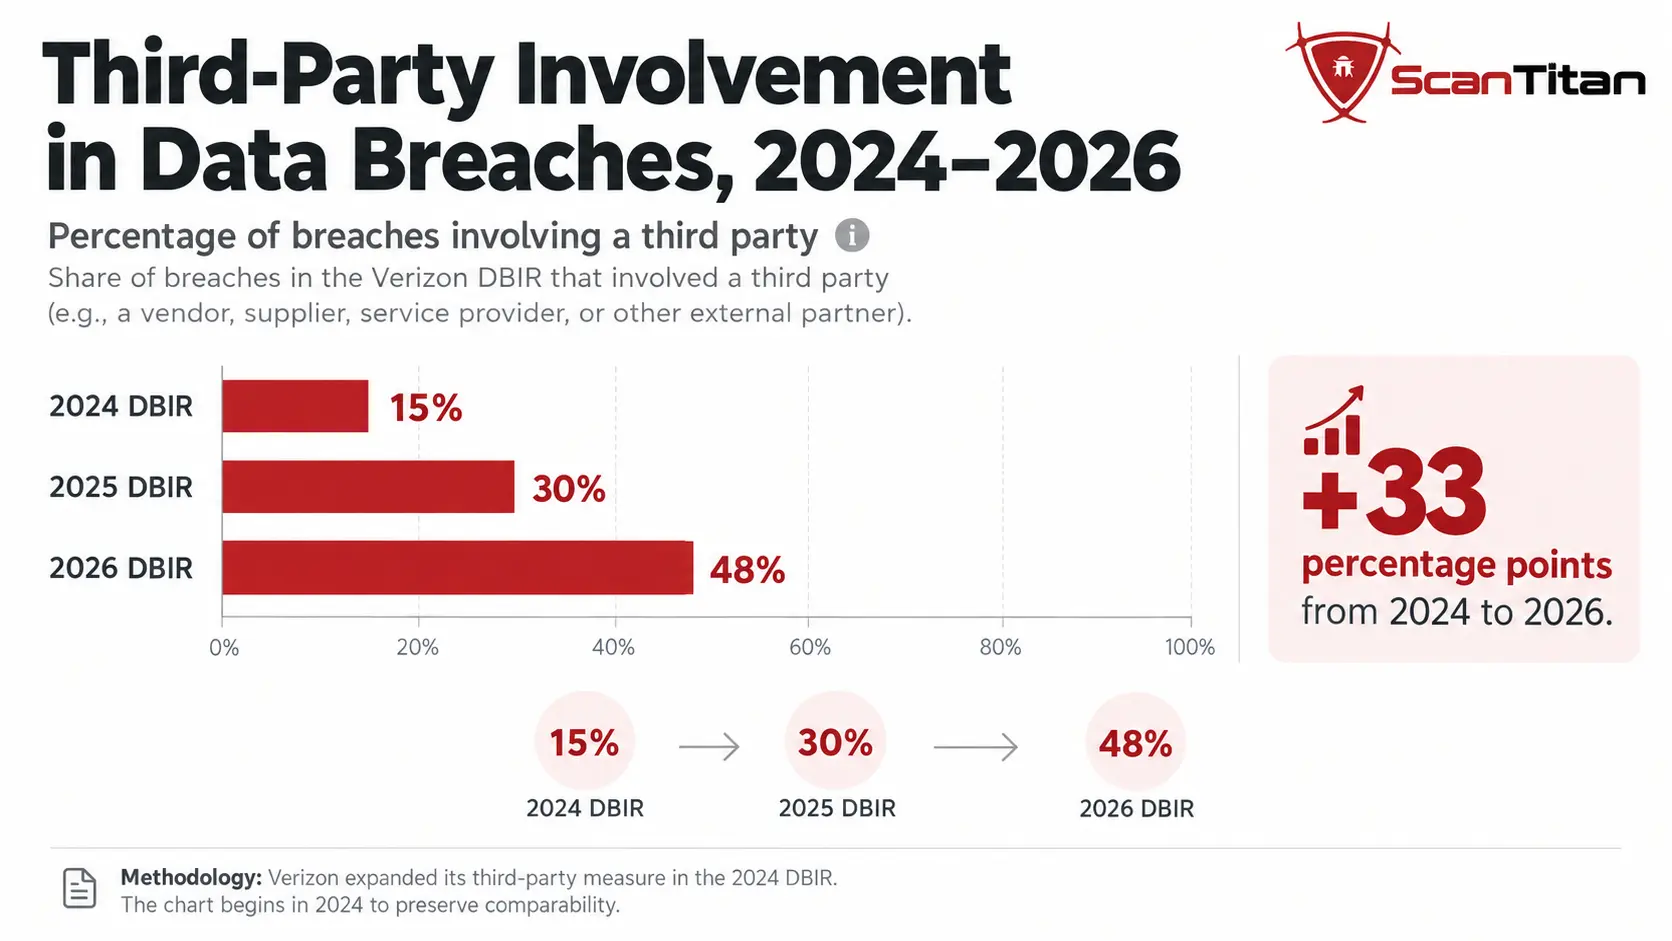
The clearest current baseline comes from Verizon: 48% of breaches in the 2026 DBIR involved a third party. Verizon says this represents a 60% increase from the previous dataset, when third-party involvement stood at 30%.
Third-Party Involvement Rose From 15% to 48%
| DBIR edition | Third-party involvement | Change |
|---|---|---|
| 2024 | 15% | Starting point for Verizon’s expanded third-party measure |
| 2025 | 30% | +15 percentage points |
| 2026 | 48% | +18 percentage points |
From 2024 to 2026, the published values increased by 33 percentage points. Expressed as a relative change, that is 220%: (48 − 15) ÷ 15 × 100. This is a ScanTitan calculation from Verizon’s published values, not a figure reported directly by Verizon.
Why we start the trend in 2024
Verizon’s 2024 DBIR described an expanded measure covering third parties and suppliers such as software supply chains, hosting-partner infrastructure and data custodians. Extending the same line backward without qualification risks implying a longer, perfectly comparable time series than the methodology supports.
For more general breach trends beyond third-party exposure, see ScanTitan’s Data Breach Statistics research.
Why SecurityScorecard Reports a Different Number
SecurityScorecard analyzed 1,000 breaches from 2024 and found 35.5% linked to third-party access. That is lower than Verizon’s 48%, but the two values should not be averaged or treated as conflicting answers. SecurityScorecard uses its own proprietary dataset and third-party nexus methodology, while Verizon’s third-party measure is broader and includes supply-chain relationships and third-party software involvement.
Why Are Third-Party Data Breaches Increasing?
The growth in third-party involvement is not explained by one attack technique. It reflects a broader structural change: organizations increasingly depend on software, infrastructure and identities they do not fully operate themselves.
More Organizations Depend on SaaS and External Services
Customer support platforms, payment providers, CRMs, analytics tools, file-transfer systems, cloud services and identity platforms often hold data or maintain persistent connections into customer environments. The more business processes depend on external platforms, the larger the number of trusted pathways that attackers can potentially abuse.
This is why third-party risk increasingly overlaps with website security, API security and external attack surface management rather than remaining only a procurement or compliance problem.
Vulnerable Commercial Software Creates Shared Exposure
Verizon’s 2026 DBIR found that 31% of breaches started with vulnerability exploitation, overtaking credential abuse as the leading known initial-access vector. The same report found only 26% of CISA Known Exploited Vulnerabilities were fully remediated in its observation period, while median full resolution increased to 43 days.
These are global breach and remediation metrics, not third-party-only percentages. However, they help explain why an internet-facing flaw in widely deployed commercial software can create shared exposure across many customers at once. This connection is particularly relevant to ScanTitan’s Vulnerability Statistics research.
Trusted Vendor Access Can Bypass the Traditional Perimeter
Vendors do not always need to exploit a flaw. They may already have VPN access, service accounts, support credentials, OAuth tokens or administrative permissions. If an attacker steals those credentials, the relationship the organization intentionally trusted becomes the route into the environment.
Concentration Risk Extends Beyond Direct Vendors
A direct supplier can depend on its own cloud host, identity provider, development tools and subcontractors. This creates fourth-party and nth-party dependencies. One upstream provider can therefore sit behind hundreds or thousands of organizations that do not have a direct contractual relationship with it.
Organization → Direct vendor → Vendor’s provider → Software / cloud / identity dependency
What Counts as a Third-Party Data Breach?
A third-party data breach broadly describes a breach in which an external vendor, service provider, supplier, software provider or integrated platform contributes to unauthorized access, exposure or theft of another organization’s data.
The external party can play several different roles:
- store or process the affected data;
- hold legitimate credentials into a customer environment;
- provide vulnerable commercial software;
- operate a SaaS integration or API;
- manage support or identity services;
- distribute code or updates used by downstream customers.
Third-Party Breach vs. Supply-Chain Attack
The terms overlap, but they are not identical. A vendor can be breached and lose customer data without the attacker ever entering the customer’s own environment. By contrast, a supply-chain attack usually abuses an upstream relationship or product to reach downstream targets.
| Scenario | What happens | How to classify it |
|---|---|---|
| Vendor data exposure | A processor is compromised and customer data stored there is stolen. | Third-party breach |
| Vendor credential abuse | Attacker uses a supplier’s legitimate account to access the customer’s environment. | Third-party access compromise |
| Malicious update | Attacker compromises software build/distribution and sends malicious code to customers. | Software supply-chain attack |
| Commercial software exploit | The same vulnerability in a widely deployed product is exploited across many customers. | Third-party software / supply-chain involvement |
| OAuth integration compromise | Stolen integration tokens provide downstream access to connected SaaS data. | SaaS third-party compromise |
Third-Party Involvement Is Not the Same as Third-Party Causation
48% third-party involvement ≠ 48% of breaches began inside a vendor network.
A third party may appear in the attack chain because its software was exploited, its credentials were abused, its service stored the affected data or its integration provided a trusted route into another platform.
This distinction is one of the main reasons statistics from Verizon, SecurityScorecard, IBM and regulatory datasets should not be collapsed into a single percentage.
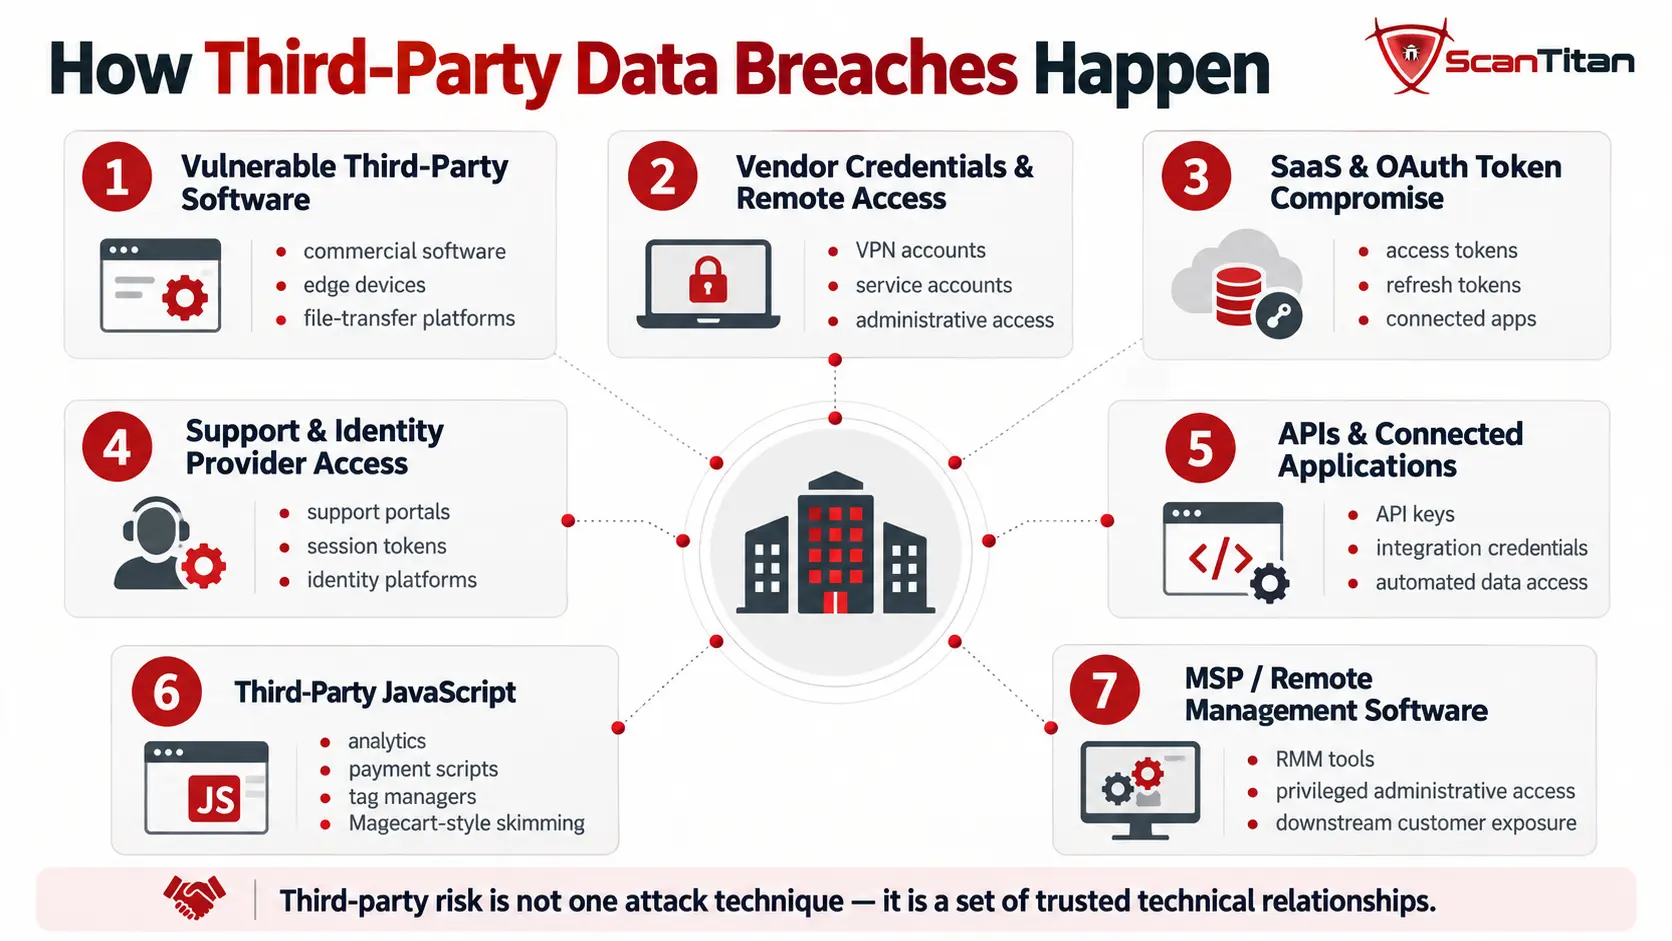
How Do Third-Party Data Breaches Happen?
Third-party breaches are best understood as a set of attack paths rather than one single technique.
1. Vulnerable Third-Party Software
Verizon’s 2026 DBIR reports 31% of breaches began with vulnerability exploitation, compared with 13% through credential abuse. Widely used file-transfer systems, VPNs, edge devices and commercial applications can turn a single vulnerability into a multi-organization exposure problem.
2. Compromised Vendor Credentials and Remote Access
The 2013 Target breach remains a classic example. A U.S. Senate staff analysis found that credentials associated with a third-party HVAC vendor were used as part of the attackers’ path into Target. The mechanism matters because the attacker did not need to create a completely new trust relationship; it abused one that already existed.
3. SaaS and OAuth Token Compromise
Connected SaaS applications can hold long-lived access and refresh tokens. In the 2025 Salesloft Drift incident, Salesforce said unusual activity through the Drift application could have resulted in unauthorized access to customer data and stated that the issue did not originate from a vulnerability in the core Salesforce platform. Connections were disabled and tokens were invalidated during the response.
4. Support and Identity Provider Access
In Okta’s 2023 support-system incident, threat actors accessed support files associated with 134 customers. Okta reported that some files contained session tokens and that stolen session tokens were used to hijack legitimate sessions for five customers. This illustrates how support systems can hold data or authentication material capable of creating downstream risk.
5. APIs and Connected Applications
API relationships can expose large volumes of data because they are designed for automated access. In 700Credit’s 2025 breach notice, the company said records in its web application relating to customers of dealership clients were copied without authorization. Public reporting later tied the campaign to compromised integration credentials and an exposed API path, but the regulator notice itself should be treated as the primary confirmation of the data event.
6. Third-Party JavaScript and Client-Side Code
Websites commonly load external scripts for payments, analytics, advertising, tag management, personalization and customer support. If an external script or delivery infrastructure is compromised, malicious code can execute inside the user’s browser. In ecommerce environments, this is the model behind web-skimming and Magecart-style attacks.
PCI DSS v4.0.1 Requirements 6.4.3 and 11.6.1 specifically address payment-page script authorization, integrity and change/tamper detection. For additional context, see ScanTitan’s Magecart attack coverage.
7. MSP and Remote Management Software
Managed service providers and remote-management platforms can amplify access because one administrative environment may connect to many customers. The 2021 Kaseya VSA attack demonstrated how an upstream software/RMM compromise can produce downstream ransomware effects across a large customer ecosystem.
How Much Does a Third-Party Data Breach Cost?
IBM’s 2026 Cost of a Data Breach report puts the global average breach cost at $4.99 million, a 12% increase from the prior report. That figure covers breaches broadly, not only third-party events.
For third-party vendor and supply-chain compromise specifically, the latest directly verified vector-specific benchmark in our research comes from IBM’s 2025 report: $4.91 million per breach on average. IBM ranked third-party vendor and supply-chain compromise as the second-most prevalent and second-costliest initial attack vector in that edition.
| Cost metric | Value | Report year | Important limitation |
|---|---|---|---|
| Global average data breach cost | $4.99M | IBM 2026 | All breach vectors |
| Third-party vendor / supply-chain compromise | $4.91M | IBM 2025 | Latest verified supply-chain-specific vector cost used here |
These values should not be presented as a same-year comparison. We also do not estimate a 2026 third-party cost by simply applying the global growth rate to IBM’s 2025 supply-chain figure.
Financial Impact Extends Beyond Incident Response
Data breach costs can include investigation and escalation, customer and regulator notification, legal work, post-breach remediation, lost business and operational interruption. IBM says detection/escalation and lost business made up the majority of the 2026 global average. Third-party incidents can add coordination costs because evidence, access logs, contractual responsibilities and notification obligations may sit across multiple organizations.
Why Third-Party Breaches Are Harder to Detect and Contain
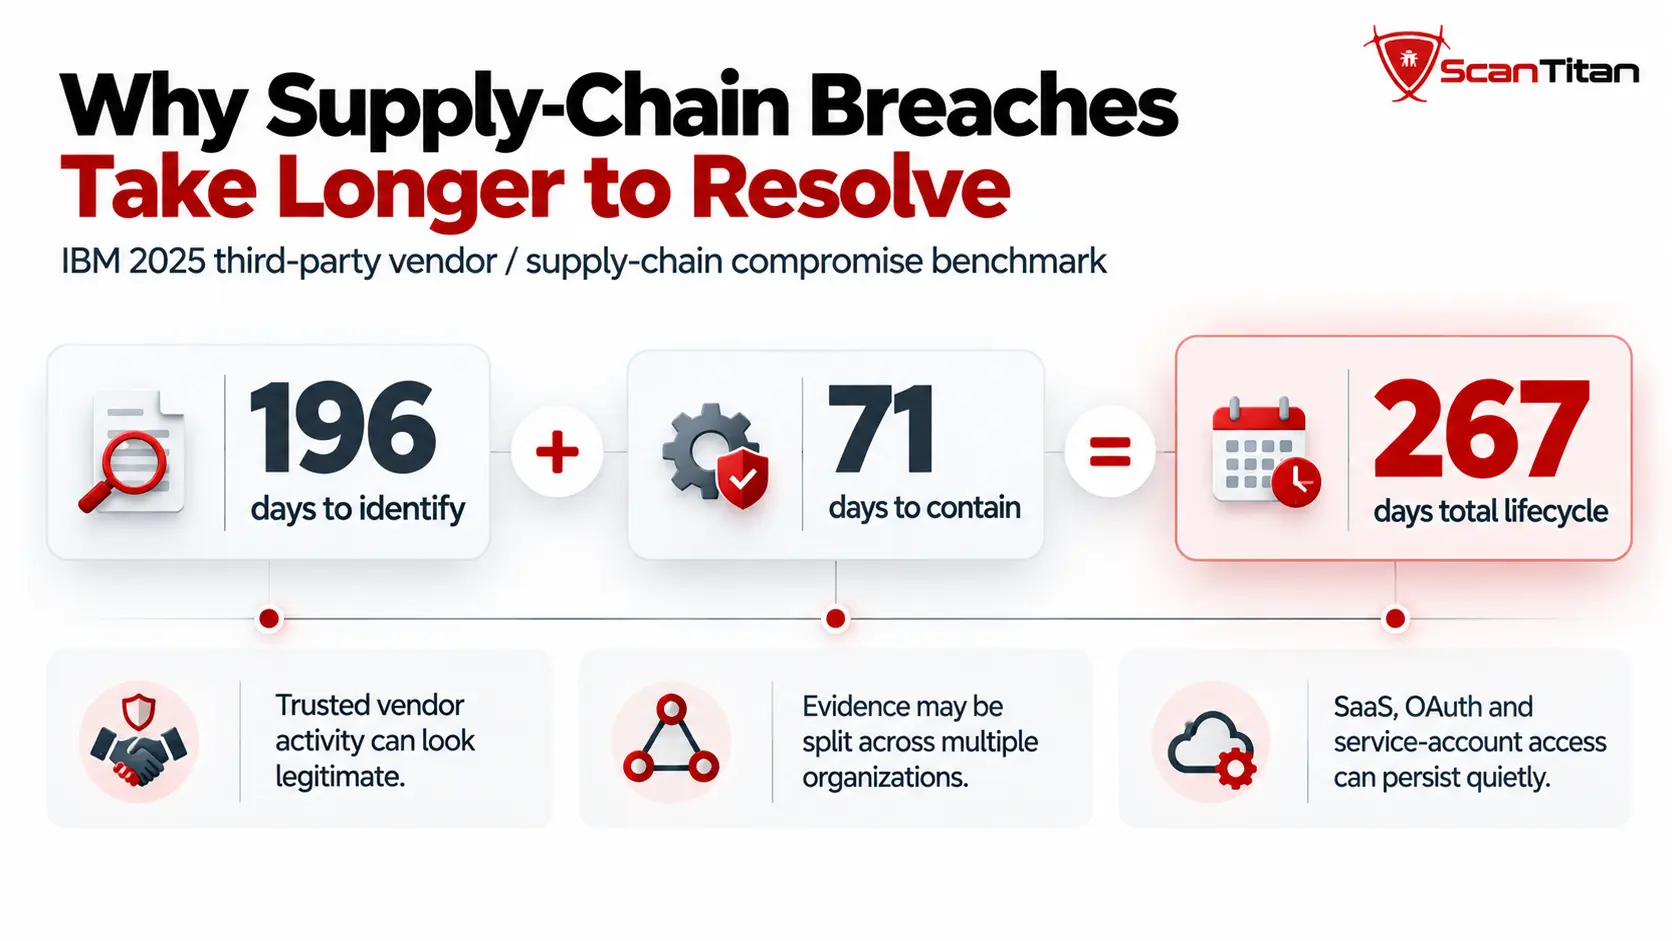
IBM’s 2025 data shows third-party vendor and supply-chain compromise had a 267-day mean lifecycle: 196 days to identify and 71 days to contain. It was the longest lifecycle among the initial attack vectors listed in that report.
Identify: 196 days + Contain: 71 days = 267-day lifecycle
The figure should not be described as “267 days to detect.” It combines identification and containment.
Trusted Activity Can Look Legitimate
Third-party activity may arrive through a valid vendor account, approved application, signed software package, support connection or OAuth token. These are mechanisms defenders normally expect to trust. That can make malicious activity harder to distinguish from routine business traffic.
Organizations May Not Know Exactly What Their Vendors Can Access
Third-party access can accumulate over time. A SaaS application may retain OAuth scopes that allow it to read or write sensitive records, an API integration may keep long-lived keys, a support provider may have administrator or service accounts, and a vendor may still be able to reach shared cloud data after the original business need has changed.
That creates a visibility problem: an organization may know which vendors it uses without having a current answer to which data each vendor can read, which actions it can perform, which tokens remain active, and whether that access is still required. Reviewing OAuth grants, API permissions, privileged support accounts, shared repositories and stale vendor access is therefore part of understanding the real third-party attack surface.
Organizations May Lack Visibility Into Vendor Environments
Forensics can also depend on evidence held by another organization. A customer may know that data was accessed but still need the vendor to establish when the attacker entered, which credentials were used, what logs exist and which downstream tenants were exposed.
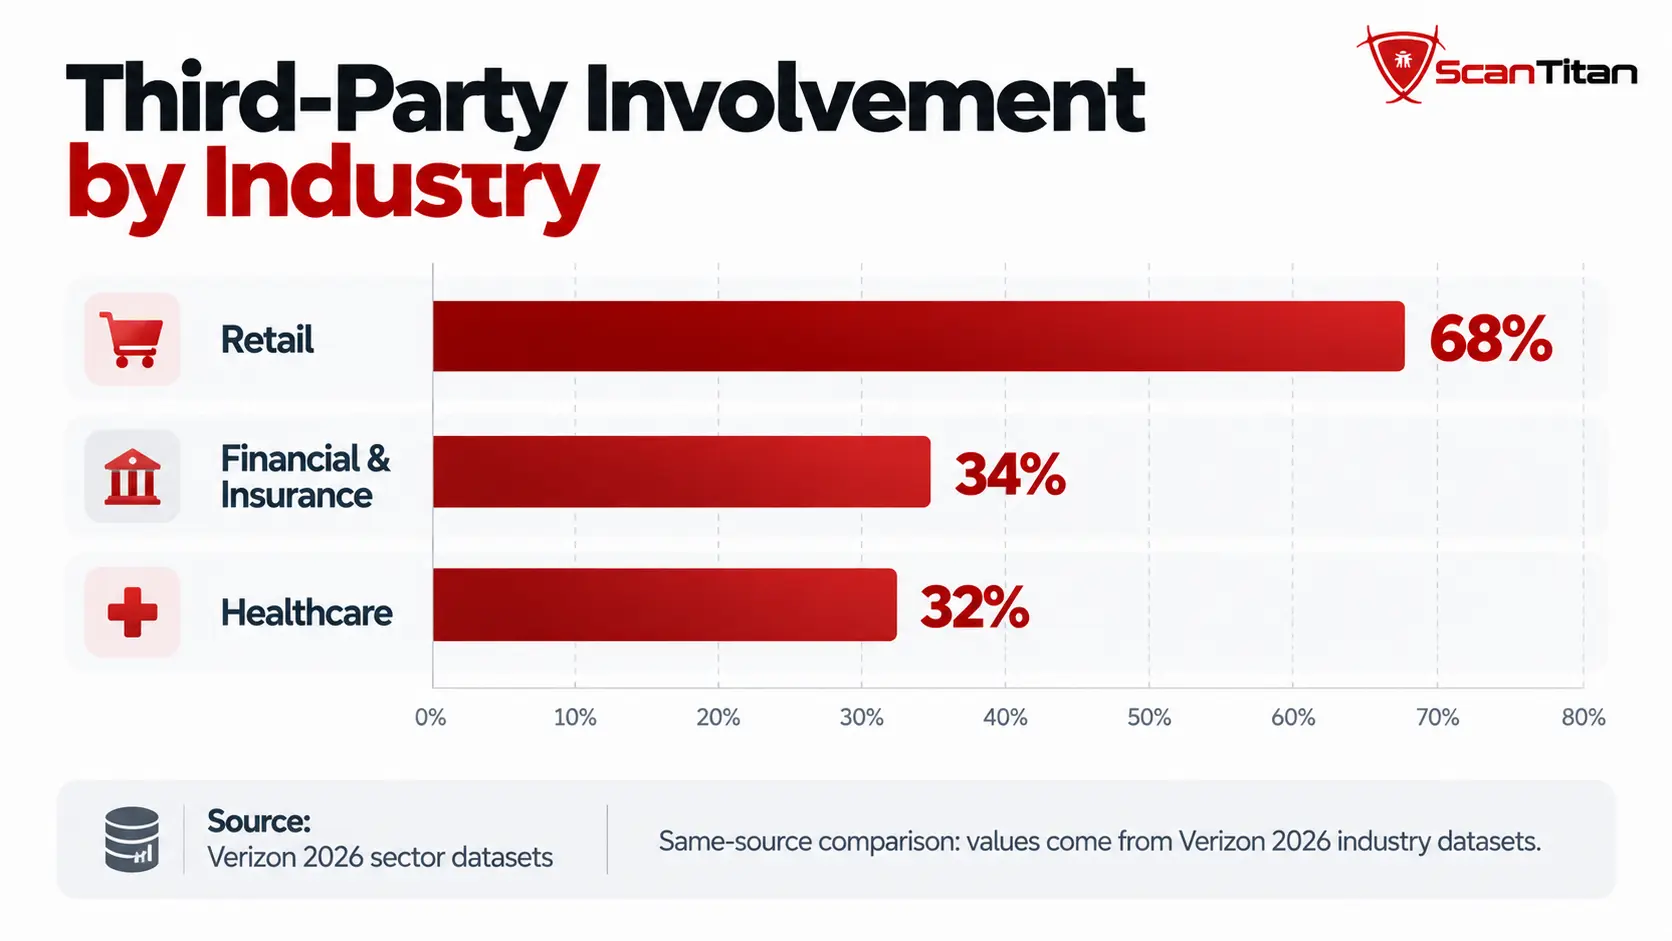
Third-Party Data Breach Statistics by Industry
Third-party involvement is not uniform across industries. The most useful comparison is one built from the same source family and reporting period rather than combining unrelated surveys and regulator datasets.
| Industry | Third-party involvement | Source | Interpretation |
|---|---|---|---|
| Retail | 68% | Verizon 2026 Retail snapshot | High dependence on ecommerce platforms, vendors, payment ecosystems and commercial software |
| Financial & Insurance | 34% | Verizon 2026 DBIR | Material exposure through ICT providers, software and service relationships |
| Healthcare | 32% | Verizon 2026 Healthcare snapshot | Business associates, processors, EHR ecosystems and service-provider access are important dependencies |
Retail: 68% Third-Party Involvement
Retail stands out in Verizon’s 2026 sector data, where third parties were involved in 68% of breaches. The same retail dataset shows vulnerability exploitation as an especially important initial-access route. For the complete sector analysis, see ScanTitan’s Retail Data Breach Statistics.
Financial Services: 34%
Verizon reports 34% third-party involvement in Financial and Insurance breaches. Financial organizations rely on core banking services, fintech integrations, payment infrastructure, SaaS, cloud and other ICT providers, which is one reason third-party operational resilience is also central to regulations such as DORA. See ScanTitan’s Financial Data Breach Statistics for a deeper sector view.
Healthcare: 32%
Verizon’s 2026 Healthcare snapshot reports 32% third-party involvement. Healthcare organizations often depend on business associates, clearinghouses, billing systems, analytics providers and EHR-connected services that may handle protected health information.
Recent Third-Party Data Breaches in 2025–2026
Recent cases show why third-party risk is now broader than traditional outsourced IT. The examples below include SaaS integrations, consulting firms, healthcare-connected vendors, software vulnerabilities and customer-data platforms.
| Disclosure | Third-party mechanism | What was confirmed | Measurement caution |
|---|---|---|---|
| Salesloft / Drift (2025) | Compromised SaaS connection credentials / OAuth access | Salesforce said unusual activity through Drift could result in unauthorized customer-data access and that the core Salesforce platform was not the source vulnerability. | Describe as an integration compromise, not a Salesforce platform breach. |
| 700Credit (2025) | Web application / integration ecosystem | 700Credit said records relating to customers of dealership clients were copied without authorization. | The regulator notice confirms the breach; more specific API-root-cause claims require separate sourcing. |
| Aetna / Berkeley Research Group (2026 disclosure) | Third-party consulting firm | Aetna said BRG suffered unauthorized access and copied data that potentially included member identifiers and health information. | The underlying vendor intrusion occurred in 2025; Aetna’s notification/update was issued in 2026. |
| Northeast Georgia Health System / Gorilla Health (2026) | Vendor connection through healthcare ecosystem | NGHS said PHI may have been compromised through Gorilla Health, a vendor connected through its Epic relationship. | Useful example of risk propagating through layered vendor relationships. |
| Digital Science third-party provider (2026) | Supply-chain integration into CRM | Digital Science said a provider compromise enabled access to a limited set of CRM data via the provider’s standard integration. | Customer impact was limited to data accessible through the integration. |
| Pathpoint / third-party software zero-day (2026) | Unknown vulnerability in licensed third-party software | Pathpoint said attackers exploited a previously unknown flaw in licensed software and accessed connected databases. | A strong example of vulnerable third-party software rather than vendor-network intrusion. |
Salesloft / Drift: SaaS Trust as the Attack Path
Salesforce’s security advisory said the 2025 Drift incident involved compromised connection credentials associated with the Salesloft Drift application. Salesforce disabled affected integrations, while active access and refresh tokens were invalidated. The case demonstrates how a connected application can become a proxy into customer environments without a vulnerability in the underlying CRM platform itself.
Aetna / Berkeley Research Group: Data Held by a Consultant
In July 2026, Aetna said third-party consulting firm Berkeley Research Group had experienced unauthorized access to its systems. BRG determined that information was copied from its network, and Aetna said potentially impacted data included names together with identifiers or health information. This is the classic processor/custodian model: the customer organization’s data is exposed in a vendor environment.
Pathpoint: Third-Party Software Without a Vendor-Network Breach
Pathpoint disclosed in August 2026 that an attacker exploited a previously unknown vulnerability in third-party software used by its internal analytics environment. The attacker then viewed or potentially downloaded data from connected databases. This is an important classification example because the third party was involved through vulnerable software rather than through a confirmed compromise of the software vendor’s own network.
Largest and Most Important Third-Party Data Breaches
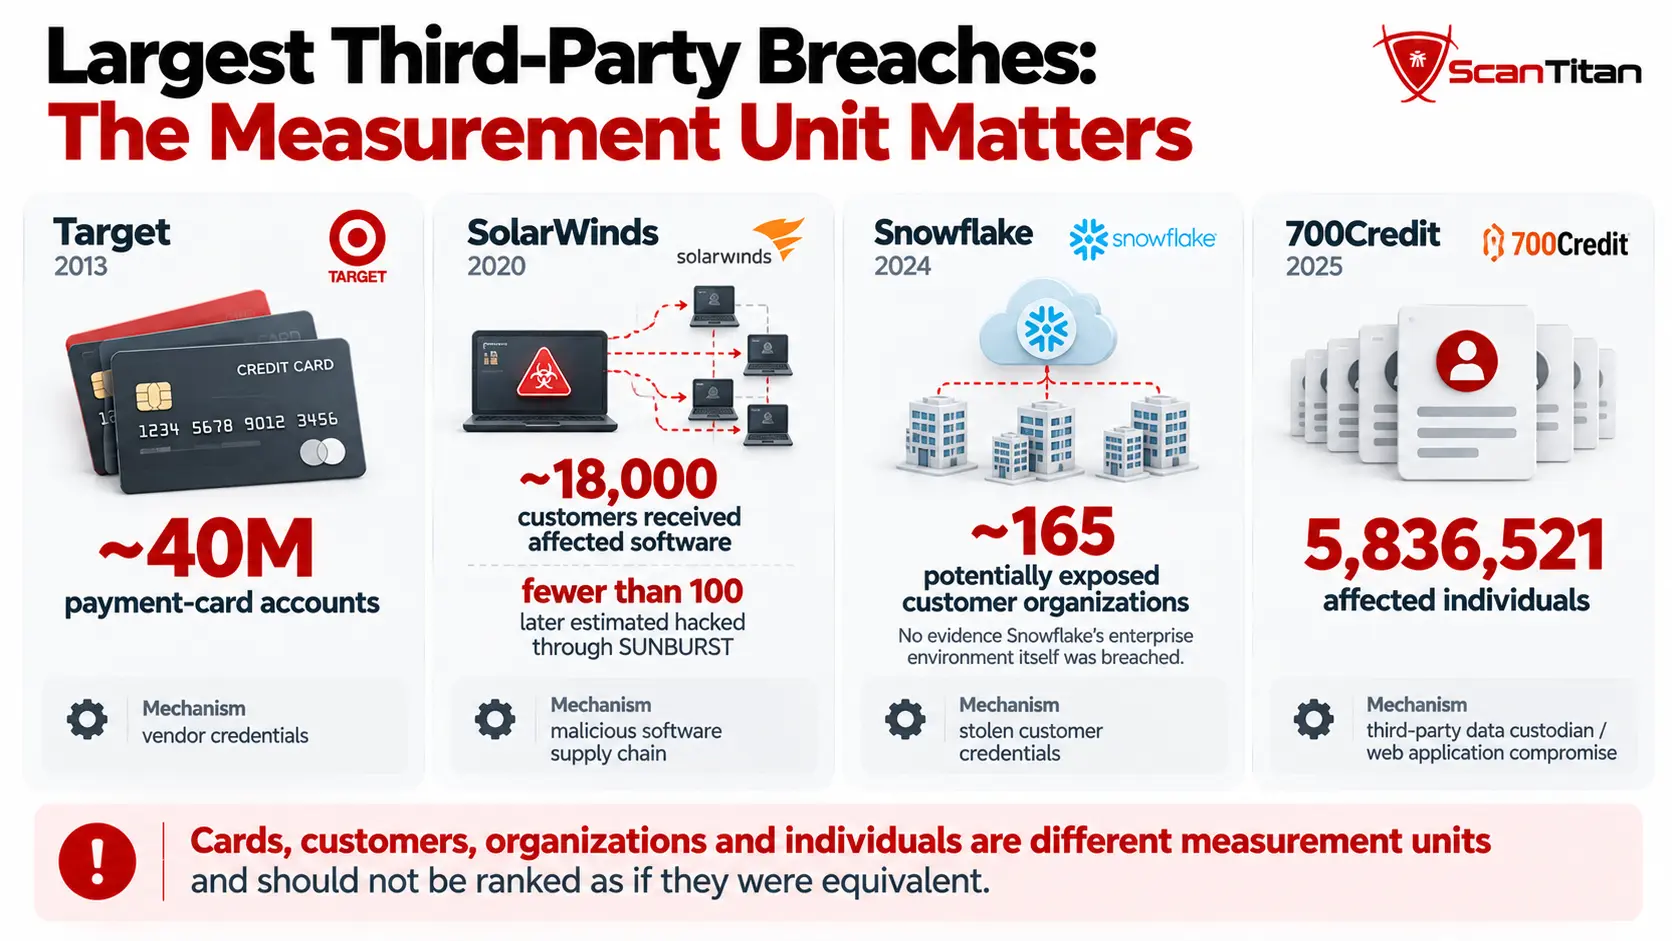
Historical incidents are more useful when organized by mechanism and measurement unit rather than simply ranked by the largest headline number. The table below normalizes ten cornerstone cases and shows where a public count is unavailable or measures something different from confirmed compromise.
| Incident | Year | Mechanism | Upstream party / dependency | Affected organizations | People / accounts / records | Measurement caveat |
|---|---|---|---|---|---|---|
| Target | 2013 | Stolen vendor credentials → POS intrusion | Third-party HVAC vendor relationship | 1 primary downstream enterprise: Target | ~40M payment-card accounts; up to 70M individuals with contact information | The 40M and 70M figures describe different exposed data populations and should not be added. |
| SolarWinds Orion | 2020 | Build-system / malicious software update | SolarWinds Orion software supply chain | Up to ~18,000 affected-version downloads; SolarWinds later estimated fewer than 100 customers hacked through SUNBURST | No single comparable people/record count | Distribution exposure ≠ follow-on targeting ≠ confirmed customer compromise. |
| Accellion FTA | 2021 | Zero-day exploitation and data theft/extortion | Accellion File Transfer Appliance | Multiple government and private-sector organizations; CISA did not publish one final global customer count | Varied by downstream victim | Count downstream victim notices separately from the shared FTA vulnerability campaign. |
| Codecov Bash Uploader | 2021 | Compromised uploader used to exfiltrate environment data | Codecov Bash Uploader / CI pipeline integration | Codecov notified specifically impacted organizations; no single public total in its post-mortem | Git remote URLs and environment variables rather than a standardized people count | Potential CI secret exposure is not equivalent to a confirmed downstream data breach at every user. |
| Kaseya VSA | 2021 | VSA exploitation → downstream ransomware | Kaseya on-premises VSA used by MSPs | Fewer than 60 directly compromised Kaseya customers; fewer than 1,500 downstream businesses | No single standardized personal-record count | Direct Kaseya customers and downstream MSP clients are different measurement units. |
| LastPass | 2022 | Third-party software exploit → cloud-backup access | Vulnerable third-party software on a DevOps engineer plus third-party cloud storage | Customer count not quantified in the incident notice | Customer account metadata and backups of customer vault data were copied; exact unique-person count not stated | Encrypted vault fields remained encrypted; scope should not be converted into a made-up victim count. |
| 3CX DesktopApp | 2023 | Cascading software-in-software supply-chain compromise | 3CX DesktopApp after an earlier upstream compromise | Publicly confirmed impacted-organization total not standardized | No single people/record count | 3CX said the vast majority of systems with affected files were never infected with later-stage malware. |
| MOVEit Transfer | 2023 | Mass exploitation of CVE-2023-34362 | Progress MOVEit Transfer | Many downstream organizations; final totals depend on the external tracker and cutoff date | Victim totals vary as downstream organizations complete notifications | One vulnerability campaign can generate thousands of downstream disclosures; do not treat each filing as a separate upstream attack. |
| Okta support system | 2023 | Support-system compromise and session-token abuse | Okta customer support case-management environment | Files associated with 134 customers were accessed; stolen session tokens were used to hijack sessions for 5 customers | No comparable universal people/record count | 134 customer-file exposures and 5 confirmed session hijacks are different impact measures. |
| Snowflake customer campaign | 2024 | Stolen customer credentials, often from infostealers | Snowflake customer instances; not a breach of Snowflake’s enterprise environment | ~165 potentially exposed organizations notified by Mandiant and Snowflake | Varied by downstream customer disclosure | Describe these as customer-instance compromises, not a single Snowflake platform breach. |
SolarWinds: Distribution Does Not Equal Active Compromise
SolarWinds is a key measurement lesson. Roughly 18,000 customers were associated with affected Orion software distribution, but that does not mean 18,000 organizations were actively breached. SolarWinds later said it believed fewer than 100 customers were actually hacked through SUNBURST. Affected software distribution, follow-on targeting and confirmed compromise are separate units.
MOVEit: One Vulnerability, Many Downstream Victims
CISA added CVE-2023-34362, an SQL injection vulnerability affecting MOVEit Transfer, to its Known Exploited Vulnerabilities catalog after active exploitation. The campaign produced disclosures from many organizations using affected software. Each downstream notification represented a separate affected customer, but not a separate upstream vulnerability.
Snowflake: A Critical Attribution Distinction
Mandiant reported that its investigations into the 2024 Snowflake customer campaign found no evidence the unauthorized access came from a breach of Snowflake’s enterprise environment. Incidents Mandiant handled were traced to compromised customer credentials, often previously stolen by infostealer malware. Mandiant and Snowflake notified approximately 165 potentially exposed organizations.
This is why “Snowflake customer breaches” is more accurate than describing the campaign as a single breach of Snowflake itself.
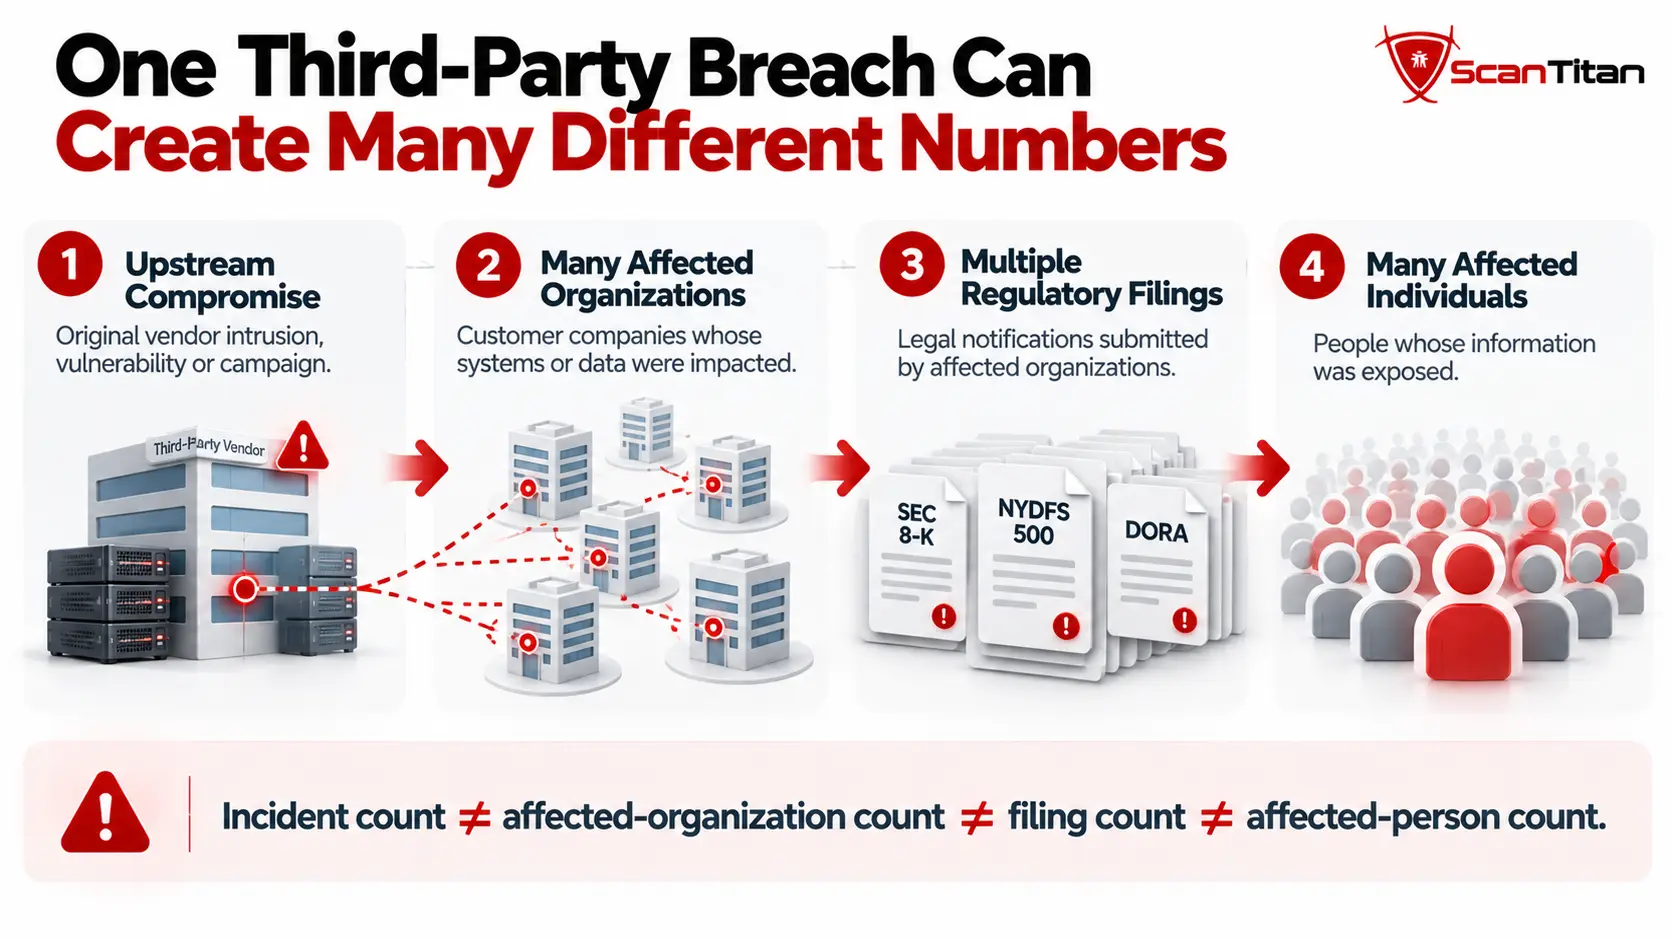
Why One Third-Party Breach Can Create Thousands of Disclosures
Third-party incidents create a counting problem that can dramatically distort breach statistics if the measurement unit is not stated.
1 upstream compromise → many customer organizations → many regulatory notices → millions of affected people
| Measurement unit | What it counts | Why it is different |
|---|---|---|
| Upstream intrusion / exploit campaign | The original technical compromise or vulnerability campaign | One upstream event can reach many organizations |
| Affected organizations | Customer entities whose systems or data were affected | Each customer may investigate and disclose separately |
| Regulatory filings | Notifications submitted to regulators | One organization may file in several jurisdictions |
| Affected individuals | People whose information was exposed | Can reach millions even when there was one upstream campaign |
MOVEit is an especially useful example because the same vulnerability campaign produced a very large downstream reporting footprint. A research article should therefore avoid adding every customer notice together and describing the result as an equal number of independent supply-chain attacks.
Software Supply Chain Attack Statistics
Software supply-chain telemetry provides useful evidence about attacker activity, but it must be kept separate from confirmed data-breach counts.
Sonatype identified more than 454,600 new malicious open-source packages during 2025, bringing its cumulative total of known and blocked malicious packages to more than 1.233 million across ecosystems including npm, PyPI, Maven Central, NuGet and Hugging Face.
454,600 malicious packages ≠ 454,600 data breaches.
A malicious package can be detected before download, downloaded without reaching production, or executed without causing a confirmed breach. Package telemetry measures threat activity in the software ecosystem, not successful organizational compromise.
This distinction is important enough that software supply-chain attack statistics deserve their own dedicated research page rather than being mixed indiscriminately into third-party breach totals.
Ransomware and Third-Party Access
SecurityScorecard’s analysis of 1,000 breaches from 2024 included 297 ransomware or data-extortion incidents. It found 41.4% of those ransomware/extortion incidents had a third-party nexus, compared with 35.5% third-party linkage across the complete 1,000-breach sample.
That does not mean 41.4% of every ransomware attack worldwide starts through a vendor. It describes the ransomware/extortion subset of SecurityScorecard’s proprietary 2024 dataset.
For broader ransomware trends, see ScanTitan’s Ransomware Statistics.
Third-Party Risk Regulations and Compliance
Third-party cybersecurity obligations vary by sector and jurisdiction. The frameworks below should be treated as regulatory context, not legal advice.
| Framework | Who it affects | Third-party relevance |
|---|---|---|
| SEC cybersecurity disclosure rules | U.S. public companies | Material cybersecurity incidents generally require Item 1.05 Form 8-K disclosure within four business days after the materiality determination, including incidents involving third-party systems when material to the registrant. |
| NIS2 | Covered essential and important entities in the EU | Cybersecurity risk-management measures explicitly include supply-chain security and consideration of direct suppliers and service providers. |
| DORA | EU financial entities and relevant ICT ecosystem | Requires ICT third-party risk management, contractual oversight, dependency mapping and concentration-risk management. |
| NYDFS Part 500 | Covered New York financial institutions | Requires cybersecurity risk management that includes third-party service providers. |
| HIPAA | Covered entities and business associates | Business associates handling PHI have direct security and breach-notification responsibilities. |
| PCI DSS v4.0.1 | Organizations in scope for payment-card data | Includes service-provider controls and specific requirements for payment-page scripts and tamper detection. |
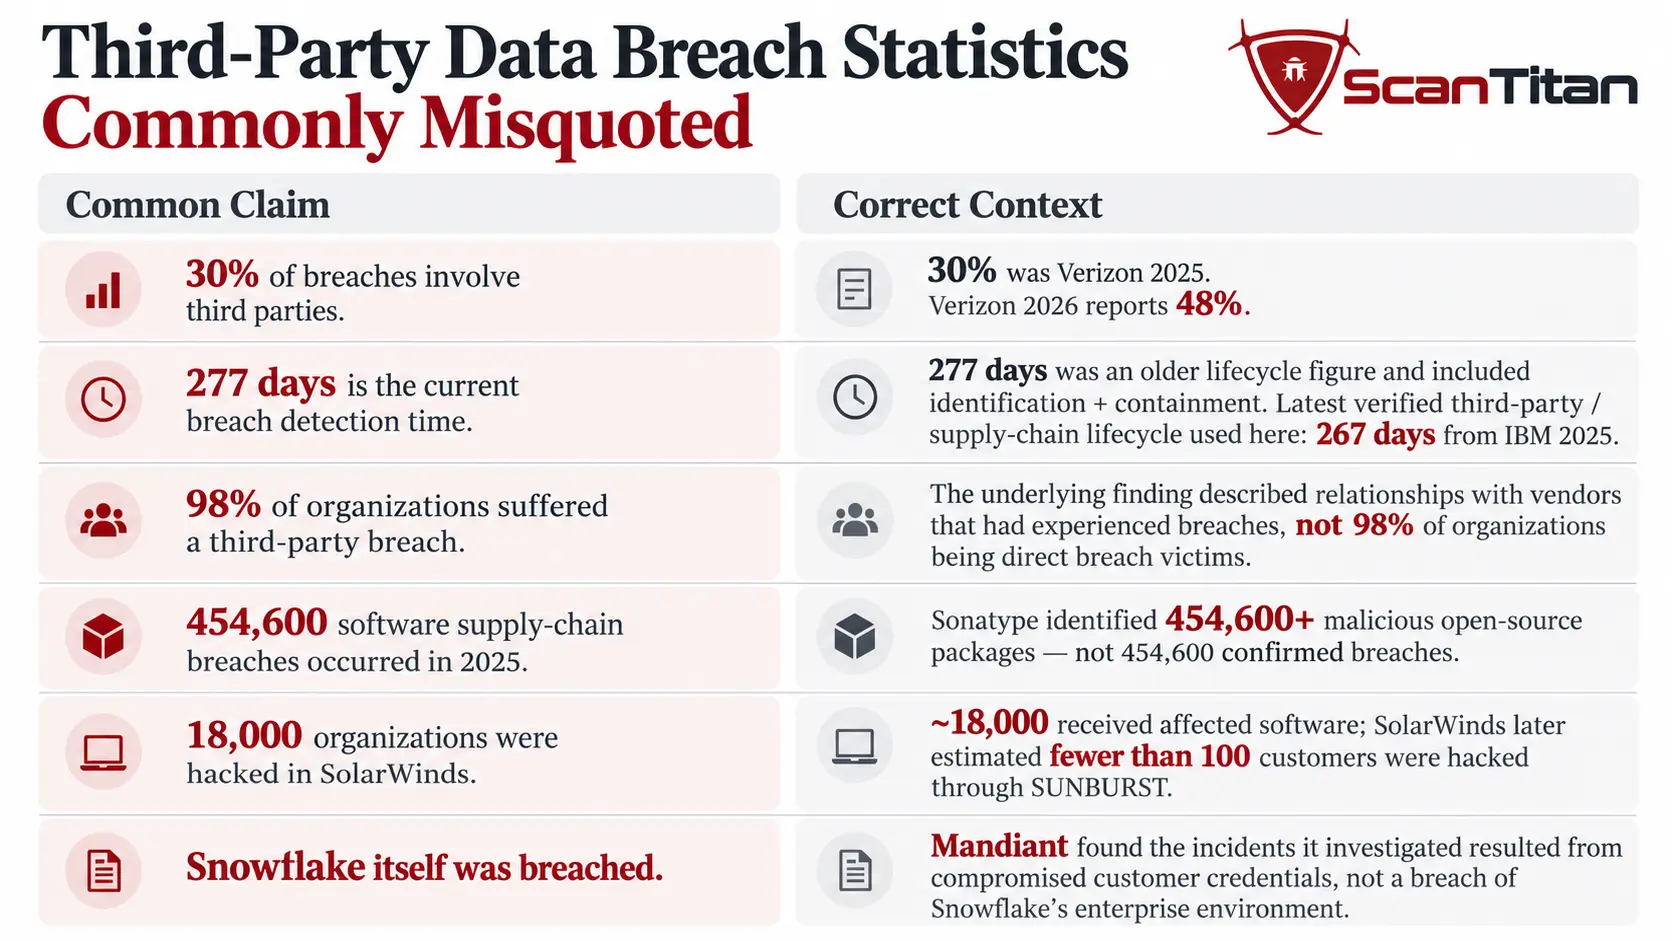
Third-Party Data Breach Statistics Commonly Misquoted
Third-party statistics are frequently recycled across vendor blogs long after the original dataset has changed. A current publication date does not make an old statistic current.
| Common claim | Correct context |
|---|---|
| “30% of breaches involve third parties.” | That was Verizon’s 2025 figure. The 2026 DBIR reports 48%. |
| “20% of breaches involve third parties.” | Older third-party figures should be tied to their original source year rather than presented as a 2026 baseline. |
| “43% of cyberattacks target small businesses.” | This widely recycled statistic lacks a suitable current breach denominator and should not be used as a 2026 third-party breach metric. |
| “277 days is the current average detection time.” | That is an older IBM all-breach lifecycle figure and combines identification and containment. IBM 2025 measured third-party vendor / supply-chain compromise at 267 days total. |
| “Supply-chain breaches cost $4.91M in 2026.” | $4.91M is the verified IBM 2025 third-party vendor / supply-chain compromise benchmark. IBM’s 2026 global average across breaches is $4.99M. |
| “98% of organizations suffered a third-party breach.” | The often-repeated SecurityScorecard/Cyentia finding concerns organizations having relationships with vendors that had experienced breaches, not 98% of organizations themselves being downstream breach victims. |
| “454,600 software supply-chain breaches occurred in 2025.” | Sonatype identified 454,600+ malicious packages, not 454,600 confirmed organizational breaches. |
| “18,000 organizations were hacked in SolarWinds.” | The widely cited figure refers to customers associated with affected Orion distribution. It should not be equated with 18,000 confirmed follow-on compromises. |
| “Snowflake itself was breached in 2024.” | Mandiant said the customer compromises it investigated were traced to stolen customer credentials and found no evidence of a breach of Snowflake’s enterprise environment. |
Research Methodology and Limitations
This research prioritizes primary empirical reports, regulators, standards bodies, official company notices and original incident-response disclosures. Secondary articles are used only when they add context that cannot be recovered from a primary source.
We classify statistics by measurement unit before comparing them:
- Confirmed breach: unauthorized access to or disclosure of data.
- Security incident: an event affecting confidentiality, integrity or availability that may or may not include confirmed data exposure.
- Attack / attempt: exploit attempts, phishing, scans or other activity that may fail.
- Malicious package detection: a software-supply-chain threat artifact, not a confirmed enterprise breach.
- Affected organization: a downstream customer impacted by an upstream event.
- Regulatory filing: a legal notification, which may duplicate the same underlying event across jurisdictions.
- Affected individual / account / record: separate impact units that should not be used interchangeably.
Verizon DBIR: a contributed global corpus compiled from law enforcement, forensic firms, insurers, incident responders and other partners. The 2026 report covers incidents from November 1, 2024 through October 31, 2025.
SecurityScorecard: its third-party figures come from a proprietary analysis of 1,000 breaches from 2024. The denominator should remain attached whenever the 35.5% or 41.4% figures are cited.
IBM: breach-cost figures are based on sampled organizations. The $4.91M third-party/supply-chain cost and 267-day lifecycle used here are from IBM 2025, while the $4.99M global average is from IBM 2026.
Sonatype: its figures measure malicious-package detections in software ecosystems, not successful organizational breaches.
Third-Party Data Breach Statistics: Full Reference Table
| Metric | Value | Year / source | Publication note |
|---|---|---|---|
| Breaches involving a third party | 48% | Verizon 2026 DBIR | Current global DBIR baseline |
| Third-party involvement | 30% | Verizon 2025 DBIR | Previous edition |
| Third-party involvement | 15% | Verizon 2024 DBIR | Expanded third-party measure |
| 2024→2026 change | +33 pp / +220% relative | ScanTitan calculation | Calculated from Verizon published values |
| Vulnerability exploitation | 31% | Verizon 2026 | Known initial access; not third-party-only |
| Credential abuse | 13% | Verizon 2026 | Known initial access; not third-party-only |
| KEVs fully remediated | 26% | Verizon 2026 | Remediation analysis |
| Median full vulnerability resolution | 43 days | Verizon 2026 | Median resolution time |
| Global average breach cost | $4.99M | IBM 2026 | All breach vectors |
| Third-party vendor / supply-chain compromise cost | $4.91M | IBM 2025 | Latest verified vector-specific benchmark used in this research |
| Third-party vendor / supply-chain lifecycle | 267 days | IBM 2025 | 196 days identify + 71 days contain |
| Breaches linked to third-party access | 35.5% | SecurityScorecard, 2024 sample | 1,000-breach proprietary dataset |
| Ransomware/extortion incidents with third-party nexus | 41.4% | SecurityScorecard, 2024 sample | Ransomware/extortion subset |
| Retail third-party involvement | 68% | Verizon Retail 2026 | Sector-specific |
| Financial & Insurance third-party involvement | 34% | Verizon 2026 | Sector-specific |
| Healthcare third-party involvement | 32% | Verizon Healthcare 2026 | Sector-specific |
| New malicious open-source packages | 454,600+ | Sonatype 2026 report / 2025 activity | Threat telemetry, not breach count |
| Cumulative known and blocked malicious packages | 1.233M+ | Sonatype through 2025 | Threat telemetry, not breach count |
Primary Sources
- Verizon — 2026 Data Breach Investigations Report
- Verizon — 2025 Data Breach Investigations Report
- Verizon — 2024 Data Breach Investigations Report
- IBM — Cost of a Data Breach Report 2026
- IBM — Attack Vector / 2025 breach vector analysis
- SecurityScorecard — Global Third Party Breach Report
- Sonatype — 2026 State of the Software Supply Chain
- Salesforce — Salesloft Drift Security Advisory
- Okta — Support Case Management System Root Cause
- Mandiant / Google Cloud — UNC5537 Snowflake Customer Data Theft
- Target SEC filing — 2013 breach impact
- SolarWinds — Investigative Update on SUNBURST
- CISA — Exploitation of Accellion File Transfer Appliance
- Codecov — April 2021 Post-Mortem / Root Cause Analysis
- Kaseya — 2021 VSA Ransomware Incident Update
- LastPass — 2022 Security Incident Update and Recommended Actions
- 3CX — 2023 Supply-Chain Incident / Initial Intrusion Vector
- California Attorney General — 700Credit breach notice
- Aetna — Berkeley Research Group third-party incident notice
- Northeast Georgia Health System — Third-Party Data Security Breach
- Digital Science — Third Party Supply Chain Incident
- Pathpoint — 2026 Third-Party Software Incident
- PCI SSC — Payment Page Security and Preventing E-Skimming
Frequently Asked Questions
What percentage of data breaches involve third parties?
Verizon’s 2026 DBIR reports third-party involvement in 48% of analyzed breaches, up from 30% in the previous edition. The figure describes third-party involvement broadly and should not be interpreted as meaning 48% of breaches began inside a vendor’s own network.
Are third-party data breaches increasing?
Verizon reported third-party involvement at 15% in 2024, 30% in 2025 and 48% in 2026. Because Verizon’s expanded third-party measure appears in the 2024 DBIR, that three-edition sequence is the cleanest recent comparison used in this research.
How much does a third-party data breach cost?
IBM’s latest verified third-party vendor / supply-chain-specific benchmark used here is $4.91 million per breach from the 2025 report. IBM’s overall global average breach cost reached $4.99 million in 2026. They are different report years and should be labeled accordingly.
What is the difference between a third-party breach and a supply-chain attack?
A third-party breach broadly involves a vendor, provider or external platform contributing to data exposure. A supply-chain attack more specifically abuses an upstream trust relationship, product or service to reach downstream targets. Not every vendor data exposure is a supply-chain attack.
How do third-party breaches happen?
Common paths include exploited third-party software, stolen vendor credentials, remote support access, SaaS and OAuth token compromise, exposed APIs, compromised support systems, malicious software updates, third-party JavaScript and MSP/RMM access.
Which industries have high third-party involvement?
In the Verizon 2026 sector datasets used here, third-party involvement was 68% in Retail, 34% in Financial & Insurance, and 32% in Healthcare. These sector-specific figures are more useful than applying the global 48% rate uniformly to every industry.
What is an example of a third-party data breach?
The Target breach is a classic vendor-credential example, while SolarWinds represents a software supply-chain compromise. More recent cases include SaaS/OAuth integration incidents, data-processor compromises and vulnerabilities in licensed third-party software.
Can one vendor breach affect multiple companies?
Yes. One provider, software product or integration can serve many customers. A single upstream compromise can therefore generate many downstream company incidents, regulator notices and affected-person counts. Those units should be reported separately.
Are malicious open-source packages counted as data breaches?
No. Sonatype’s 454,600+ new malicious packages identified in 2025 are software-supply-chain threat detections. They do not represent 454,600 successful corporate breaches.
How can organizations reduce third-party breach exposure?
Risk reduction can include maintaining a current inventory of vendors and internet-facing dependencies, limiting and reviewing vendor access, enforcing MFA and least privilege, monitoring integrations and OAuth tokens, remediating known exploited vulnerabilities quickly, reviewing browser-side third-party scripts, and continuously testing external attack surfaces. A website vulnerability scanner can help identify exposed website and application weaknesses, but vendor governance and identity controls remain separate requirements.